Opening Round

Chapter 1 Opening Round


Spinal Stenosis, Lumbar


Comment


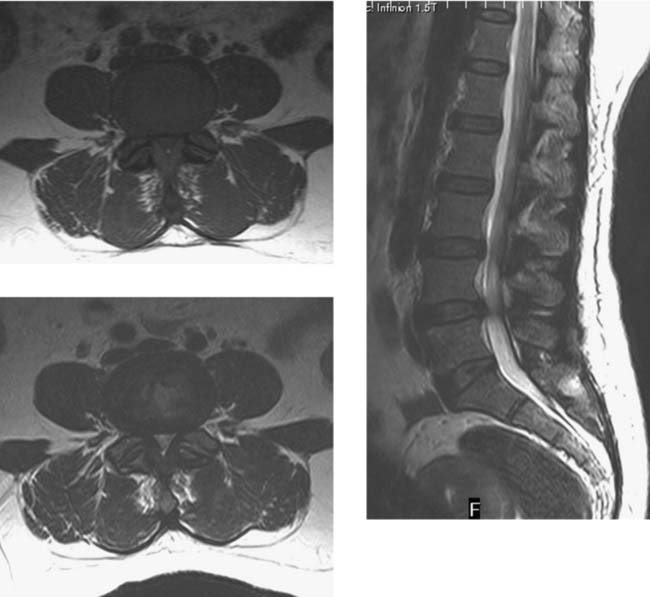
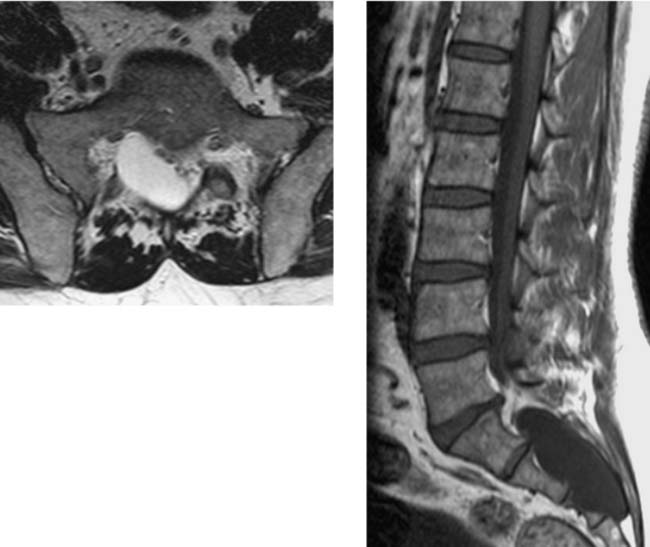
In this 50-year-old woman with back pain and L5 radiculopathy, the T1-weighted (T1W) and T2-weighted (T2W) axial images at the L4–L5 level demonstrate severe central stenosis due to degenerative bony and soft tissue changes as well as congenital canal narrowing. Evidence of a congenital component is best shown on axial images that display developmentally shortened pedicles, yet can be inferred from the relative paucity of CSF in the thecal sac over several vertebral levels, with relatively minor spondylotic changes, on the sagittal T2W image. The severity of the stenosis at L4–L5 is best estimated by the loss of epidural fat signal and the marked narrowing of the thecal sac. Because MR imaging depicts these features directly, measurements of the dimensions of the bony canal on CT or radiography are no longer recommended. In this patient, central stenosis is due to a combination of the degenerative bony (hypertrophic facet joints) and soft tissue (hypertrophic ligamentum flavum, bulging annulus) changes as well as underlying congenital canal narrowing. Another indication of the severity of the central stenosis is the lack of CSF signal surrounding the roots of the cauda equina in the thecal sac, thus obscuring the normal tapering of the conus tip and giving the appearance of a mass of clumped roots (as shown here). Lumbar lateral stenosis may be due to lateral recess stenosis (also present at L4–L5) and/or neural foraminal stenosis. The causes of lateral recess stenosis are hypertrophy of the superior articular facet (most common), bulging/herniated disk, and vertebral body osteophyte. In a recent study, patients with moderate to severe lumbar spinal stenosis on routine imaging most often had the following symptoms and signs: numbness (30%), radicular pain (25%), claudication (21%), and motor weakness (18%). Neurogenic claudication was the presenting symptom in only a quarter of patients.


Because some patients have symptoms without corresponding imaging abnormalities, several investigators have proposed MR imaging of the lumbar canal in the most symptomatic position. They use axial loading to simulate the upright position and assess the severity of stenosis on images acquired during loading to make treatment decisions.


Notes


Diskitis/Osteomyelitis, Lumbar


Comment


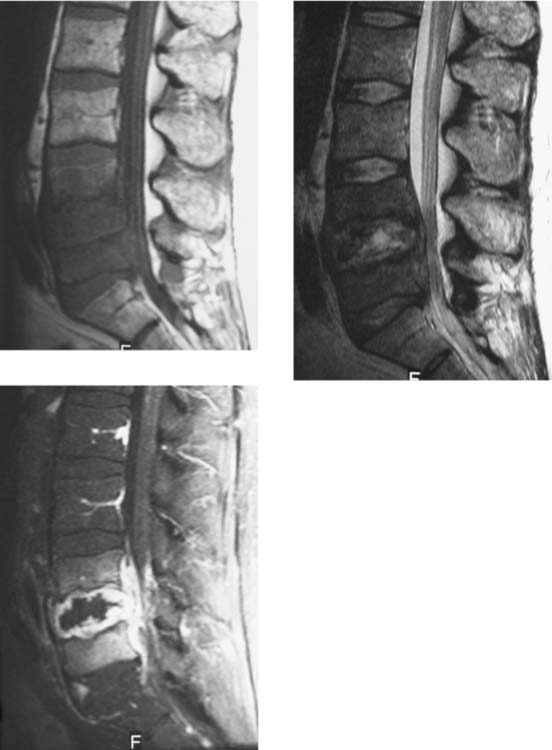
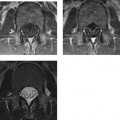
The MR images in this case demonstrate the findings that are considered “typical” of diskitis/osteomyelitis: decreased vertebral body signal on T1W images, loss of endplate definition on T1W images, increased disk signal intensity on T2W images, and contrast enhancement of the disk and adjacent vertebral bodies (on fat-saturated, T1W images in this case). Modic and colleagues reported that these findings were each observed with a frequency of approximately 95%. In comparison, increased vertebral body signal on T2W images was observed in only 56% of spinal levels with diskitis/osteomyelitis. Thus, the absence of this finding should not dissuade the observer from making an MR imaging diagnosis of diskitis and osteomyelitis when the typical findings described above are present (as in this case). The variation in signal intensity of the involved vertebral bodies on T2W images has been attributed in part to variability in the ratio of sclerotic bone (as seen on standard radiographs) to edematous marrow.


The typical contrast enhancement pattern of the involved disk can vary from thick patchy enhancement to linear enhancement to a ring-like peripheral enhancement that is thick (as in this case) or thin, continuous or discontinuous. The intensity of vertebral body enhancement is variable. Enhancement of epidural and paraspinal associated soft-tissue masses provides additional evidence of infection. Homogeneous enhancement favors phlegmon, and ring enhancement favors mature abscess.


Notes


CSF Flow Imaging


Comment


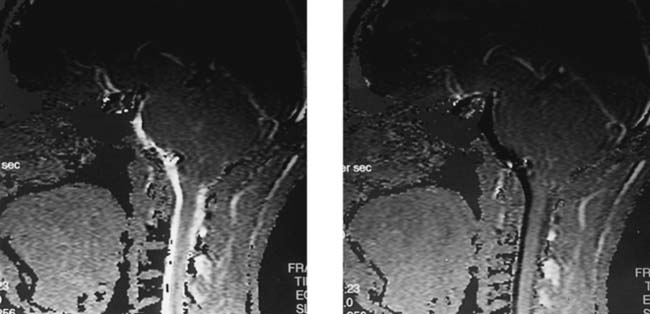
The phase images shown here represent 2 of 14 electrocardiographic-gated images reconstructed from data acquired during each cardiac cycle. With this “phase contrast” technique, the images are obtained in cine mode by pixel-by-pixel computation of the phase difference between two interleaved acquisitions, one being flow compensated and the other having a specific flow encoding. The flow encoding, or flow sensitivity, is usually adjusted by varying the gradient strength or duration. In this case, the flow-encoding gradient is along the superior-inferior (or cephalad-caudad) direction, which is also the read gradient direction. The size of the phase shift resulting from superior-inferior flow is proportional to three factors primarily: (1) the size of the flow-encoding gradient, (2) the magnitude of the CSF velocity in the superior-inferior direction, and (3) the square of echo time (TE). The flow-encoding gradient has been adjusted to give maximum phase shift to CSF moving with a velocity of 8 cm/sec. Caudad flow induces a positive phase shift and is displayed as hyperintense, whereas cephalad flow induces a negative phase shift and appears hypointense relative to nonmoving background tissue (e.g., neck muscles). Regions of CSF with velocities less than 8 cm/sec are either less hyperintense (caudad flow) or less hypointense (cephalad flow).


The two images display a biphasic pattern of CSF flow in the cervical region—caudad flow in response to systole (left-hand figure) and cephalad flow in response to diastole (right-hand figure). In the right-hand figure, note that the subarachnoid space posterior to the cord is less hypointense than the subarachnoid space anterior to the cord, which indicates that cephalad CSF flow is slower posteriorly than anteriorly in this patient being evaluated for possible Chiari I malformation. Haughton and colleagues have evaluated the differences in peak systolic and diastolic CSF velocities at the foramen magnum for Chiari I patients and normal controls. Patients with Chiari I had significant elevations of peak systolic velocity.


The direction and amplitude of CSF flow vary along the spinal axis because of the effects of wave propagation and expansion/contraction of the epidural venous plexus, so the flow pattern in the lumbar region differs from the pattern in the cervical region. The spinal cord also moves, albeit with a velocity at least 10 times less than that of CSF. Phase, or velocity, images (with appropriate setting of the motion-encoding gradient) can demonstrate both the magnitude and the direction of cord motion. Caudad motion of the cord occurs in early systole, at approximately the same time as the onset of caudad CSF flow. Spinal cord tethering is associated with decreased cord velocities relative to normal. In addition to the longitudinal (superior-inferior) component of cord and CSF motion, a smaller transverse component is present. In the case of postoperative scarring in the cervical canal, loss of transverse motion of the cord at the site of focal cord tethering has been demonstrated in addition to decreased longitudinal velocity.


Notes


Postoperative, Recurrent Disk Herniation, Lumbar


Comment


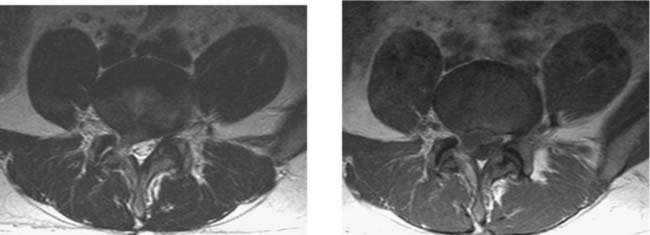
As shown on the fast-spin-echo T2W image, the right ligamentum flavum is disrupted and the anterior aspect of the right lamina has abnormal signal. The right-sided soft tissue mass contiguous with, and isointense to, the intervertebral disk could represent postoperative scar (epidural/peridural fibrosis), recurrent or persistent disk herniation, or a combination of scar plus disk material. On the postcontrast T1W image at the same level, the bulk of the mass does not enhance, compatible with herniation, whereas the thin rim of tissue around the disk does enhance, compatible with mild adjacent scarring. This patient’s symptoms were attributed to recurrent disk herniation.


Typically, a physician who is caring for a patient with symptoms of FBSS wants to know if the clinical symptoms (recurrent back pain, radiculopathy, and functional incapacitation) are primarily due to “scar or disk.” The reported accuracy of postcontrast MR imaging in distinguishing between scar and disk in patients at least 6 weeks postsurgery is in the 96% to 100% range. Whether the time elapsed since surgery is months or years, scar consistently enhances on images acquired immediately following injection of contrast material. Because it is avascular, disk does not enhance on these early images. On delayed images (≥30 min following injection), disk material may enhance because of the diffusion of the low-molecular-weight contrast material (gadolinium chelate) into the disk from adjacent scar, especially when there is a relatively large volume of scar compared with the volume of the herniation. A secondary sign that favors scar over recurrent/persistent disk is retraction of the thecal sac toward the region of aberrant epidural soft tissue. The presence of mass effect is not helpful, since both epidural scar and disk can produce this finding.


Notes


Unilateral Facet Dislocation, Cervical


Comment


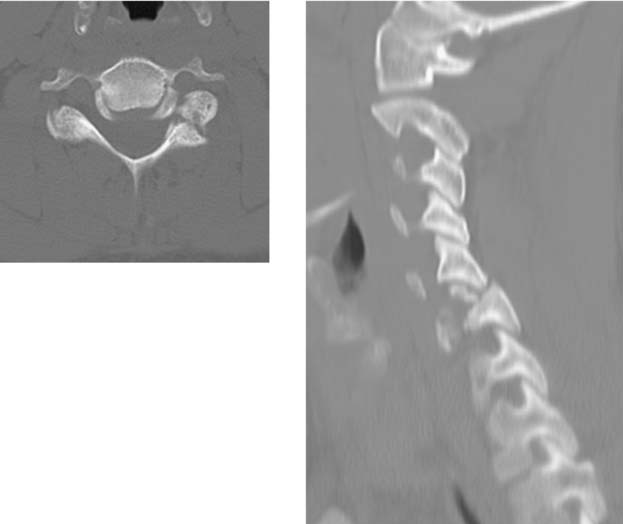
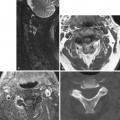
The left parasagittal reformatted CT image demonstrates an abrupt transition from a “lateral view” of the C2 to C5 articular pillars to an “oblique view” of the C6 and C7 facet joints and neural foramina. This appearance is due to the rotation of C5 relative to C6, which results from the left C5 facet dislocation. The dislocation is accompanied by a fracture of the superior articular process of C6. The axial and parasagittal images show the anterior displacement of the fracture fragment and the inferior articular process of C5 relative to the fractured C6 facet.


Cervical rotational facet injury (RFI) has been proposed as a more encompassing term to describe both pure unilateral facet subluxation/dislocation without a fracture and unilateral subluxation/dislocation with a concurrent facet fracture. Approximately 75% of patients with RFI have concurrent facet fractures. As reported by Shanmuganathan et al, fracture of the inferior facet of the rotated vertebra was observed more frequently than fracture of the superior facet of the subjacent vertebra or fractures of both facets. Other authors have reported that unilateral facet fracture most often involves the superior facet. Facet injuries result from a mixture of forces involving rotation, lateral bending, flexion, and distraction. Facet dislocations without fractures have a significantly higher association with spinal cord injury syndromes than do RFIs with fractures. Additional findings in patients with RFI include fracture-separation of the articular pillar (17%) and avulsion fracture of the posteroinferior aspect of the rotated vertebral body, indicating disk disruption (25%).


Notes


Atlantoaxial Rotatory Deformity


Comment


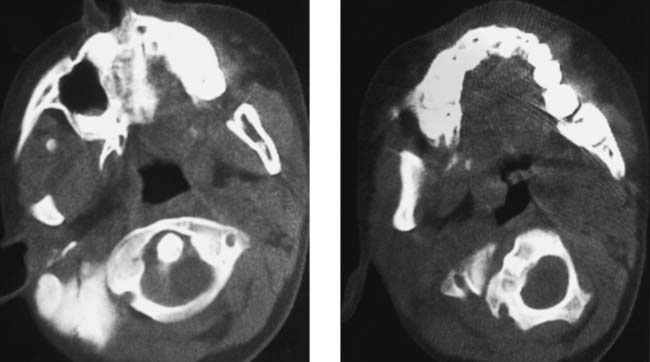
The two CT images represent two sections from the same study, one at the level of C1 (left image) and the other at the level of the C2 body (right image). C1 is rotated clockwise relative to C2 (approximately 45°), and no anterior displacement of C1 on C2 can be seen. Atlantoaxial rotatory deformity is a spectrum of disorders. Rotatory deformity may result from infection, trauma, and other conditions, or it may arise spontaneously (as in this case).


Atlantoaxial rotatory dislocation generally refers to complete dislocation of the C1–C2 facet joints. Rotational deformity of the C1–C2 joints within the physiologic range of motion has been referred to as atlantoaxial rotatory displacement by Fielding and Hawkins (other authors prefer the term rotary subluxation). In this deformity, the joints are not dislocated. If this condition persists and becomes fixed (refractory to nonoperative management), it is then referred to as atlantoaxial rotatory fixation. Recognizing the importance of transverse ligament integrity in determining the degree of canal compromise that can accompany rotational deformities, Fielding and Hawkins describe four types of rotatory fixation:


Notes


Paget Disease, Lumbar


Comment


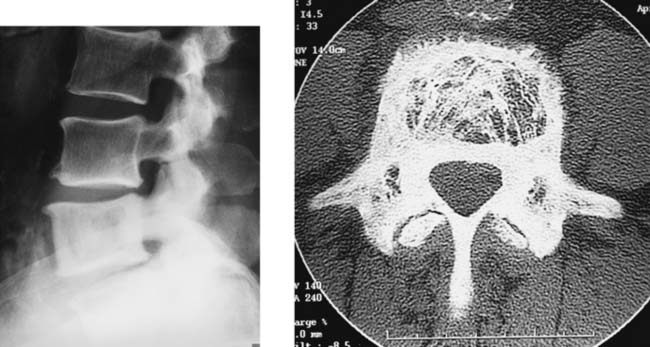
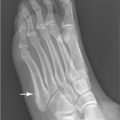
The lateral view of the lumbar spine in this 61-year-old man demonstrates a hyperdense, enlarged L5 vertebral body with a thickened cortex. Cortical thickening results in the appearance of a “picture frame” around the body and thickened pedicles. CT demonstrates the thickened cortex and the coarse trabeculation of cancellous bone, as well as the enlargement of the posterior elements with mild spinal stenosis. The affected facet joints show narrowing of the joint spaces and hypertrophic facets, resulting in moderate pagetic facet arthropathy. Paget disease generally occurs after the age of 50 years. Radiographically, three phases may be seen and may coexist in the same bone: osteolytic (early, active), mixed (intermediate), and osteoblastic (late, inactive). In this case, L5 has features of both mixed and osteoblastic phases. Lymphoma and metastatic prostate cancer tend to have a more uniform increase in bone density and are unlikely to cause vertebral expansion. Monostotic involvement in Paget disease may be mistaken for fibrous dysplasia.


Spinal stenosis resulting from enlargement of the vertebral body and/or the neural arch occurs in about 80% of symptomatic patients and 20% of asymptomatic patients. Pagetic facet arthropathy also occurs in about 80% of symptomatic patients. Compression fractures of involved vertebral bodies are usually asymptomatic. Vascular mechanisms (steal of blood supply from cord or nerve roots, or anterior spinal artery compression by pagetoid bone) have also been proposed to account for symptoms. Primary malignant bone tumors are 20 times more likely to develop in individuals with Paget disease than in age-matched controls. Osteosarcoma is the most common histologic type, followed by fibrosarcoma and chondrosarcoma. Sarcomatous transformation is heralded by the development of a lytic lesion, sometimes with cortical breakthrough, pathologic fracture, and/or a soft tissue mass. The differential diagnosis includes lytic or blastic metastases (e.g., breast, prostate, or kidney primary sites) to pagetic bone.


Notes


Traumatic Vertebral Artery Occlusion


Comment


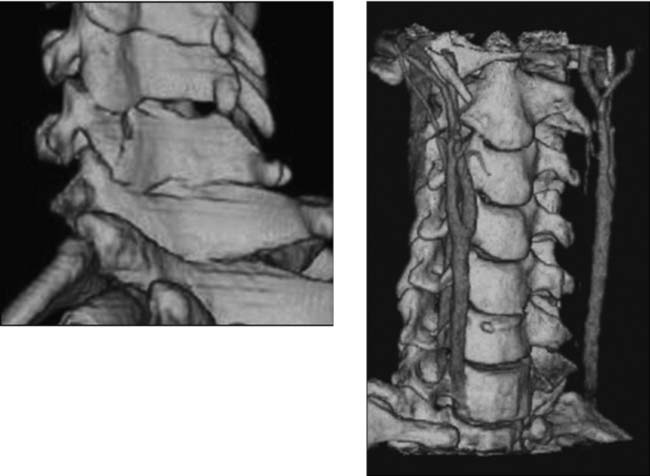
Multidetector-row CT scanners allow rapid helical acquisition of image data during iodinated contrast infusion. Axial source images generated from the acquisition are then post-processed, yielding three-dimensional (3D) reconstructions with volume renderings that display both osseous (vertebral) and vascular (cervical carotid and vertebral arteries) structures, as shown in this case. The left C6 lateral mass fracture is shown on the posterior view, while occlusion of the left vertebral artery is suggested by the absence of this structure on the frontal oblique, CT angiographic view (confirmed on the source images).


On MR angiography, a significant difference in frequency of vertebral artery nonvisualization (occlusion) between acute cervical spine trauma and control patient groups has been reported. Vascular abnormalities, such as nonvisualization and focal narrowing or focal widening of the vertebral arteries on MRA were common; however, symptoms of vertebrobasilar artery insufficiency or posterior circulation infarction were distinctly uncommon. The use of vertebral artery narrowing or of eccentric position relative to the transverse foramen as evidence of vascular abnormality may lead to false-positive results. Recent CT angiography (CTA) evaluation of normal young subjects has shown that vertebral artery size and position in the transverse foramina vary markedly. Thus, normal variations must be considered when evaluating CT (and MR) angiograms for vertebral artery injury.


Notes


Case courtesy of Dr. Diego Nunez.


Caudal Regression Syndrome


Comment


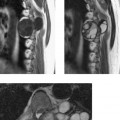
The T2W image shows a blunted, wedge-shaped conus (shorter ventrally as a result of a deficiency of anterior horn cells) with a thin central canal extending over at least four vertebral segments. The conus ends at about the T12–L1 interspace. Sacral dysgenesis is relatively mild, with sacral segments identified through S4–S5. The distal bony canal and thecal sac are narrowed. Patients with sacral agenesis/dysgenesis have been categorized on the basis of conus position: group 1 (40%) has a high conus terminating cephalic to the L1 inferior endplate, and group 2 (60%) has a low conus terminating caudal to L1. In about 90% of group 1 patients, the conus has a blunted contour (similar to the case shown). This case is atypical, however, in that group 1 patients tend to have a large sacral defect, with the sacrum ending above S1. In group 2 patients, the conus is often elongated as a result of tethering to a thickened filum, lipoma, or myelocystocele. Terminal hydromyelia may be observed in either group. Sacral dysgenesis is relatively mild in group 2 patients; however, their clinical course is more likely to involve neurologic deterioration because of cord tethering. Terminal myelocystoceles and lipomeningoceles are associated with sacral agenesis/dysgenesis in approximately 9% and 6% of cases, respectively. Other anomalies associated with caudal regression include myelomeningocele, diastematomyelia, anterior sacral meningocele, and dermoid.


About 16% of patients with the caudal regression syndrome have diabetic mothers, and about 1% of diabetic mothers have offspring with the syndrome. It has been hypothesized that sacral agenesis/dysgenesis may occur as a result of hyperglycemia in a genetically predisposed fetus early in gestation. The insult, like that resulting from various teratogenic agents, may prevent canalization and retrogressive differentiation of the caudal cell mass. Alternatively, the insult may promote excessive retrogression resulting in the sacral deformity and/or anorectal and urogenital malformations. The ventral aspect of the conus may be more affected than the dorsal aspect because the ventrolateral and ventral vascular supply develops earlier, thus allowing enhanced delivery of blood-borne teratogens.


Notes


Feb 14, 2016 | Posted by in MUSCULOSKELETAL IMAGING | Comments Off on Opening Round

Full access? Get Clinical Tree

Get Clinical Tree app for offline access