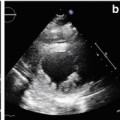
Fig. 17.1
Biventricular involvement in a patient with arrhythmogenic right ventricular cardiomyopathy (ARVC) seen as fatty infiltration of both ventricles: T1-weighted (a) and fat-saturated (b) short-axis images. Note the extensive hyperintensity of RV walls in the T1-weighted image, suppressed (dark) at the fat-saturation image. An area of fatty infiltration is also present at the intraventricular septum (IVS) (arrows), and small spotty hyperintense areas in the left ventricular (LV) free walls
These findings were initially encouraging. However, CMR image interpretation for assessing fatty infiltration is difficult, and a significant proportion of patients have nondiagnostic scans [6]—even with state-of-the-art clinical CMR protocols—due to coil proximity and motion artifacts [7, 8], thus leading to misdiagnosis of ARVC [9]. In addition, fatty infiltration is frequently observed in CMR examinations from normal and obese individuals and in patients with clinical conditions that are not linked to ARVC [10–12]. Accordingly, fatty infiltration assessed by CMR was not included in the original [13] or revised diagnostic Task Force Criteria for ARVC [14].
17.2.2 Late Gadolinium Enhancement
Late gadolinium enhancement (LGE) of the RV wall was reported in various studies in ARVC patients and correlated with fibrofatty changes, inducible ventricular tachycardia (VT), and severe RV dysfunction confirmed on biopsy [15–19]. LGE was also described in the LV, particularly in familial forms with desmoplakin mutations, which exhibit a phenotype of left-dominant arrhythmogenic cardiomyopathy (LDAC) [20, 21].
17.2.3 Cine CMR
Cine CMR with gradient recall echo (GRE) or steady-state free precession (SSFP) sequences may be used to assess RV volumes in ARVC with good interobserver correlation (r = 0.90 for LV, and r = 0.89 for RV volumes) [3]. Quantitative RV evaluation by CMR may have a high sensitivity and specificity for ARVC diagnosis [22]. Cine CMR is also useful in assessing wall motion. RV morphological abnormalities found at cine CMR are important findings in ARVC and are frequently found in the midcavity and basal regions of the RV [23–26] (Fig. 17.2, Clips 17.1 and 17.2). Regional functional abnormalities correlate with areas of signal abnormality, and the association of both types of abnormality is more suggestive of ARVC than either of them alone [27]. Cine-CMR-derived quantitative [end-diastolic and end-systolic volumes and ejection fraction (EF)] and qualitative (WMA) parameters are highly reproducible [28].
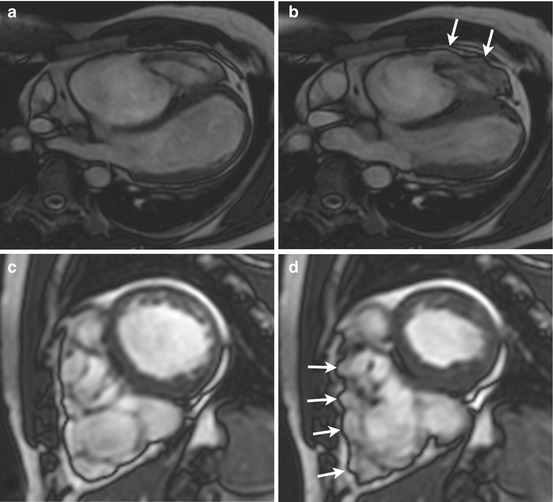
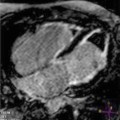
Fig. 17.2
Biventricular wall motion abnormalities (WMA) in a patient with arrhythmogenic right ventricular cardiomyopathy (ARVC) and left ventricular (LV) involvement seen at steady-state free precession (SSFP) imaging. End-diastole (a, c), end-systole (b, d). Four-chamber off-axis (a, b), and short-axis (c, d) slices. Note RV end-systolic bulging areas in b and d (arrows). Apical LV hypokinesis is also present
17.2.4 Left Ventricular Involvement
CMR assessment of LV involvement using volume analysis and LGE imaging is integral to delineation of distinct patterns of disease expression [29]. Correlation of electrocardiogram (ECG), arrhythmia, and CMR findings in ARVC patients revealed three patterns of disease expression: (1) classic, with isolated RV disease or LV involvement in association with significant RV impairment; (2) LDAC, with early and prominent LV manifestations and relatively mild right-sided disease; (3) biventricular, characterized by parallel involvement of both ventricles. In the well-recognized classic form of the disease, LV LGE is observed in the setting of global RV dysfunction, with a predilection for the inferolateral wall and the inferior wall–septal junction, consistent with reports from pathological series [29, 30]. LV dilation may also occur, but the RV is consistently more severely affected. LV LGE in ARVC is commonly found in a subepicardial or midwall distribution, in concordance with the pattern of fibrofatty substitution observed on histopathology, and is distinct from the subendocardial involvement characteristic of ischemic heart disease [29]. A study using cardiac-tagged CMR to measure regional circumferential strain showed that ARVC is associated with regional LV dysfunction, which appears to parallel the degree of RV dysfunction [31].
17.2.5 Diagnostic Accuracy of Cardiac Magnetic Resonance
CMR is a valuable component of the diagnostic workup for ARVC. Sensitivity and specificity of 100 and 29 %, respectively, are reported in patients fulfilling Task Force Criteria, and 96 and 78 %, respectively, in genotyped individuals when the exam is performed with a dedicated protocol by experienced specialists [21]. Combining multiple diagnostic criteria for ARVC yields the highest diagnostic accuracy [32].
In 2010, a revision of the Task Force Criteria for the Diagnosis of ARVC was published [14], suggesting RV dilation and severe regional WMA as imaging criteria to establish evidence for the disease. Compared with the original Task Force Criteria [33], this revision seemed to maintain a high specificity without improving sensitivity for identifying early forms of ARVC.
17.2.6 Limitations
CMR was found to be a potentially frequent cause of misdiagnosis of ARVC due to overreliance on the presence of intramyocardial fat/wall thinning assessed by this technique in the absence of other Task Force Criteria [9]. RV wall motion must also be carefully evaluated, as abnormalities have been reported in >93 % of healthy individuals undergoing CMR for RV evaluation [34]. False-positive diagnosis by CMR may primarily be related to perceived motion abnormalities not seen by RV angiography [35]. The importance of expert interpretation of the complex-shaped RV and the need for quantitation of RV structure and function were emphasized by the North American Multidisciplinary Study of ARVC, as the authors of that study reported a high rate of high-false-positive CMR scans read by less experienced referral centers [36].
17.3 Computed Tomography
Whereas CMR is the imaging tool of choice in ARVC, computed tomography (CT) may also show the typical findings of RV dilatation, reduced EF, and fatty infiltration in the RV free wall and interventricular septum [37–41]. As with CMR, fatty infiltration of the RV free wall is not specific to ARVC and was found in 17–40 % of patients affected by other pathologies [42–44].
17.4 Single-Photon-Emission Computed Tomography
Decreased RV EF, RV dilatation, nonsynchronized contraction of the ventricles, increased RV contraction dispersion, presence of segmental RV wall motion disorders and/or phase delays, and—occasionally—regional LV abnormalities may be demonstrated in ARVC patients by gated-blood-pool single-photon-emission CT (SPECT) [45]. In addition, LV involvement in ARVC may be seen as perfusion defects at thallium-201 radiochemical thallium chloride [(201)Tl] SPECT [46]. Abnormal adrenergic innervation occurred frequently in ARVC patients and was associated with a higher incidence of recurrent ventricular tachyarrhythmias [47]. LV involvement may also be detected at early stages with [123]I-metaiodobenzylguanidine ([123]I-MIBG) SPECT [48].
17.5 Positron Emission Tomography
17.6 Right Ventricular Angiography
RV angiography was initially regarded as the imaging standard for ARVC diagnosis [51–53]. However, it is now regarded as an alternative modality when CMR is contraindicated and echocardiography is nondiagnostic. A variety of structural and morphological RV angiographic features are suggestive of ARVC [54–57]. Localized morphologic and contraction abnormalities of the RV free wall, such as bulges, akinetic areas, or the so-called “stack–of-plates” sign (hypertrophic trabeculae separated by deep fissures), are commonly found [55, 58]. Computed angiography may also provide objective measurements (RV volumes and EF), which are helpful in diagnosing ARVC [59, 60].
References
1.
2.
Wolf JE, Rose-Pittet L, Page E et al (1989) Detection of parietal lesions using magnetic resonance imaging in arrhythmogenic dysplasia of the right ventricle. Arch Mal Coeur Vaiss 82:1711–1717PubMed
3.
4.
5.
6.
Menghetti L, Basso C, Nava A et al (1996) Spin-echo nuclear magnetic resonance for tissue characterisation in arrhythmogenic right ventricular cardiomyopathy. Heart 76:467–470PubMedCrossRefPubMedCentral
7.
8.
9.
Bomma C, Rutberg J, Tandri H et al (2004) Misdiagnosis of arrhythmogenic right ventricular dysplasia/cardiomyopathy. J Cardiovasc Electrophysiol 15:300–306PubMed
 Dilated Cardiomyopathy: Usefulness of Imaging in Prognostic Stratification and Choice of Treatment
 Hypertrophic Cardiomyopathy: Clinical Assessment and Differential Diagnosis
 Arrhythmogenic Right Ventricular Cardiomyopathy: Clinical Assessment and Differential Diagnosis
 Advanced Echocardiographic Technologies in Dilated Cardiomyopathy
 Infiltrative/Storage Cardiomyopathies: Clinical Assessment and Imaging in Diagnosis and Patient Management
 Restrictive Cardiomyopathy: Clinical Assessment and Imaging in Diagnosis and Patient Management


Related posts:
Dilated Cardiomyopathy: Usefulness of Imaging in Prognostic Stratification and Choice of Treatment
Hypertrophic Cardiomyopathy: Clinical Assessment and Differential Diagnosis
Arrhythmogenic Right Ventricular Cardiomyopathy: Clinical Assessment and Differential Diagnosis
Advanced Echocardiographic Technologies in Dilated Cardiomyopathy
Infiltrative/Storage Cardiomyopathies: Clinical Assessment and Imaging in Diagnosis and Patient Management
Restrictive Cardiomyopathy: Clinical Assessment and Imaging in Diagnosis and Patient Management
Stay updated, free articles. Join our Telegram channel
Full access? Get Clinical Tree
