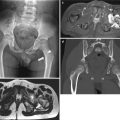
Fig. 32.1
Osteochondroma in the left scapula. (a) Axial CT image shows a protruding bone-forming mass arising from the left inferomedial scapula of which the medullary cavity is continuous with the mass. (b) 3D reconstruction image of the scapula clearly demonstrates mushroom-shaped osteochondroma arising from the scapula. (c, d) Axial STIR (c, short-tau inversion recovery) and T1-weighted (d) images show scapular osteochondroma with hyperintense cartilaginous cap (arrows in c)
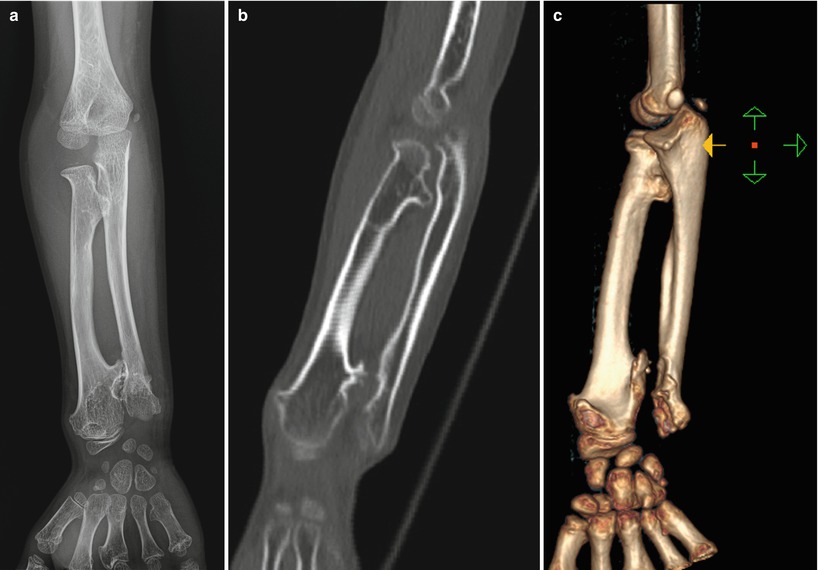
Fig. 32.2
Osteochondromatosis in an 8-year-old boy. (a–c) Forearm radiography (a), coronal CT image (b), and 3D reconstruction image (c) show multiple sessile osteochondromas involving the radius and ulna. The ulna is short and the radiocarpal joint is slanted, resulting in the so-called Madelung deformity
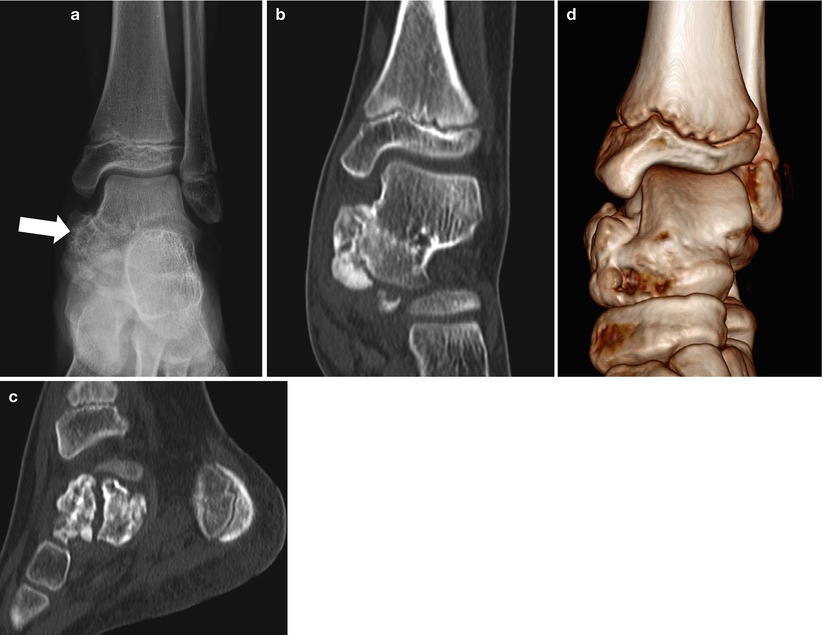
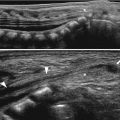
Fig. 32.3
Epiphyseal dysplasia hemimelica (Trevor’s disease) in a 9-year-old girl. (a) Left ankle AP radiograph shows a protruding bony lesion with bubbly appearance (arrow) in the medial aspect of the left talus. (b–d) Coronal (b) and sagittal (c) CT images show a lobulating contoured bony protuberance arising from the talus of which the cortex and medullary cavity are continuous with the mother bone. 3D reconstructed image (d) well visualizes a protruding bony mass in the medial talus
32.5.2 Enchondroma
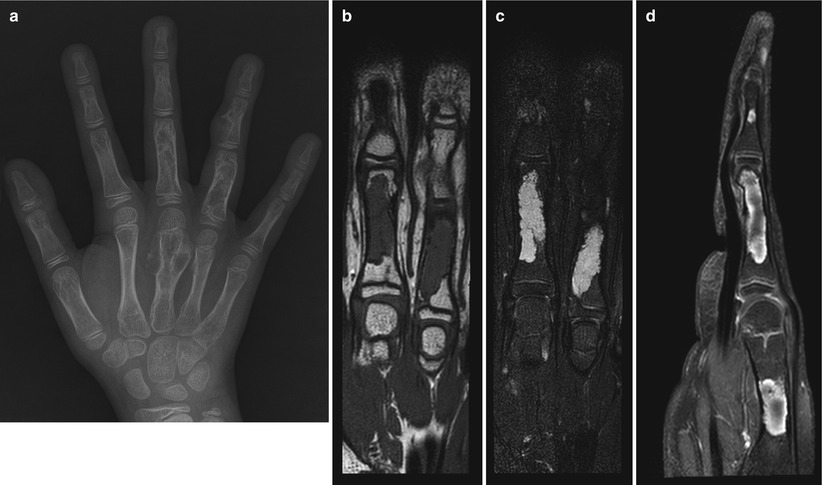
Fig. 32.4
Enchondromas in an 11-year-old boy. (a) Left-hand radiography shows relatively well-demarcated osteolytic lesions involving the short tubular bones of the hand with coarse trabeculations within the lesions. (b–d) MR T1-weighted coronal (b), STIR coronal (c), and postcontrast T1-weighted sagittal (d) images reveal well-demarcated and intensely enhancing bony lesions involving the phalangeal bones. Note dark signal intensity sclerotic rims around the lesions with narrow transition zones. Bright signal intensity on T2-weighted and STIR images is in keeping with the chondroid matrix
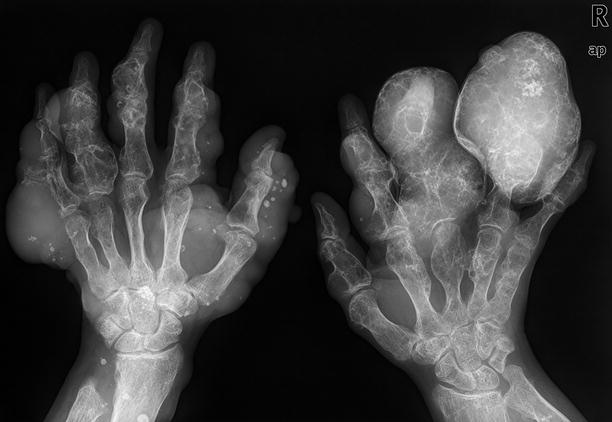
Fig. 32.5
Maffucci syndrome. Both hand AP radiographs show multiple bizarre osteolytic bony lesions involving metacarpals and phalangeal bones which are consistent with enchondromatosis. There are also multiple soft tissue masses with internal rounded calcifications representing phleboliths. Maffucci syndrome is consisting of enchondromatosis and hemangiomas or vascular malformations
32.5.3 Osteoid Osteoma
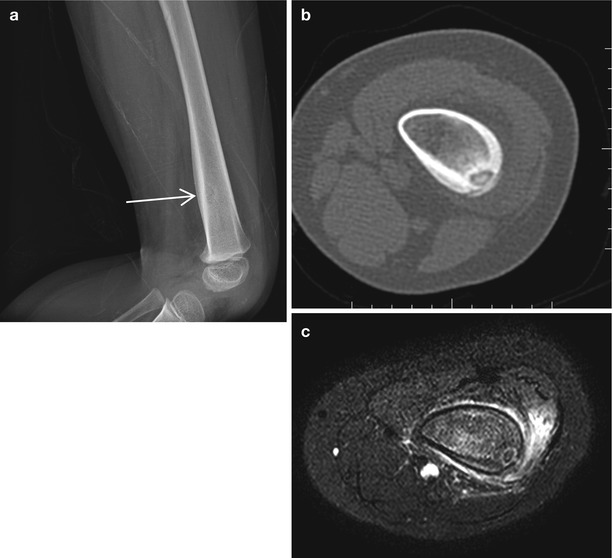
Fig. 32.6
Osteoid osteoma in a 3-year-old boy. (a) Small round osteolytic lesion is seen in the left distal femur metadiaphysis with adjacent cortical thickening (arrow). (b) CT shows a round radiolucent lesion with central dense spot representing calcified nidus. There is associated thick periosteal reaction and bone sclerosis. (c) Contrast-enhanced MR reveals enhancement along the periphery of the bony lesion with surrounding soft tissue enhancement
32.5.4 Chondroblastoma
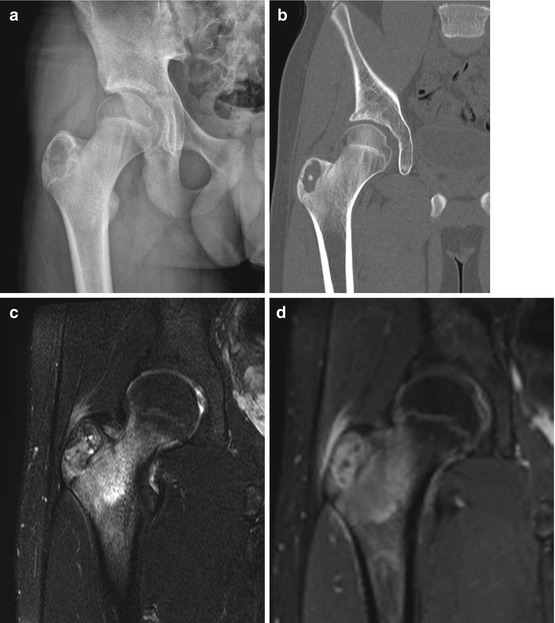
Fig. 32.7
Chondroblastoma in a 15-year-old boy. (a, b) Plain radiography (a) and CT (b) show a well-demarcated osteolytic lesion in the right femur greater trochanter. Note the lesion involving the apophysis (analog to the epiphysis) and there is no cortical bone disruption. (c, d) MR fat-suppressed T2-weighted image (c) and postcontrast T1-weighted (d) coronal images show hyperintense and well-enhancing lesion in the greater trochanter with dark signal foci within the mass representing calcifications. Hyperintense marrow edema is seen in the femoral neck
32.5.5 Giant Cell Tumor
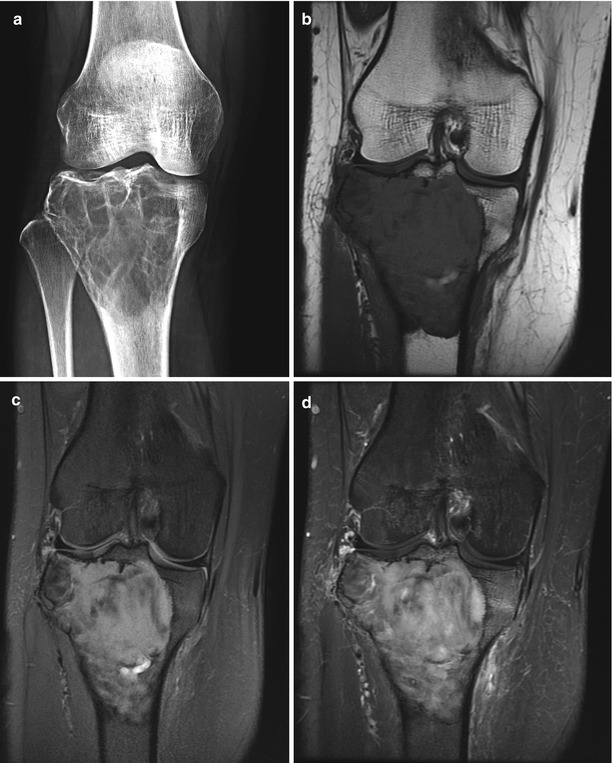
Fig. 32.8
Giant cell tumor in a 22-year-old female patient. (a) Right-knee AP radiograph shows a well-demarcated expansile osteolytic bony lesion with internal septa involving the proximal tibial epiphysis and metaphysis. The physes are completely closed in this patient. (b–d) MR T1-weighted (b) image reveals well-circumscribed hypointense bony lesion in the right proximal tibia with sclerotic rim and narrow transition. The lesion is of heterogeneous high signal intensity on fat-suppressed proton-density image (c) and is well enhanced after administration of gadolinium (d)
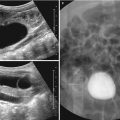
32.5.6 Simple Bone Cyst
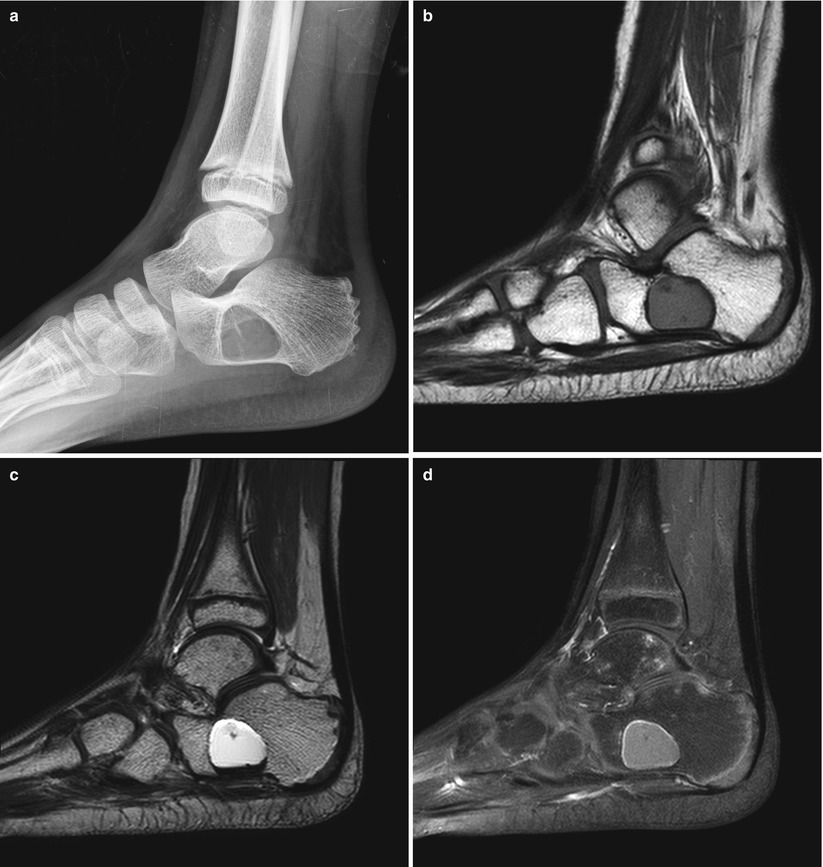
Fig. 32.9
Simple bone cyst of the calcaneus. (a) Lateral ankle radiograph shows a sharply marginated cystic lesion in the calcaneal neck portion which is surrounded by sclerotic rim. (b–d) MR T1-weighted image (b) reveals a well-demarcated hypointense bone cyst in the calcaneus without enhancement on fat-suppressed T1-weighted image (d). Note the bright high signal intensity representing cystic nature of the lesion on fast spin-echo T2-weighted image (c)
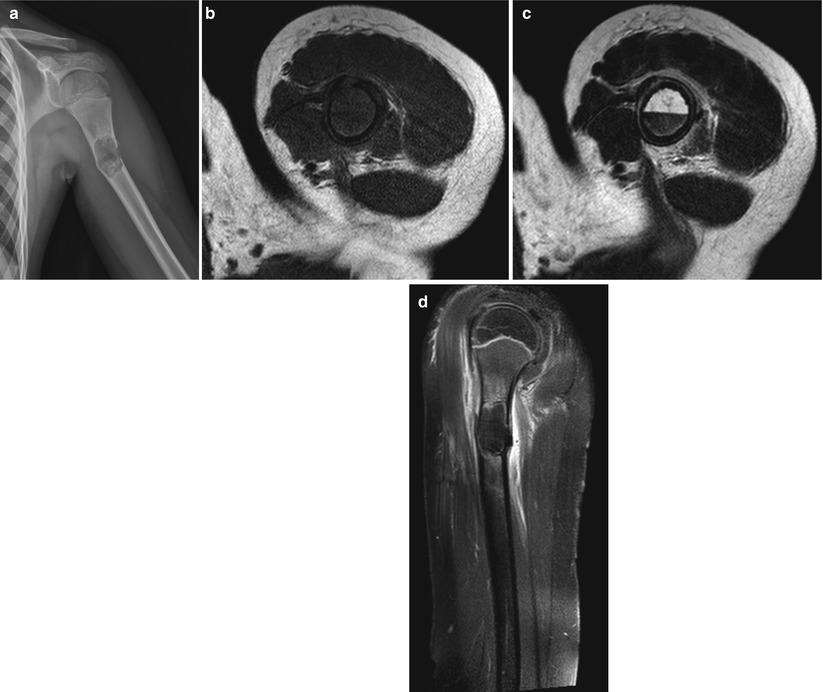
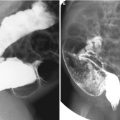
Fig. 32.10
Simple bone cyst with pathologic fracture. (a) There is a well-demarcated cystic lesion in the left humerus proximal diaphysis with cortical disruption and angulations representing associated pathologic fracture. (b–d) MR T1-weighted images before (b) and after (d) contrast administrations show a well-circumscribed intramedullary cystic lesion without solid-enhancing area. On T2-weighted axial image (c), there is a hemorrhage-fluid level which is due to an associated fracture. Periosteal new bone formation is noted with surrounding soft tissue enhancement suggesting reactive changes
32.5.7 Aneurysmal Bone Cyst
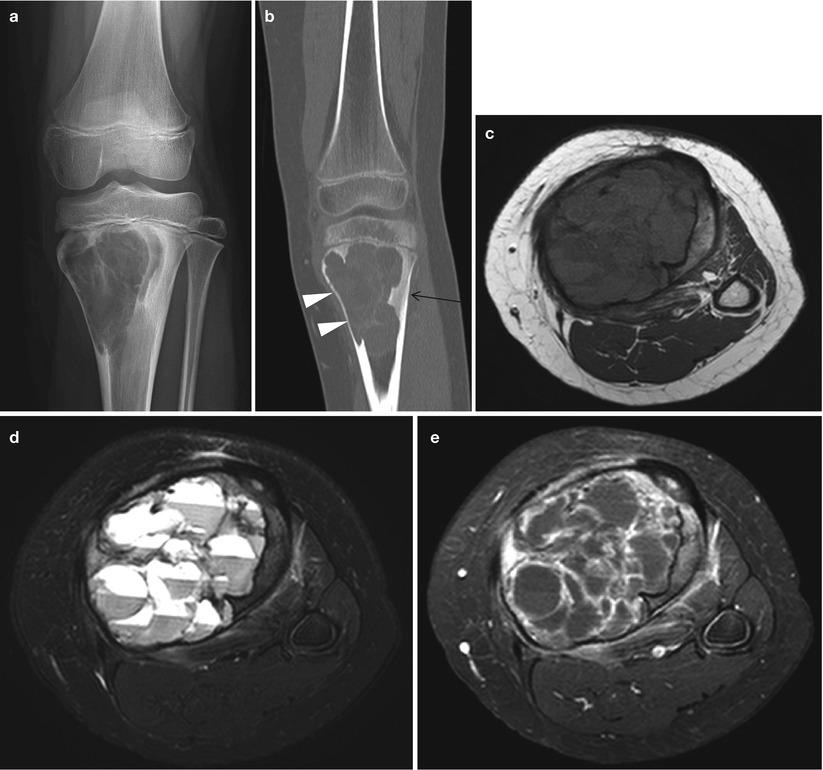
Fig. 32.11
Aneurysmal bone cyst in a 14-year-old girl. (a) Left-knee AP radiograph shows a well-demarcated cystic lesion with suspicious intervening septations in the left proximal tibia abutting the physis. (b) Coronal CT scan reveals intramedullary cystic lesion with lobulating contour and internal fine septations. Endosteal scalloping is clearly seen along the medial cortex (arrowheads) as seen on the plain radiograph. There is also associated sclerosis laterally (arrow). (c–e) T1-weighted (c) and T2 SPAIR (d) axial images show multiseptated cystic mass with hemorrhage levels, characteristic of the aneurysmal bone cyst. Contrast-enhanced axial image (e) depicts only septal and cyst wall enhancement
32.5.8 Non-ossifying Fibroma
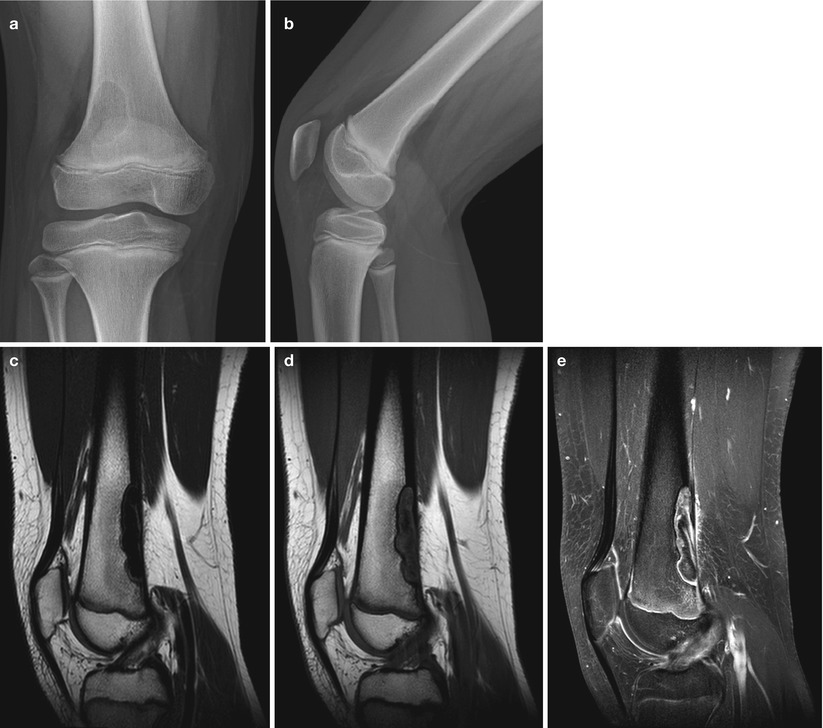
Fig. 32.12


Non-ossifying fibroma in a 12-year-old boy. (a, b) Right-knee AP (a) and lateral (b) radiographs show a well-circumscribed and elongated radiolucent bony lesion in the right distal femur which is eccentrically located at the posterior cortex. (c–e) The lesion appears hypointense on MR T2-weighted sagittal image (c) and isointense with hypointense center on T1-weighted image (d). Postcontrast fat-suppressed T1-weighted image (e) reveals heterogeneous and mostly peripheral enhancement of the lesion
Related posts:
Stay updated, free articles. Join our Telegram channel
Full access? Get Clinical Tree
