Fig. 16.1
Sequential scan, spiral scan, and multi-detector computed tomography. (a) The initial single-slice CT can scan only one slice by single rotation without table feed. (b) The helical CT can scan continuously by interpolation reconstruction, but the scan speed is not enough for an EKG-gated scan. (c) With single slice helical CT, when slice thickness decreased, the scan range will be very short. (d) The MDCT can make 4–640 image slices by helical or sequential and the scan speed is much faster than single-slice CT. EKG gating is now possible with MDCT
16.5.2 Concept of EKG-Gated CTs
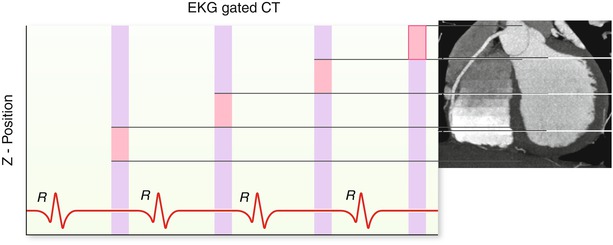
Fig. 16.2
Concept of retrospective EKG-gated CT. The heart is beating. To get the motion-free heart imaging, the imaging acquisition should be very fast; if the scan is not completed in one heartbeat, several image acquisitions in the same cardiac phase can make whole heart image data sets with a certain cardiac phase. In EKG-gated CT, the pitch is lower than 0.5, usually 0.2, and a certain cardiac phase is used for image reconstruction although image data are acquired throughout the cardiac cycle
16.5.3 Prospective Trigged EKG-Gated CTs
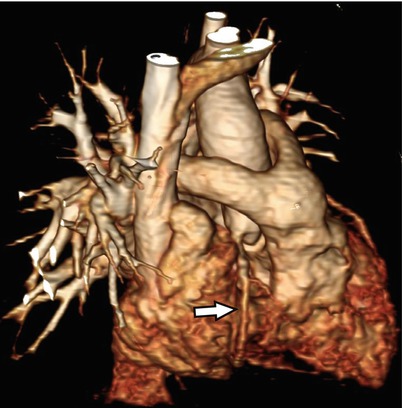
Fig. 16.3
Prospective trigged EKG-gated CT. EKG gated cardiac CT of 19-month-old 10 kg-weighted male patient with previous arterial switch operation can show the coronary arteries. The right coronary artery is nicely demonstrated (arrow). This is a prospective EKG triggering scan. Even though the iterative reconstruction is not used, the total radiation dose of this CT is 0.5 mSv
16.5.4 Voluntary Motion Artifacts in EKG-Gated CTs
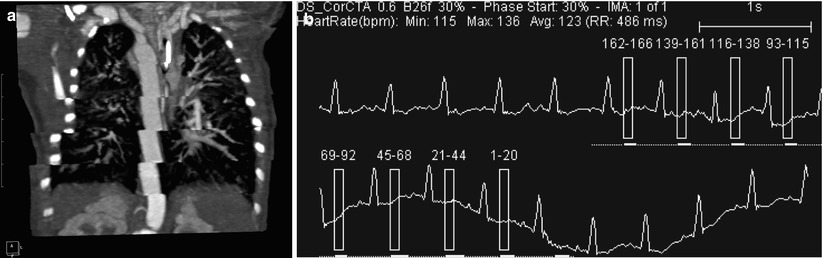
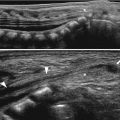
Fig. 16.4
The voluntary motion artifact in EKG-gated CT. (a) The patient was moving during the CT scan. In the EKG-gated scan, the data acquisition was done on each R-R interval and the voluntary motion resulted in the marked stair-step artifact. Note that the aorta and chest wall, as well as the pulmonary arteries’ continuity, are broken. (b) The EKG information of this CT scan showed the regular heart rhythm but the baseline of the EKG is fluctuated, suggesting voluntary motion of the patient. Each box means the data acquisition window of the R-R interval. There is a time gap for each data acquisition. The dot and solid line under the EKG strip mean the tube current modulation according to the EKG signal for reducing radiation dose by minimize radiation exposure during other phase except systolic phase which is target phase in this scan
16.5.5 Effect of Scan Speed on Motion Artifacts
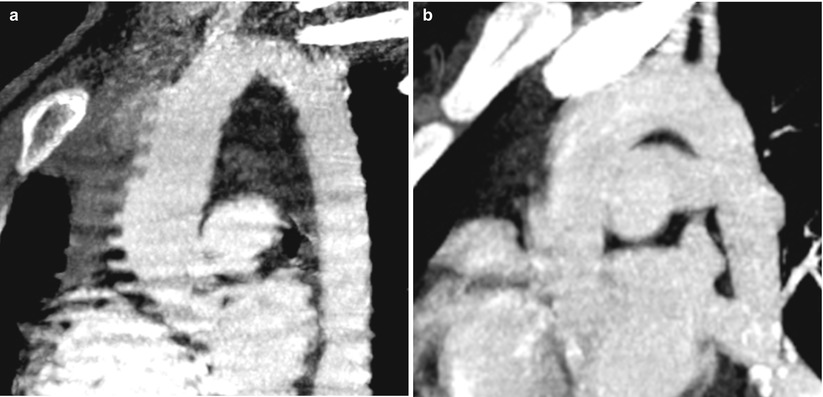
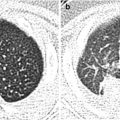
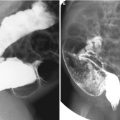
Fig. 16.5
Effect of scan speed on motion artifact. Both aorta scans are non-gated scans. Single-slice CT (a) scan shows more severe motion artifacts than that of a 16-channel MDCT scan (b). Cardiac motion artifact and respiratory motion artifact can be minimized by faster scanning
16.5.6 Cardiac Motion Artifacts in Non-gated Cardiac CTs
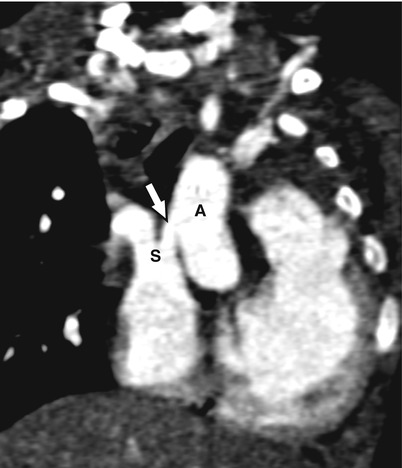
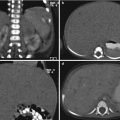
Fig. 16.6
Cardiac motion artifact in non-gated cardiac CT. The cardiac CT without gating is prone to motion artifacts. The aorta and superior vena cava seem connected, but this is a motion artifact from a heartbeat. However, the pulmonary arteries and pulmonary veins and aorta, except for the ascending aorta, can be imaged by a non-gated cardiac scan because the cardiac motions in those structures are not significant
16.5.7 Iodine K Edge Absorption and CT X-Ray Spectrum
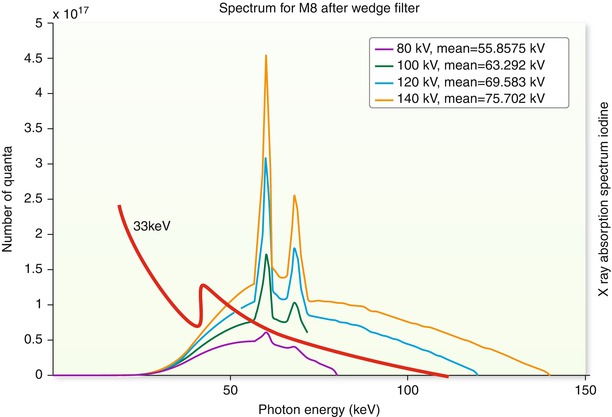
Fig. 16.7
Iodine K edge absorption and CT X-ray spectrum. Solid line indicates total X-ray absorption iodine and it has K edge absorption at 33 keV. The lower energy spectrum of 80 kVp or 100 kVp is much more affected by this K edge absorption. The lower kVp X-ray is absorbed by iodine atoms and the CT number of iodine is higher in the CT image that was taken by a lower kVp
16.5.8 Scan Range for Cardiac CTs
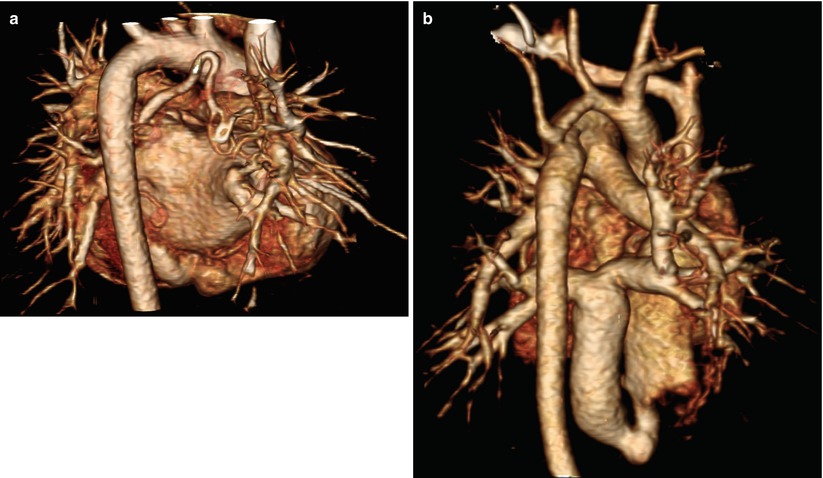
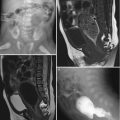
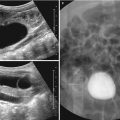
Fig. 16.8
Scan range for cardiac CT. Scan range is one of the most important parameters for radiation exposure. The scan range should be kept as short as possible. (a) The optimal scan range for the usual cardiac scan is from just above the aortic arch to just below the diaphragmatic surface. (b) This scan is intentionally done with extended scan range. The patient had a known arch anomaly and infracardiac type total anomalous pulmonary venous return. The scan range should cover the entire aortic arch and portal vein. The scan range should be determined by radiologists based on the target structure of the CT examination, case by case
16.5.9 Three-Dimensional Reconstruction
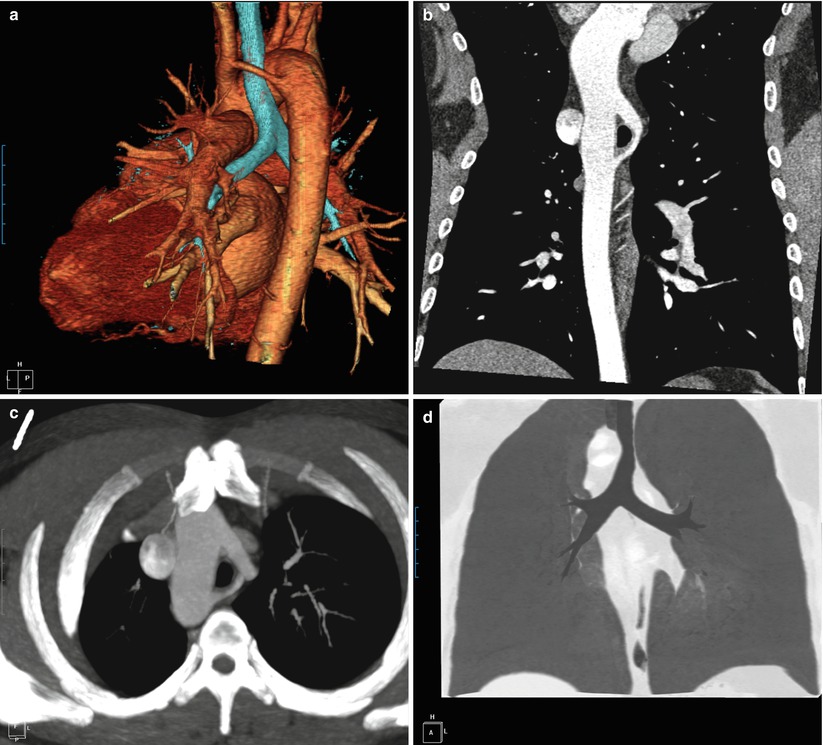
Fig. 16.9
Three-dimensional reconstruction. (a) Volume-rendering image. Volume-rendering image with color coding can demonstrate different structures with different HU at the same time. The airway is coded as sky blue and the contrast material is coded as brown. The airway and surrounding vascular structure is well demonstrated. (b) Curved multiplanar reformation. The single pixel thickness image can be generated along any arbitrary plane or even on the curved plane. This curve multiplanar reformation image is reconstructed along the central line of the aorta from the ascending aorta to the descending thoracic aorta. The double aortic arch is well demonstrated. Be careful of geometric information such as length from point to point in the image that can be distorted in curve multiplanar reformation image. (c) Maximum intensity projection. Maximum intensity projection showed the vascular ring in the axial plane. The vascular ring cannot be displayed in a single axial slice, but maximum intensity projection demonstrates the maximum pixel value in the volume and the vascular structure and bone usually have the maximum intensities in the volume. (d) Minimum-intensity projection. In contrast to the maximum-intensity projection, it displays the pixels with minimum intensities. The air is the material of the lowest CT number. The airway and lung is a good organ to be demonstrated by minimum intensity projection. The tracheal stenosis at the level of the vascular ring of this patient is well noted on this minimum-intensity projection image
16.5.10 Examples of Pulse Sequence Diagram
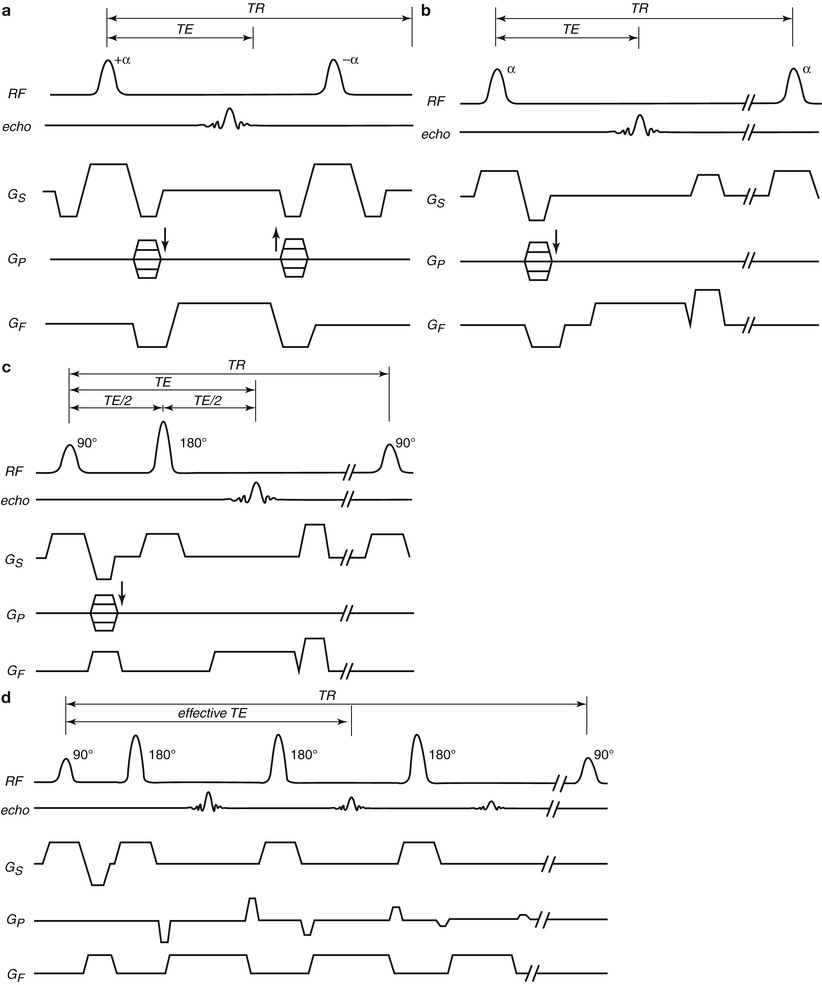
Fig. 16.10


Examples of pulse sequence diagram. Pulse diagram is the chart of the sequences of applying the RF pulse and gradient magnetic field: (a) steady-state free precession, (b) spoiled gradient echo, (c) spin echo, (d) turbo spin echo
Related posts:
Stay updated, free articles. Join our Telegram channel
Full access? Get Clinical Tree
