61 Perfusion Imaging
A watershed infarct between the middle and posterior cerebral artery territories is well visualized on fluid-attenuated inversion recovery (FLAIR) (Fig. 61.1A) and diffusion-weighted (Fig. 61.1B) images. The mean transit time (MTT) map (Fig. 61.1C) reveals an overall pixel intensity increase and thus increased transit time (slower arrival of the contrast agent bolus) within the area of the lesion, as well asto a lesser extent-the entire right cerebral hemisphere. The relative cerebral blood volume (rCBV) map (Fig. 61.1D), however, shows little difference in the overall volume of blood between the right and left hemispheres, with the exception of the infarct itself.
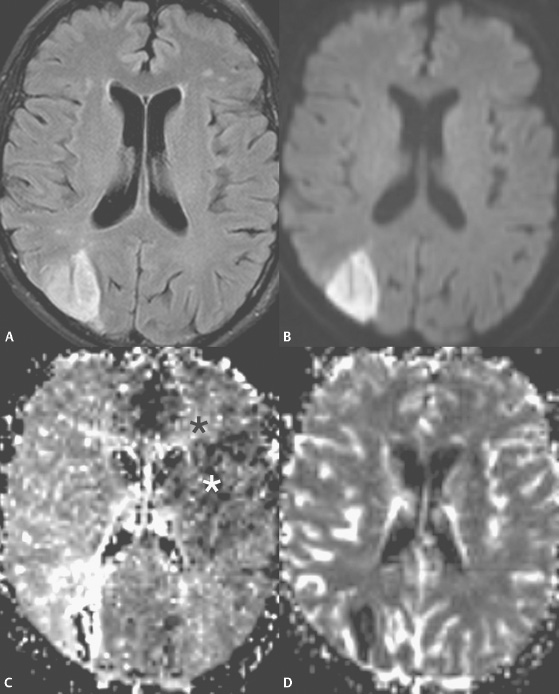
Fig. 61.1
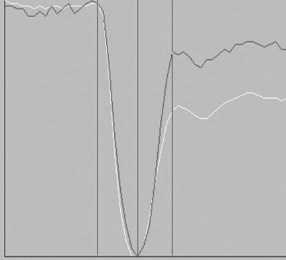
Fig. 61.2
Stay updated, free articles. Join our Telegram channel

Full access? Get Clinical Tree


