Studies
Diagnosis
Sensitivity (%)
Specificity (%)
Accuracy (%)
Jobst et al. (1992a) (n = 118)
DSM-IIIR
51
97
66
NINCDS-ADRDA
93
61
77
Possible AD
NINCDS-ADRDA
49
100
66
Probable AD
NINCDS-ADRDA
96
61
85
Possible and probable AD combined
Jagust et al. (2001) (n = 70)
NINCDS-ADRDA
59
87
71
Probable AD
Interestingly, using the DSM-IIIR criteria in the study by Jobst et al. resulted in the highest specificity, while the application of NINCDS-ADRDA criteria for possible AD yielded the highest sensitivity. Hence, in clinical practice a combined approach was advocated in which both criteria were applied in subsequent order, first aiming at sensitivity and subsequently at specificity.
However, Jobst et al. also pointed out the existence of different sets of neuropathological criteria, resulting in different sets of “gold standards” (Khachaturian 1985; Tierney et al. 1986; Mirra et al. 1991).
A more recent article in 2004 by Silverman et al. reviewed the validity of clinical diagnosis. They concluded physicians frequently failed in making the diagnosis of AD when the disease is present, mostly due to additional atypical symptoms. Also physicians often failed in diagnosing early AD, when its clinical symptoms were subtle or almost absent (Silverman 2004).
The same review states that in the recent report of the Quality Standards Subcommittee of the American Academy of Neurology, only three class I studies were identified in which the diagnostic value of clinical assessment could meaningfully be measured. Only one of them focused on evaluating dementia at a relatively early stage (Silverman 2004).
Moreover, the Silverman review stresses that in these studies the reported sensitivities and specificities do not represent the diagnostic accuracy of an initial clinical evaluation but the diagnostic accuracy of an entire series of evaluations repeated over a period of years (Silverman 2004).
Depending on the expertise of the referring physician, more clinical accuracy may thus be expected, especially in case of specialized memory clinics. On the other hand, diagnostic accuracy declines in cases of early and/or atypical symptoms. In these cases with so-called intermediate probability, further arguments to confirm or exclude the diagnosis may be sought in additional imaging investigations.
In the workup of dementia patients, initial anatomical imaging allows, on the one hand, to exclude treatable disease, such as brain tumours, on the other hand, allows volumetric assessment of hippocampus. Already in the study of Jobst et al., CT scans pointed towards diagnostic AD-related volume losses in hippocampus, entorhinal cortex and less often parahippocampus, with medial temporal-lobe atrophy at a rate ten times that observed in controls (Jobst et al. 1992b). These findings paved the way for imaging, not only to assess the presence of treatable disease, but also to substantiate whether or not a patient suffers from a dementia disorder.
14.4 Perfusion Pattern in AD
There is a close relationship between brain metabolism and perfusion, as local metabolism is the driving force behind local microperfusion. This principle holds in physiology and most pathological conditions, such as degenerative disorders. It is used in perfusion SPECT and thus enables the imaging of neurodegenerative disorders, which may cause a decrease in metabolism and thus a decrease in microperfusion (Roy and Sherrington 1890; Lou et al. 1987; Kuschinsky 1991).
The first single-photon emitter used for evaluation of regional cerebral blood flow (rCBF) was 133xenon (Lassen 1980). These early investigations showed a close coupling between rCBF and neuronal activity. A decrease in neural function due to Alzheimer’s disease resulted in a decrease in rCBF. Calculations were performed using a wash-in and wash-out method, relying on the fact that 133xenon is freely diffusible in brain tissue. Using planar imaging, the 133xenon method received clinical attention, but after the SPECT technique emerged, interest declined because of poor image quality as compared to its upcoming competitors.
Tracers with improved kinetics were needed, which resulted in the synthesis of three new compounds: IMP, HMPAO and ECD. IMP is dependent on amine-binding sites, HMPAO is trapped within the cell by interaction of the lipophilic complex with glutathione and ECD is retained by metabolic transformation into an acid product by specific enzymatic processes in brain tissue (Winchell et al. 1980; Ballinger et al. 1988; Walovitch et al. 1994; De Deyn et al. 1997). Because of differences in tracer kinetics, in several studies, different regional tracer distributions were reported (Koyama et al. 1997; Inoue et al. 2003).
All of these traces are intravenously injected; their biodistribution within the brain is proportional to the rCBF, whereafter they are trapped within the neurons. Studies have shown that this trapping is not affected in the majority of brain diseases, and thus a relatively low tracer uptake can be explained by a relatively low rCBF (Neirinckx et al. 1988). Imaging with ECD can be performed as early as 20 min after injection, but optimal image quality is obtained after 45 min. With HMPAO the minimal time interval is 40 min, with optimum imaging after 90 min (Juni et al. 1998).
In a landmark study in 1992, Holman provided a probability for a SPECT technical diagnosis of AD based on several distribution patterns. The highest probability of 82 % was given to a pattern of bitemporal and biparietal hypoperfusion, decreasing to 77 % for involvement of additional regions and 57 % for unilateral temporal and parietal hypoperfusion. Major false positives consisted of vascular dementia, Parkinson’s dementia and primary progressive aphasia. Moreover, solitary frontal lesions decreased probability further to 42 % and proved to be attributable to progressive supranuclear palsy or HIV. Unfortunately, these figures were not validated on neuropathologically confirmed cases (Holman et al. 1992).
While studies in the 1990s used a region-of-interest technique (ROI), later studies introduced voxel analysis. The methodological drawback of selection of ROIs is that it depends on a priori hypotheses and leaves large brain areas unexplored. Voxel analysis is data driven and thus avoids the pitfall of subjectivity. Using such analysis in a longitudinal study in 1999, Kogure et al. demonstrated involvement of the posterior cingulate cortex and precuneus in early AD, reflecting functional deafferentation from entorhinal cortex. Subsequently, in moderate and severe AD, absolute rCBF decreases were noted in temporoparietal and medial temporal-lobe cortices, which were further enhanced by atrophy (Kogure et al. 1999).
Finally, frontal-lobe involvement may occur, but if isolated, other causes should be suspected (Hoffman et al. 2000). In time, larger areas of the brain get involved, and in parallel, hypometabolism also becomes more severe. On the other hand, specific brain regions remain spared and show normal perfusion and metabolism. These include sensorimotor and visual cortices, basal ganglia, thalamus, cerebellum and brainstem (Fig. 14.1).
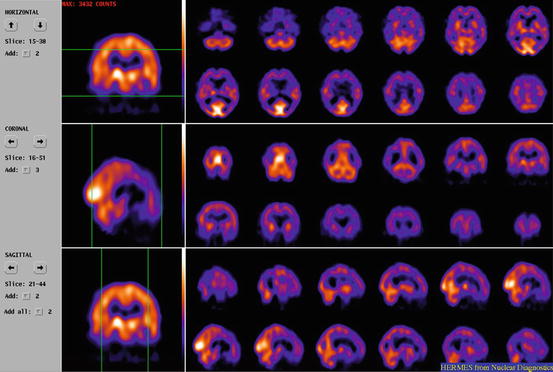

Fig. 14.1
ECD SPECT on a triple-headed gamma camera of a patient suffering from advanced AD, respective transaxial, coronal and sagittal slices. Extended hypoperfusion, especially of the posterior cortical regions, but sparing sensorimotor and visual cortices, basal ganglia, thalamus, cerebellum and brainstem
Asymmetry often reflects neuropsychological findings, for example, visuospatial changes being related to more right-sided hypometabolism. Bilateral parietal hypometabolism was reported to occur in more severe cases of AD, early-onset AD and in men (Clarke et al. 2011).
While accelerated atrophy occurs, it was shown that neocortical deficits (as observed in AD) reflect true metabolic reductions and are not just the result of atrophy (Ibáñez et al. 1998; de Santi et al. 2001).
Age-related hypoperfusion has been described and occurs more frontally as compared to temporal and parietal regions. Also small differences in perfusion patterns between men and women were suggested. Hence, age- and gender-stratified databases for different tracers were established, such as the Ghent-Optimized Adult High-Resolution ECD Absolute Quantification Databaseincluding 90 healthy volunteers (Slosman et al. 2001; van Laere et al. 2001; Silverman 2004).
It should be stressed, however, that distribution and hence use of such databases often remain limited to a few centres, mostly in the setting of research.
14.5 Accuracy of Perfusion SPECT for Alzheimer’s Disease
Functional imaging such as HMPAO-SPECT or FDG-PET is requested to increase the diagnostic accuracy, the so-called incremental value of a diagnostic test.
In the 1990s, perfusion SPECT became indicated for the diagnosis of AD. In the “consensus development for producing diagnostic procedure guidelines: SPECT brain perfusion imaging” published in 1994, Fletcher et al. reported on widely accepted and suggested indications of SPECT in neuropsychiatry. These indications were “dementia, cerebrovascular pathology, seizure disorders,” while accepted and suggested indications consisted of “brain tumours, infectious disorders, brain injury, movement disorders and psychiatry” (Fletcher et al. 1994).
The standard book on nuclear medicine at the time (Murray and Ell, first published in 1994) devoted already a chapter to SPECT and PET imaging in dementias, reflecting related interest and expectations. In 1996, the American Academy of Neurology assessed the role of brain SPECT to support the clinical diagnosis. The indication was rated as “established,” based on a class-II quality of evidence and strength of evidence type B (Altrocchi 1996).
In 1999, the Society of Nuclear Medicine released a procedure guideline for brain perfusion single-photon emission computed tomography (SPECT) using 99mTc radiopharmaceuticals. Evaluation of patients with suspected dementia was stated as a common indication (Juni et al. 1998).
An article by Catafau in 2001 aimed at providing fundamental knowledge on how and when to perform brain perfusion SPECT in clinical practice. Usefulness of perfusion SPECT in the differential diagnosis of dementia was explicitly mentioned as a good example (Catafau 2001).
The diagnostic value of perfusion SPECT in terms of specificity and sensitivity for the diagnosis of AD is presented in Table 14.2, which comprises three studies with validation against the gold standard of neuropathology.
Jobst and Jagust commented on the added value of SPECT as compared to clinical diagnosis. Jobst et al. concluded that combining HMPAO-SPECT and the temporal-lobe-oriented X-ray CT scans resulted in a false-positive rate <10 % instead of 25 % for a clinical diagnosis (Jobst et al. 1992a).
In a similar study published later in 2001, Jagust et al. demonstrated that a positive SPECT increases the likelihood of clinical diagnosis of AD from 84 to 92 %, while a negative SPECT decreases the likelihood to 70 % (Jagust et al. 2001).
However, it must be stated that, for obvious reasons, these neuropathological studies did not investigate specifically the role of SPECT in early diagnosis. Often subgroup analysis in the aforementioned populations of AD was used to advocate perfusion SPECT in early AD, although clear figures on larger series for this indication are not available.
Using the Web of Science and PubMed for the period between 1988 and 2012, a limited number of references are found applying a search for “early and AD and sensitivity and SPECT.” Some articles published before 2004 give a positive indication, albeit cautiously (Prohovnik et al. 1988; Perani et al. 1988; Kogure et al. 1999).
Interestingly, in 1996, the American Academy of Neurology already stated that SPECT is an established technique for supporting the clinical diagnosis of AD. A relevant point in this regard was that perfusion changes may precede (or follow) neuropsychological changes.
Hence, in clinical practice it was not uncommon for patients to be referred for diagnosis of early AD. Indication for perfusion SPECT in this subgroup was then based on limited studies and a broad interpretation of the guidelines.
Finally, the accuracy of a diagnostic test is also largely related to the expertise of the interpreting physician. In an early publication, the interobserver agreement for HMPAO brain SPECT uptake patterns in 50 clinically diagnosed demented subjects (presumed AD, AD, vascular dementia) from four institutions was studied. The authors found significant reader agreement and a consensus sensitivity of 72 % and specificity of 79 % for identifying abnormalities in scans of demented subjects. In their final conclusion, they stated that interpretation of regional cerebral blood flow/SPECT images is concordant across multiple institutions and readers (Hellman et al. 1994).
14.6 SPECT in the Differential Diagnosis of Alzheimer’s Disease
Another major clinical question was the contribution of SPECT to the clinical differential diagnosis. In a review in 2004 by Dougall et al., articles published between 1985 and 2002 were retrieved systematically from MEDLINE and EMBASE, cross-referencing with personal collections and 13 narrative reviews. Of 301 studies identified, 48 survived exclusion criteria and contained extractable data. Pathological verification studies suggest that clinical criteria may be more sensitive in detecting AD than brain SPECT (81 % versus 74 %). However, SPECT studies provide a higher specificity against other types of dementia than clinical criteria (91 % versus 70 %). Dougall et al. therefore concluded SPECT may be helpful in the differential diagnosis of AD (Dougall et al. 2004).
Pooling data in an exploratory manner from both the Bonte and Jagust studies gives a weighted sensitivity for brain SPECT against neuropathology of 74 % and a weighted specificity of 91 %.
Stay updated, free articles. Join our Telegram channel

Full access? Get Clinical Tree


