Pericardial disease is an important cause of morbidity and mortality. In general, diseases that affect the pericardium tend to affect it diffusely. Focal disease may be related to masses, cysts, or calcification. Imaging plays a key role in establishing a diagnosis of pericardial disease because the clinical manifestations of pericardial disease can be complex and range from incidental to life-threatening. As such, a working knowledge of pericardial anatomy and common pericardial diseases is essential for the cardiac imager to aid in proper diagnosis and potentially to guide treatment.
Anatomy and Physiology
The pericardium protects the heart, reduces friction between the heart and surrounding structures, supports atrial filling with negative systolic pericardial pressure, and limits acute cardiac distention. The pericardium is composed of two layers, the fibrous and the serous pericardium. The serous pericardium consists of the visceral and the parietal layers. The visceral pericardial layer covers the myocardium, epicardial fat, and epicardial vessels and is also referred to as the epicardium. It is continuous with the parietal pericardial layer at the pericardial recesses.
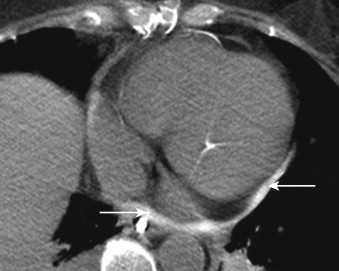
The space between the visceral and parietal pericardial layers is the pericardial space, which normally contains a small amount (15 to 50 mL) of pericardial fluid. The parietal serous pericardium is intimately adhered to the fibrous pericardium and cannot be separated from it. This portion of the pericardium is commonly referred to as the pericardium, as opposed to the epicardium. The epicardium and pericardium are normally inseparable to the eye on imaging, but in certain disease states, such as pericardial effusion, they become separated and visible ( Fig. 33-1 ).
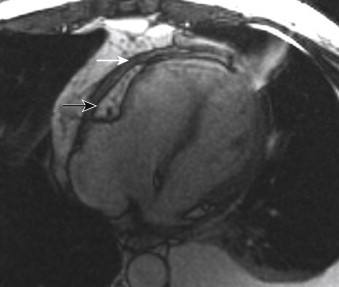
One useful way to recall the fat layers that surround the pericardium is that the peri cardial fat is around the peri meter of the pericardial membrane. Thus, it surrounds the pericardium (see Fig. 33-1 ). The epicardial fat is deep to the epicardium and is immediately adjacent to the myocardium.
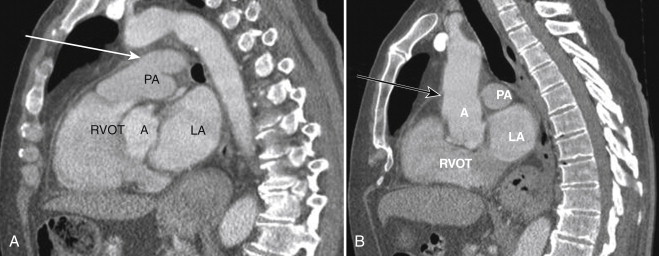
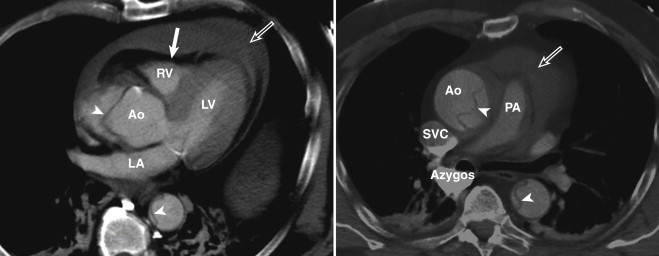
In the craniocaudal direction, the pericardium extends all the way up to the proximal aortic arch and the pulmonary artery. This feature is, again, usually not evident, but when effusion or thickening is present, this becomes more apparent ( Fig. 33-2 ).
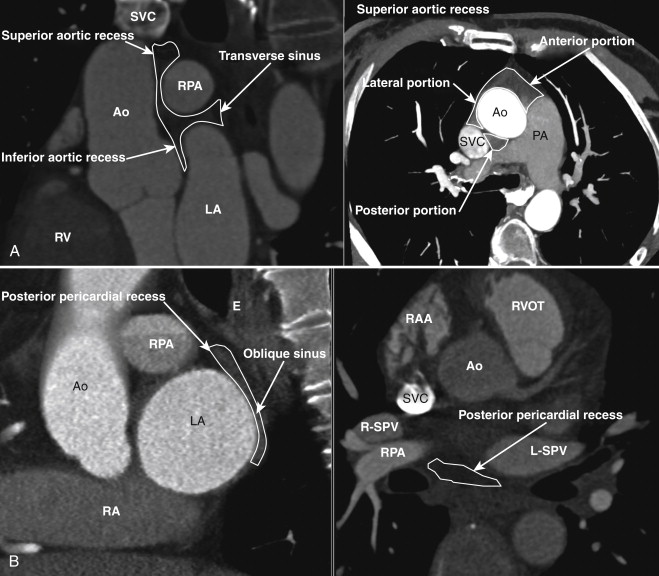
Reflections of the serous pericardium around the great vessels and the base of the heart are termed pericardial sinuses. The two main pericardial sinuses are the transverse and oblique sinuses ( Fig. 33-3 ). The pericardial recesses arising from the transverse sinus are the superior aortic recess, inferior aortic recess, right pulmonic recess, and left pulmonic recesses. The recess originating from the oblique sinus is the posterior pericardial recess (see Fig. 33-3 ). The recesses originating from the pericardium proper are the pulmonic vein and the postcaval recesses.
Pitfall
Fluid accumulation in these recesses can be confused with lymphadenopathy.
Pathology
Pericardial Effusion
Pericardial effusion is defined as an excessive accumulation of pericardial fluid. Normally, only a small amount of fluid is present between the visceral and parietal layers. This fluid serves to minimize friction between the two layers from cardiac motion. However, some disease states (heart or renal failure; infection, particularly viral infection or tuberculosis;, trauma; myocardial infarction; autoimmune disorders; malignant disease; and other systemic diseases) can lead to abnormal fluid pooling within the pericardial space.
Pericardial effusion can be a purely incidental finding in an asymptomatic patient. In a patient with symptoms, or in a patient with clinically suspected pericardial effusion, echocardiography is the first-line imaging that is performed. This technique can help delineate the size of the effusion and measure any hemodynamic consequences.
The fluid that accumulates can be simple, hemorrhagic, or infected. As such, it may be transudative, hemorrhagic, or exudative, respectively.
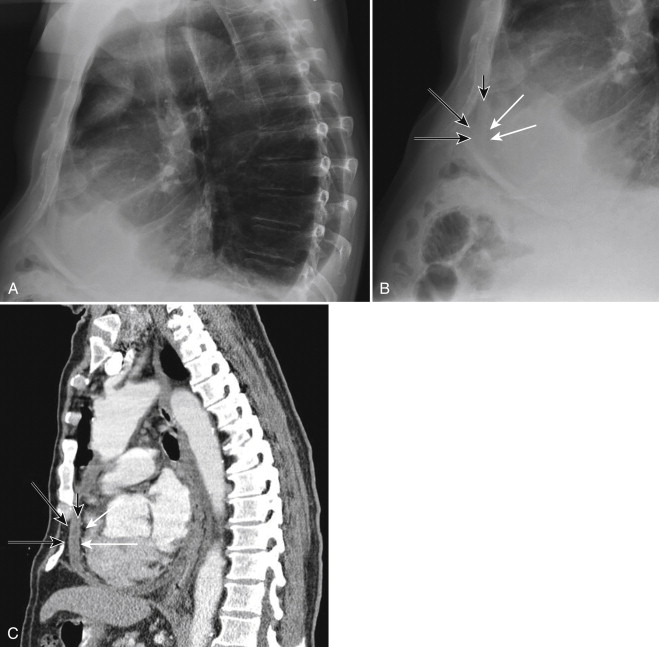
On conventional radiographs, the finding is classically described as a “water bottle” heart on the frontal view. On a properly performed lateral view, the classic “Oreo cookie sign” can be seen. The alternating dark-light-dark appearance of the pericardial fat–effusion fluid–epicardial fat resembles an Oreo cookie when it is viewed in profile ( Fig. 33-4 ).
On magnetic resonance imaging (MRI), the presence of pericardial effusion separates the two pericardial layers. The resulting appearance consists of two thin, dark lines separated by high signal fluid on T2-weighted spin echo or gradient recalled echo cine sequences. On echocardiography, pericardial effusion is seen as an echolucent space surrounding the heart. Swinging motion of the heart on multiphase imaging can be seen with massive pericardial effusion.
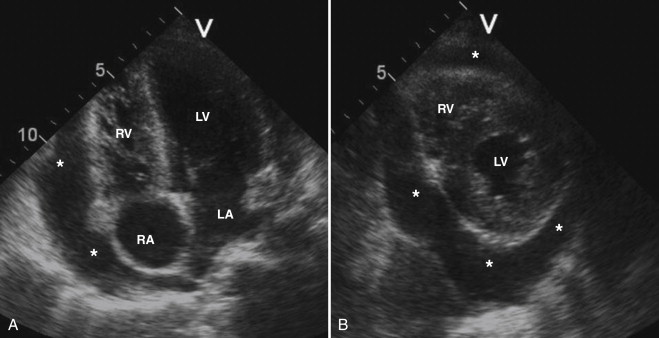
On echocardiography, pericardial fluid appears as a low-echo or anechoic space adjacent to the cardiac structures ( Fig. 33-5 ). Pericardial fluid can be confused with pericardial fat and left-sided pleural effusion. The presence of fibrin strands, in the setting of an infectious inflammatory origin, can help differentiate pericardial fluid from pericardial fat. The circumferential involvement surrounding the heart and the separation between the descending aorta and the left atrium are most suggestive of pericardial effusion, rather than left-sided pleural effusion. Effusion size is assessed by measuring the distance between the two layers of the pericardium. A separation of less than 0.5 cm corresponds to a small effusion, a separation of 0.5 to 2.0 cm is moderate, and a separation greater than 2.0 cm is considered large.
Problem Solving: Deciphering Pericardial Thickening Versus Effusion
The maximum normal pericardial thickness is 2 mm on computed tomography (CT) images and 2.5 on echocardiography. Normal pericardium demonstrates low signal on T1- and T2-weighted spin echo and gradient recalled echo cine sequences, whereas pericardial effusion demonstrates high signal on fluid-sensitive sequences. On echocardiographic images, the pericardium is seen as a thin, echogenic, linear structure, and accumulated pericardial fluid is anechoic or hypoechoic.
On nongated chest CT, the pericardium appears as a thin membrane within the fat surrounding the heart. It is most easily detected anteriorly along the right ventricle (RV) free wall, and it can be followed peripherally around the cardiac chambers ( Fig. 33-6 ). In physiologically normal individuals, the pericardium frequently cannot be clearly traced all the way around, perhaps because of a combination of cardiac motion and volume averaging. (Defects in the pericardial membrane can also cause it to not be seen, and these defects are discussed later.) Pericardial fluid, conversely, tends to layer posteriorly and inferiorly in the dependent portions of the pericardial space and in the anterior angle at the junction of inferior and anterior free walls of the RV.
The normal pericardium is not seen on conventional radiographs.
A special note should be made about hemopericardium. This condition can be seen in the setting of trauma, in cardiac malignant disease, after cardiac or aortic surgery, with improper line placement, or as a complication of type A aortic dissection. On conventional radiographs, rapid change in the cardiac silhouette size, especially in the setting of falling hematocrit levels or known aortic dissection, should alert the physician to possible hemopericardium. Placing the Hounsfield unit (HU) cursor on any pericardial effusion should become automatic as part of the search pattern. Characteristically, a density of 30 to 70 HU is indicative of blood ( Fig. 33-7 ). Type A aortic dissection should be excluded in any patient with hemopericardium. Conversely, any patient with type A dissection or intramural hematoma in the ascending aorta warrants a comment about the presence or absence of hemopericardium.
The volume of pericardial fluid is not all that should be reported. Comparison with prior examinations (especially recent ones) should involve an assessment of how rapidly the effusion has formed. Rapid accumulation of fluid or a large amount of fluid may lead to increased pressure within the pericardial space. Chamber filling and subsequently cardiac output can be impaired, and this condition can be life-threatening.
Cardiac Tamponade
Cardiac tamponade occurs when increased intrapericardial pressure, from accumulation of pericardial fluid, compromises both the systemic venous return and the effective cardiac output. The amount of volume necessary to cause pericardial tamponade depends on the velocity of fluid accumulation. Entities that result in rapid accumulation of fluid, such as ruptured aortic dissection (see Fig. 33-7 ), require a smaller amount of volume to cause cardiac tamponade. Conversely, chronic fluid accumulation, such as in patients with systemic lupus erythematosus, requires larger volumes to result in cardiac tamponade.
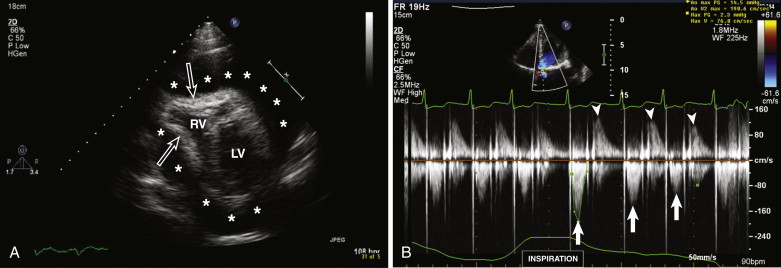
Two-dimensional echocardiography features of pericardial tamponade include pericardial effusion with early diastolic RV invagination, late diastolic right atrial invagination, and lack of inferior vena cava (IVC) collapse during deep inspiration resulting from increased intrapericardial pressure to more than the intracardiac pressures (see Fig. 33-5 ; Fig. 33-8 ). The main tool in the diagnosis of cardiac tamponade is Doppler echocardiography. Distinctive features include inspiratory decrease in mitral inflow and expiratory decrease in tricuspid inflow (noticed during pulsed wave interrogation). The changes in mitral inflow are analogous to pulsus paradoxus (blood pressure drop >10 mm Hg during inspiration).

