PET and PET-CT in Radiation Treatment Planning
Steven M. Larson
Kenneth Rosenzweig
Heiko Schöder
John Humm
Normal tissue tolerance in the region of irradiated tumor has been the major limitation in the clinical application of radiotherapy to oncology. Innovations in radiation therapy offer the potential for improving the tumor/normal tissue therapeutic index by tightly controlled delivery of radiation to tissues deep in the body. Techniques such as 3-D conformal therapy and intensity-modulated radiotherapy (IMRT) are capable of therapeutic radiation distributions, which are reproducible to within a few millimeters in three dimensions (see Fig. 57.1). The success of these technical innovations in radiotherapy will depend on improved diagnostic imaging, which can be integrated into radiation treatment planning so that radiation delivery is optimally adapted to the location and extent of tumor within the individual patient. Also, to achieve an optimal tumor response, imaging methods are needed that show not only the anatomic extent, but also biologic features of the tumor, such as hypoxia, which are important to radiation effects on tissue. Furthermore, in the living patient the tumor sites are not stationary, but have the potential to move during treatment based on pulsatile blood flow or respiratory motion. High-resolution computed tomography (CT) has been the mainstay of treatment planning for three-dimensional radiotherapy techniques. Integration of high-resolution positron emission tomography (PET) in the form of PET-CT into radiation oncology treatment planning is rapidly occurring throughout the world because of the promise of PET-CT to add major benefits for improved individualized treatment planning. Positron emission tomography (PET) is capable of imaging a wide variety of biochemical and biologic features of tumor which are known to influence radiation response and the potential for cure (see Fig. 57.1). Specific areas of application include (a) improved monitoring of radiation treatment response, (b) improving radiation treatment planning by optimizing radiation treatment volume, (c) controlling for tumor motion during treatment by respiratory gating, and (d) “biologic” imaging, that is, predicting radiation resistance in terms of tumor hypoxia.
Radiation Treatment Planning
External beam radiation treatment (EBRT) is delivered most commonly using a linear accelerator system to focus high-energy x-rays on the region of the patient tumor. In most cases, a computed tomography (CT) scan is obtained of the patient’s tumor during the time when a patient is in a device called a treatment simulator. The radiation therapist defines the region of the tumor in relationship to the CT scan, and also identifies normal tissues in the region, which are to be avoided. With the aid of dosimetrists and medical physicists, a radiation treatment plan is implemented, which involves a fraction of repeated doses of radiation to achieve an amount of radiation in the tumor and surrounding normal tissues that can be tolerated by the patient.
Three-dimensional conformal radiation therapy (3D-CRT) represents an approach to improve the local outcome of radiotherapy. The major aim of this method is to decrease the risk of underdosing or missing portions of the tumor. In addition, because of the improved ability to conform the high radiation dose to the target, considerable amounts of normal tissue (such as lung, esophagus, and heart) can be effectively excluded from the high-radiation dose regions. This provides a potential for increasing the tumor dose to levels beyond those feasible with conventional radiotherapy, with a concomitant decrease in the normal tissue complication probability (NTCP).
3D-CRT is accomplished using CT to aid in treatment planning. A clinical tumor volume (CTV) is defined in the axial plane of the CT images. A margin is subsequently added to the CTV to generate the planning target volume (PTV). This margin compensates for tumor motion during treatment caused by breathing, patient movement, and setup error. The treatment beams are subsequently constructed using the beam’s-eye view technique. The optimal radiation beam parameters and orientation are selected by objectively comparing candidate plans using calculations and visual displays. This technique has been used in multiple clinical trials with good efficacy (1,2). Intensity-modulated radiation therapy (IMRT) is a more advanced treatment planning technique than 3D-CRT. It allows escalation to a higher dose of radiation than 3D-CRT. However, there has not been extensive clinical experience in the use of IMRT. Figure 57.1A shows an example of a five-field IMRT prostate plan with the intensity profiles
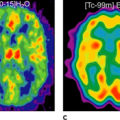
shown for each field to reach the desired isodose distribution. Magnetic Resonance Spectroscopic Imaging (Fig. 57.1B,C) has already been used for the first biologically based radiotherapy plans, and PET tracers have the potential of being used for this same purpose (Fig. 57.1D).
shown for each field to reach the desired isodose distribution. Magnetic Resonance Spectroscopic Imaging (Fig. 57.1B,C) has already been used for the first biologically based radiotherapy plans, and PET tracers have the potential of being used for this same purpose (Fig. 57.1D).
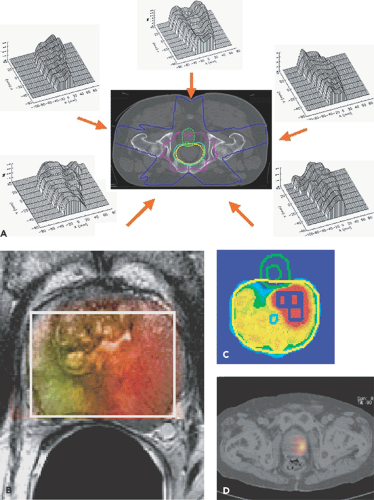 Figure 57.1 A: Intensity-modulation radiation profiles used in prostate treatment plan showing isodose lines and the level of conformity of the high-dose region to the prostate. B,C: Magnetic Resonance Spectrosopy images with pseudo color display corresponding to the regions within the prostate of elevated choline to citrate ratio, a putative indicator of malignancy. Images such as these are being used for biologically based IMRT planning of prostate carcinoma. D: PET study showing FDG uptake in a patient with prostate cancer. PET images such as these, once proven to reflect foci of higher density tumor cells, could be used as the basis of dose painting. PET tracers other than FDG (e.g., labeled acetate or choline) may be more beneficial in primary prostate cancer, whereas FDG appears promising to identify the viable tumor volume in tumors such as lung, esophageal, or head and neck cancer. |
Extracranial stereotactic radiosurgery (SRS) is currently being investigated in a number of treatment sites as a potential technique to increase dose to the tumor while limiting the normal tissue around the tumor to low doses of radiation. This can allow for fraction sizes as high as 20 Gy. There have been reports of excellent local control with this technique (3).
Investigators have recently developed a technique known as image-guided radiation therapy (IGRT), which uses imaging while the patient is in the treatment position to verify the accuracy of the treatment. This technique will be especially helpful when high dose per fraction treatments, such as extracranial SRS, are used.
Helical tomotherapy (HT) is an innovative means of delivering IMRT using a device that merges features of a linear accelerator and a helical computed tomography (CT) scanner. The HT unit can generate CT images from the megavoltage radiation it uses for treatment as often as needed during a course of radiation therapy. These megavoltage CT (MVCT) images offer verification of patient position prior to and potentially during radiation therapy (4). Similar technology exists using standard linear accelerators to create MVCTs, as well as using conventional CT imaging via a kilovoltage unit attached to a treatment machine to image patients. In principle these devices could be used to deliver radiation not only to primary tumors but to metastatic tumors deep within the body. Biologic imaging using integrated positron emission tomography (PET) and CT offers the potential to fuse CT images used to define the clinical, gross, and planned target volume in relation to dose-limiting normal tissues with images that may show functional properties of the tumor for refining dose intensification within individual regions.
FDG-PET Studies in Planning and Response Assessment in Radiotherapy
Ninety-nine percent of all PET studies today are performed using the radiotracer fluorodeoxyglucose (FDG). This is because of the almost ubiquitous uptake of FDG in all viable cancer cells. FDG-PET imaging appears to have gained a level of general acceptance as having an important role in radiotherapy for staging, treatment planning, treatment monitoring, and detecting recurrence (5). This property has led to its exploratory use for assisting CT in the delineation of radiotherapy margins (6), for the differentiation of viable versus necrotic tissue (7), as well as for potential prognostication of radiotherapy treatment response.
FDG-PET-CT to Improve Treatment Planning in Lung Cancer
Surgery remains the primary treatment option for lung cancers that have not metastasized. However, for tumors that are inoperable, either owing to extensive disease or because the patient cannot undergo a surgical procedure, radiation therapy, alone or in conjunction with chemotherapy, is the standard of care. In recent years, evidence has suggested that higher doses of radiation will improve local control of advanced lung cancers (2). Several new radiation techniques have aided in delivering the highest possible radiation dose targeted precisely to the tumor while sparing surrounding healthy tissues and organs.
PET (positron emission tomography) scanning with the tracer FDG (18F-2-fluoro-2-deoxy-d-glucose) can be used to augment CT imaging in tumor definition for radiation therapy treatment planning. The extent of many lung tumors is not fully visible on CT scans, and inadequate delineation of the Gross Tumor Volume limits the success of RT. FDG-PET imaging in addition to CT has a higher sensitivity, specificity, and accuracy than CT alone. In a prospective treatment planning study, Erdi et al. (6) combined PET images with CT data for 11 non–small cell lung cancer (NSCLC) patients and reported PTV increases for 7 patients, with an average volume increase of 19%. For the other four patients, PTVs decreased by an average of 18%. Figure 57.2 shows a planning target volume (PTV) that incorporated PET images. Whatever the merits of these and other response findings, perhaps there is clearer evidence when FDG-PET demonstrates patterns of failure post–radical radiotherapy/chemoradiotherapy as in the study by MacManus et al. (8) for non-small cell lung cancer.
Optimizing the Use of FDG-PET in EBRT Response Assessment
In a special circumstance, multiple images can be obtained using PET-FDG during the entire course of the patient’s external beam radiation therapy (Fig. 57.3). An 81-year-old woman was irradiated as primary treatment for her lung cancer. The patient’s radiation treatment consisted of an initial phase of parallel opposed anterior-posterior (AP-PA) fields to 3,420 cGy followed by a cone-down (the treatment field is reduced to provide a boost to a portion of a target volume), consisting of opposed right anterior oblique (RAO) and left posterior oblique (LPO) fields. The AP-PA beams encompassed the entire lesion. However, only the inferior section of the lesion was irradiated by the primary beams of the cone-down plan. The patient received a total of 6,480 cGy to the prescription point in 180-cGy daily fractions using the 6-MV beam of a Varian 2100C (Varian Medical Systems Inc., Palo Alto, Calif.) linear accelerator. A baseline FDG-PET scan was performed 2 weeks prior to EBRT, and treatment response was monitored by imaging on five occasions after completion of each 900-cGy increment of treatment. A follow-up scan
was obtained at 3 weeks after the last treatment was delivered. Several important features of treatment response measurement are illustrated by the patient example shown. A kind of natural history of treatment response in a responding patient is shown (6).
was obtained at 3 weeks after the last treatment was delivered. Several important features of treatment response measurement are illustrated by the patient example shown. A kind of natural history of treatment response in a responding patient is shown (6).
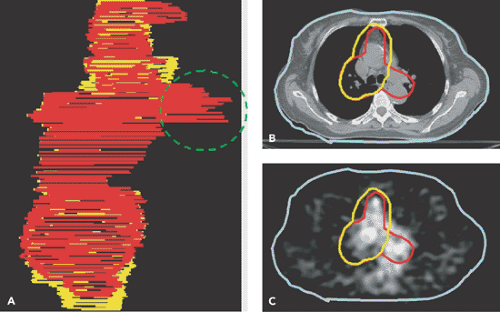 Figure 57.2 A: Wire diagrams of the planned target volume (PTV) delineated from the CT (yellow) and from the CT-PET (red) for a patient with lung cancer. Involved paratracheal lymph nodes were detected on the PET scan (C), but not on the CT (B). The PTV was modified to incorporate the PET data. (From Ref. 6, Erdi et al. 2002). |
Timing and Duration of Metabolic Response
Note that reduction in metabolism occurs relatively early in the course of treatment, so that by the time 1,800 cGy of radiation have been delivered, the metabolic rate for glucose has decreased by one third. This is 10 days into the treatment cycle. Also, the treatment response is progressive, proceeding to less than 10% of the initial activity by the end of treatment. In addition, there appears to be a window of opportunity for assessing the tumor, without major impact by surrounding inflammatory change in the normal lung.
Importance of Timing of PET-FDG Imaging with Respect to EBRT
However, within a few weeks of treatment, assessment of the tumor response becomes difficult owing to a major inflammatory response in normal tissue. If tumor response assessment were attempted for the image labeled “posttreatment” in Figure 57.3B, the assessment would be confounded by FDG uptake in the normal tissues.
Use of Both Qualitative and Quantitative Changes for Tumor Assessment
In particular, the most valuable quantitative parameters are SUVmax and total lesion glycolysis (TLG) (9).
FDG Uptake in Normal Tissues
FDG uptake in normal tissues may offer an index to the timing and severity of acute radiation damage. For example, by 900 cGy there was essentially no change in normal tissues. By 1,800 cGy, there was noted increased uptake in the tissues in the back, probably caused by inflammatory change in muscle and soft tissues at the treatment portal. At 2,700 cGy, there is intense uptake in the esophagus associated with clinical esophagitis; by 3,600 cGy, there was absence of uptake in a paratracheal lymph node that was involved by tumor; by 4,500 cGy, there was reduction in uptake of the normal marrow of the thoracic spine; by 5,400 cGy, there was reduction of uptake in the normal marrow of the lumbar spine.
Radiation response in a second patient considered to have progressed during the course of therapy showed a much different FDG-PET uptake profile, with essentially no change in SUVmax and TLG during the early treatment, but with increase in both parameters thereafter (6). Preliminary data are also shown for non-small cell lung cancer, in which FDG accurately predicted response of the primary lung cancer to both combination chemoradiation therapy and EBRT (10).
As mentioned earlier, prospective monitoring through the course of EBRT may be the optimum way to determine radiation response in solid tumors. In most cases this is not practical, and we are left with the problem of obtaining a PET scan at an interval posttreatment that may not be optimum for predicting response in tumor or normal tissue. Other examples of the value of FDG-PET in monitoring radiotherapy treatment response are given in Figure 57.4.
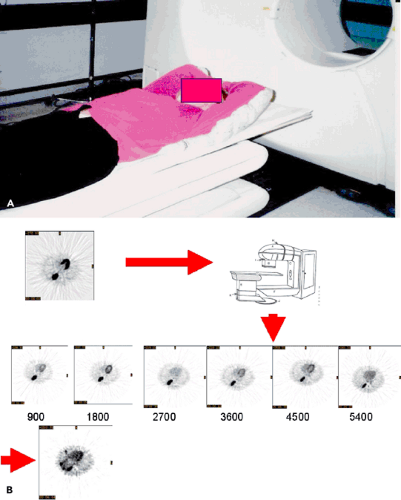 Figure 57.3 A: Radiotherapy patient setup in Styrofoam mold for lung cancer used for PET imaging. B: Same transaxial slice from repeat FDG-PET scans performed weekly during a course of radiotherapy up to 5,400 cGy. C: Comparison of different potential PET measures of treatment response: average SUV in the tumor volume, maximum SUV, FDG-avid volume defined by the same 42% of maximum threshold for each PET scan, total lesion glycolysis (TLG) defined as the product of the average SUV with the FDG tumor volume and the TLG normalized by the initial pretreatment TLGo value (TLG(t)/TLGo). D-F: Split-screen display of a slice through the center of the lesion pretreatment and posttreatment. Transaxial, coronal, and sagittal planes are shown. From Ref. 6, Erdi et al. 2000). |
Combined Chemoradiation Response in Esophageal Cancer
The value of PET-FDG in monitoring treatment response to combined chemoradiation is clear in esophageal cancers (11,12,13,14,15). Patients were studied at baseline and prior to surgery after combined chemoradiation (Fig. 57.5). Those patients who had a greater than 55% to 59% decline in SUVmax
had significantly better progression-free survival than patients with a lesser response (see Chapter 41).
had significantly better progression-free survival than patients with a lesser response (see Chapter 41).
Combined Chemoradiation Response in Colorectal Cancer
Early PET studies indicated that FDG uptake would decline after irradiation of colorectal cancers (16). Preliminary data are now available regarding the monitoring of treatment response using FDG-PET imaging in colorectal cancer (17). In this pilot study, patients who did not respond to radiation had an SUVmax and TLG decline of less than 37%, whereas those who did respond had a mean SUVmax drop of greater than 67% between baseline and presurgical assessment (Fig. 57.6) (see Chapter 44).
Combined Chemoradiation Response in Lymphoma
Because of increasing effectiveness of chemotherapy in lymphoma, radiation is less frequently used as a primary treatment modality of this disorder. Often, radiation and chemotherapy are combined. PET-FDG is commonly used to monitor treatment response in lymphoma, with or without radiation. The persistence of metabolic activity at the disease site is highly suggestive of residual disease (18). PET imaging is much more effective than CT or other structural imaging modalities in predicting response to either chemotherapy or radiation (19) (see Chapter 55).
Recurrence Detection after EBRT with FDG-PET
PET imaging for the detection of recurrence after RT is complicated by the inflammatory response in the normal tissues surrounding the tumor.
Primary Brain Tumors
PET-FDG imaging was introduced clinically in brain tumors, because of the availability of dedicated brain PET scanners (20,21,22). The differential diagnosis of brain tumor recurrence versus radiation necrosis is a difficult clinical diagnosis, and on cross-sectional imaging there may be significant mass effect that may increase over time and still be owing to radiation necrosis. In this scenario, FDG scanning may be useful in certain situations to detect recurrence versus radiation necrosis. A word of caution is in order, however, in that with gamma knife and other highly focused and intense radiation, the inflammatory response may be greater than with external beam radiotherapy alone. Thus the most reliable outcome on FDG-PET is a mass in the region of the previously positive high-grade glioma, which no longer takes up the radiotracer (Fig. 57.7) (see also Chapter 22).
Head and Neck Cancer
Radiation therapy has become a mainstay of treatment of head and neck cancers (23), and FDG-PET is frequently used in monitoring and detecting recurrence (24,25,26,27,28,29,30,31).
Because of the complex anatomy in the neck, combined PET-CT offers significant advantages in the staging, monitoring of treatment response, and detecting of recurrent disease. In a study by Kubota et al. (31), for example, FDG-PET was performed at a median interval of 4 months after primary therapy when radiation was completed, principally because of residual masses on palpation or on other cross-sectional imaging. FDG-PET performed more accurately in this setting than magnetic resonance imaging (MRI) or CT. Because of the continued presence of inflammation, the sensitivity, specificity, and accuracy of this technique were 70%, 81%, and 70%, respectively. False-positive findings were a problem, but a negative PET excluded disease with a high degree of certainty (negative-predictive value [NPV] 92%). Others have confirmed these findings and have also noted a high accuracy of PET in detecting distant metastases (32,33) (Fig. 57.8) (see also Chapter 34).
Because of the complex anatomy in the neck, combined PET-CT offers significant advantages in the staging, monitoring of treatment response, and detecting of recurrent disease. In a study by Kubota et al. (31), for example, FDG-PET was performed at a median interval of 4 months after primary therapy when radiation was completed, principally because of residual masses on palpation or on other cross-sectional imaging. FDG-PET performed more accurately in this setting than magnetic resonance imaging (MRI) or CT. Because of the continued presence of inflammation, the sensitivity, specificity, and accuracy of this technique were 70%, 81%, and 70%, respectively. False-positive findings were a problem, but a negative PET excluded disease with a high degree of certainty (negative-predictive value [NPV] 92%). Others have confirmed these findings and have also noted a high accuracy of PET in detecting distant metastases (32,33) (Fig. 57.8) (see also Chapter 34).
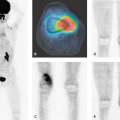
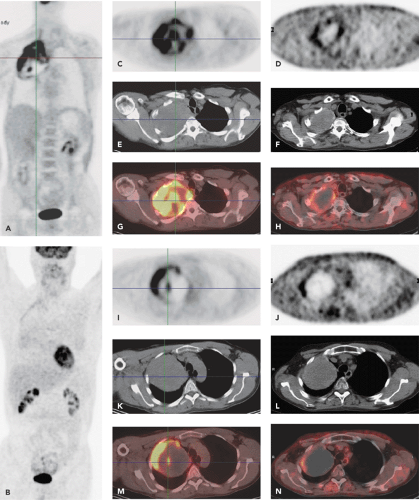 Figure 57.4 A patient with non–small cell lung cancer in the upper lobe and apex of the right lung (Pancoast tumor) before and after radiation therapy. Coronal FDG-PET images before (A) and after (B) therapy. Transaxial CT, PET, and PET/CT fusion images before (left) and after (right) radiation therapy. The images C-H show the top portion of this large lung cancer. Pretreatment, there is inhomogeneous FDG uptake within this lesion, likely indicating partial necrosis of this large tumor. After therapy, there remains a rim of mild FDG uptake around the lesion, likely indicating some degree of residual disease. The images I-N are in the same format as C-H and show the bottom portion of this large lung cancer. Following therapy, the mass is now largely necrotic (lack of FDG uptake), except for a hypermetabolic rim along its lateral border, which indicates residual diseases.
Related posts: PET Radiopharmaceuticals: Perfusion Compounds [13N]Ammonia, [15O]Water, [82RB]Rubidium, and Other Generator Products of Clinical Relevance PET Radiopharmaceuticals: Perfusion Compounds [13N]Ammonia, [15O]Water, [82RB]Rubidium, and Other Generator Products of Clinical Relevance
 The Normal Brain Scan The Normal Brain Scan
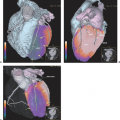 Integrated SPECT-CT and PET-CT in Cardiac Imaging Integrated SPECT-CT and PET-CT in Cardiac Imaging
 PET-CT and SPECT-CT of Malignant Bone Tumors PET-CT and SPECT-CT of Malignant Bone Tumors
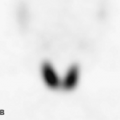 SPECT and PET in Benign Thyroid and Parathyroid Disease SPECT and PET in Benign Thyroid and Parathyroid Disease
Stay updated, free articles. Join our Telegram channel
Full access? Get Clinical Tree
 Get Clinical Tree app for offline access

|