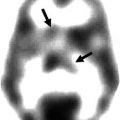
Fig. 28.1
Decreasing striatal 123I-β-CIT binding over time in patients with APS. Striatal 123I-β-CIT binding in individual patients with atypical parkinsonian syndromes, including MSA (circles), PSP (squares), and CBD (triangles), at the baseline and follow-up SPECT scans (Pirker et al. 2002). Binding values from the same patients were connected by lines and plotted against the disease duration (the x-axis; in years) at the time of imaging. (Reprinted from Mov Disord; Volume 17, Issue 1, pages 45–53, 2002, Fig. 28.1; permission to reproduce requested)
Other 123I-β-CIT SPECT studies have further shown reduced and symmetrical DAT binding in the striatum in patients with MSA. A study comparing 26 MSA patients with 157 PD patients found that there was a substantial reduction of striatal DAT binding in both PD and MSA groups (Varrone et al. 2001). Although the magnitude of DAT loss did not differentiate between the two diseases, MSA patients exhibited less asymmetric loss in the striatum relative to the PD patients, which was thought to be compatible with the less asymmetric symptoms in MSA. These findings were substantiated in another 123I-β-CIT SPECT study, in which MSA patients were also found to have less asymmetry in striatal binding than PD patients (with the exception of one MSA patient who had high asymmetry). Furthermore, a 15 % hemispheric difference in binding value was suggested as the cutoff for differentiating PD (>15 %) from MSA (5–15 %), relative to healthy controls (<5 %) (Knudsen et al. 2004).
In contrast to these findings, other SPECT studies have reported that the asymmetry in striatal binding was either not significantly different between MSA and PD (Pirker et al. 2000) or even greater in patients with MSA (Perju-Dumbrava et al. 2012). In a recent study of patients with a definitive postmortem diagnosis, Perju-Dumbrava and colleagues found that there was a trend of greater asymmetry of striatal DAT binding in MSA compared with PD. Among the six MSA cases studied, two patients had been misdiagnosed during their lifetime; in particular, one patient with pronounced asymmetry in striatal DAT binding and clear asymmetry of clinical symptoms had been misdiagnosed with CBD. Based on these data and the relatively low accuracy of clinical diagnosis in MSA reported in literature (Hughes et al. 2002; Litvan et al. 1997), the authors pointed out that because MSA patients with clear clinical asymmetry were more likely to have been misdiagnosed or excluded from prior imaging studies, the striatal binding asymmetry could have been underestimated for MSA, resulting in a possible bias of patient selection. Thus, they concluded that individual MSA and PD patients cannot be differentiated accurately by subregional analysis of striatal DAT binding (Perju-Dumbrava et al. 2012).
DAT reduction has also been observed in the midbrain of MSA patients. In an 123I-β-CIT SPECT study of 15 patients with early-stage MSA, 15 early PD patients, and 13 healthy control subjects, both MSA and PD patients showed significant loss of striatal DAT binding, while only MSA patients had binding loss in the midbrain. More interestingly, binding values in the caudate and midbrain together provided an accurate classification (95.2 %) of subjects as MSA, PD, or normal control. Although it is perhaps more clinically relevant to exclude the normal controls from this discriminant analysis, the data underscore the importance of measuring midbrain DAT binding in patients with MSA as well as applying this measure to the differential diagnosis of patients with uncertain parkinsonism (Scherfler et al. 2005).
Technetium-99m ethyl cysteinate dimer (99mTc-ECD) perfusion SPECT has also been used in the differentiation of PD and MSA. One study found that the putamen was the only region where there was a significant difference in uptake between MSA and PD (Bosman et al. 2003). Using the putamen uptake value as the discriminating factor, an accuracy of 83.6 % was achieved in classifying MSA patients against a combined group of PD and healthy controls, but decreased to 67 % in a three-group analysis of MSA, PD, and healthy volunteers. Furthermore, dual-tracer brain SPECT with 99mTc-ECD/123I-FP-CIT, which allows for simultaneous assessment of blood perfusion and DAT function in parkinsonian patients, was applied to the differential diagnosis of parkinsonism. There was significantly lower perfusion in the striatum in MSA compared to PD, while striatal DAT binding was higher in MSA than PD in the same patients (El Fakhri et al. 2006). Discriminant analysis revealed that the two imaging measures together improved the overall classification accuracy to 82.4 % in differentiating patients with PD, MSA, PSP, or dementia with Lewy bodies (DLB) over either imaging measure alone (DAT, 58.8 %; perfusion, 67.6 %). After excluding PD subjects from the analysis, a striking 100 % separation was achieved among MSA, PSP, and DLB (Van Laere et al. 2006). Although these results require rigorous validation in independent patient populations, dual-tracer DAT and perfusion SPECT may be potentially useful approaches for accurate differentiation between the most common APS in clinically uncertain cases.
In addition, SPECT imaging with dopamine D2 receptors radioligands (e.g., 123I-IBZM) has been used to study postsynaptic cell loss in patients with APS. In contrast to upregulated binding in the striatum of early PD (Kaasinen et al. 2000; Leenders 2003; Wenning et al. 1998), striatal D2 binding was found to be markedly reduced in MSA and PSP (Kim et al. 2002; Knudsen et al. 2004) while relatively preserved in CBD (Klaffke et al. 2006; Plotkin et al. 2005). Nonetheless, the role of 123I-IBZM SPECT on differential diagnosis of parkinsonism remains controversial. In an 123I-IBZM SPECT study, Vlaar et al. reported a low accuracy in differentiating between PD and APS (Vlaar et al. 2008). This result is in contrast with another SPECT study suggesting that a combination of 123I-FP-CIT, 123I-IBZM, and meta-123I-iodobenzylguanidine (MIBG) scintigraphy resulted in high accuracy of 94 % sensitivity and 94 % specificity in differentiating PD from APS (Sudmeyer et al. 2011). More studies are needed to investigate the utility of these imaging tracers in the diagnosis of APS.
28.2.2 PET
Metabolic Imaging
Functional imaging with 18F-fluorodeoxyglucose (FDG) PET can be applied to measure glucose utilization of neurons, which in turn provides an estimate of rest-state regional and global metabolism in the brain. Prior PET studies have shown hypometabolism in the striatum and cerebellum with increased metabolism in the frontal cortex in MSA (Eckert et al. 2005), while in PSP, hypometabolism was present in the supplementary motor area (SMA), anterior cingulate, thalamus, and striatum (Bartels et al. 2006; Eckert et al. 2005; Klein et al. 2005; Park et al. 2009; Teune et al. 2010). Moreover, regional hypometabolism in the striatum was found to be a common feature in both MSA and PSP (Ghaemi et al. 2002), in contrast to the increased metabolic activity in this region in PD (Bosman et al. 2003; Eckert et al. 2005; Eidelberg et al. 1993). In addition, profound asymmetric hypometabolism in the frontal and parietal areas is a unique feature in CBD (Eckert et al. 2005; Teune et al. 2010).
The use of spatial covariance analysis on FDG PET imaging data has led to the discovery of abnormal brain metabolic networks specifically related to neurodegenerative diseases such as PD and other parkinsonian syndromes (Eckert and Eidelberg 2005; Eidelberg 2009; Poston and Eidelberg 2009). The technical details of the spatial covariance analysis (or network analysis) have been previously described in detail (see Eidelberg 2009 for review). Briefly, a multivariate method utilizing principal component analysis (PCA) was employed to analyze voxel-wise metabolic imaging data in FDG PET scans from a combined group of patients and healthy subjects. This approach allows for the identification of spatial covariance patterns of brain regions in which metabolic abnormalities can be quantified as subject scores, which are used to differentiate between the patient and healthy control groups (e.g., Feigin et al. 2007; Habeck et al. 2008; Ma et al. 2007). After a disease-related metabolic pattern is identified in the original derivation cohort, the expression of this pattern (i.e., subject score) can be computed prospectively in individual scans of new subjects. In each individual scan, the subject score of the disease-related pattern can be viewed as a quantitative representation of the whole-brain metabolic abnormality for this subject at the time of imaging. Because of their quantitative nature, subject scores can be used to examine group separation, disease progression, treatment responses, and even individual correlations of imaging changes with clinical or neuropsychological measures in neurodegenerative disorders.
FDG PET with network analysis has proven useful in identifying abnormal metabolic networks associated with motor and cognitive manifestations in PD. In 1994, Eidelberg and colleagues first discovered the PD-related motor pattern (PDRP) in patients with PD (Eidelberg et al. 1994). This pattern, characterized by pallido-thalamic metabolic increases and concurrent metabolic decreases in the premotor cortex, supplementary motor area, and parietal association areas, was later replicated in a larger population of PD patients from the United States (Ma et al. 2007) and another independent group of PD patients from the Netherlands (Teune et al. 2013). The expression of PDRP in individual subjects has been validated in seven independent patient populations around the globe (Eckert and Eidelberg 2005). Moreover, a distinct cognition-related spatial covariance pattern was identified in non-demented PD patients (Huang et al. 2007). This PD-related cognitive pattern (PDCP) is characterized by metabolic reductions in the rostral supplementary motor area (pre-SMA), prefrontal cortex, precuneus, and parietal association regions, with metabolic increases in the cerebellar vermis and dentate nuclei. PDCP expression was correlated with performance on neuropsychological tests of executive functioning, such as the California and Hopkins Verbal Learning Tests (CVLT/HVLT), in the original derivation and in prospective groups of non-demented PD patients with or without minimal cognitive impairment (MCI) (Huang et al. 2008). Furthermore, in a 4-year longitudinal study of early PD patients (Huang et al. 2007; Tang et al. 2010a), both PDRP and PDCP expressions were found to increase with disease progression over time in the whole brain and in the two hemispheres independently, although PDCP expression reached abnormal levels approximately 4 years later than PDRP expression.
The network approach has also been employed to identify specific disease-related metabolic patterns for MSA and PSP (Eckert et al. 2008). The MSA-related pattern (MSARP) is characterized by metabolic decreases in the putamen and cerebellum (Fig. 28.2a, left); the PSP-related pattern (PSPRP) is characterized by metabolic reductions in the upper brainstem, medial prefrontal cortex, and medial thalamus (Fig. 28.2b, left). These patterns have recently been reproduced and validated in independent cohorts of MSA and PSP patients from the Netherlands (Teune et al. 2013). Like the PDRP, the expression of each of these patterns accurately discriminates between patients and healthy controls on an individual basis in the original pattern derivation cohort (Fig. 28.2a, b right) as well as in independent testing cohorts (Eckert et al. 2008; Spetsieris et al. 2009). These data demonstrated that the parkinsonian syndromes such as MSA and PSP are indeed associated with distinct patterns of abnormal metabolic activity.
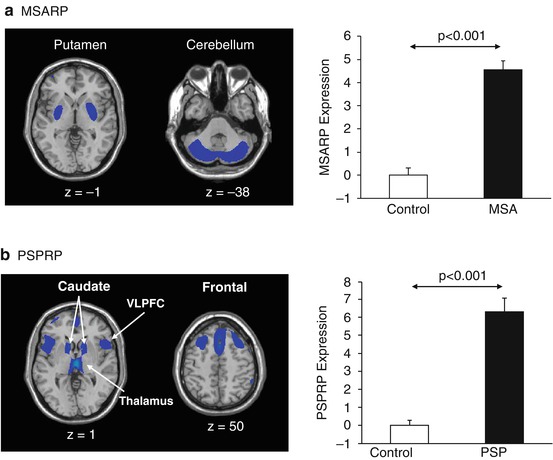

Fig. 28.2
Metabolic networks associated with MSA and PSP. (a) Left, Multiple system atrophy-related metabolic pattern (MSARP) characterized by covarying metabolic decreases in the putamen and cerebellum (Eckert et al. 2008). Right, MSARP expression (subject scores) was abnormally elevated (p < 0.001) in ten MSA patients relative to ten healthy control subjects, whose FDG PET scans were originally used for the derivation of this pattern. (b) Left, Progressive supranuclear palsy-related metabolic pattern (PSPRP) characterized by covarying metabolic decreases in the medial prefrontal cortex, ventrolateral prefrontal cortex (VLPFC), caudate nuclei, thalamus, and brainstem (Eckert et al. 2008). Right, PSPRP expression was abnormally elevated (p < 0.001) in the original derivation cohort of ten PSP patients relative to ten healthy control subjects. (Reprinted from Mov Disord; Volume 23, Issue 5, pages 727–733, 2008, Fig. 28.2; permission to reproduce requested)
Metabolic networks may also be used as potential imaging biomarkers for disease progression in other parkinsonian syndromes. In a recent study, MSARP expression was computed in FDG PET scans of a large cohort of MSA patients (Poston et al. 2012). MSARP scores were found to be correlated with motor ratings as well as disease duration, indicating greater metabolic abnormality in patients with more severe motor disability and longer disease duration. Interestingly, two MSA patients who were clinically followed for up to 7 years exhibited continuous increases in MSARP expression over time, while their PDRP scores fluctuated within the normal range over the same time period. Though the association between pattern expression and disease progression needs to be further examined in prospective longitudinal studies of larger populations, especially for early-stage patients, the present findings suggest that the MSARP could be a sensitive biomarker for disease severity and progression in patients with MSA. Likewise, the investigation of progressive changes of metabolic networks in other parkinsonian syndromes can be the focus of future PET studies.
Differential Diagnosis
In addition to providing unique information on disease progression, metabolic imaging and network analysis may be valuable in facilitating differential diagnosis in patients with APS. Visual inspection of FDG PET images has typically been used to facilitate clinical diagnosis in patients with parkinsonism. To improve diagnostic accuracy, a computer-assisted technique was developed to assist in the visual reading of PET images for parkinsonian patients prior to their clinical diagnosis (Eckert et al. 2005). In 135 parkinsonian patients referred for FDG PET, imaging diagnosis obtained by computer-assisted visual assessment was found to agree with final clinical diagnosis in approximately 90 % of all PD and APS subjects (MSA, PSP, and CBD). These subjects were followed for 2 years by movement disorders specialists that were blinded to the initial imaging findings. Although this method still requires visual interpretation by an image reader, the results of this study demonstrate that the application of computer-assisted technology may be useful in improving diagnostic accuracy beyond the standard PET reading.
To automate the differential diagnostic procedure, a computerized algorithm was developed based on network analysis of FDG PET scans of 167 patients with uncertain parkinsonism who were referred for PET (Tang et al. 2010b). These patients were then followed by movement disorders specialists for over 2 years to obtain a final clinical diagnosis. For each patient, subject scores of different metabolic patterns related to PD, MSA, and PSP were computed and used to calculate the probability of each disease. The algorithm is a fully automated two-level classification procedure. At the first level, a logistic regression model was utilized to discriminate between the PD group and a combined group of MSA and PSP patients and to compute the probabilities of having PD and APS for each subject. At the second level, logistic regression analysis was also used to further discriminate MSA and PSP patients by computing the probabilities of these two diseases for each subject. At both levels, image-based classification was determined for individual patients based on each subject’s disease probabilities with reference to the diagnostic criteria that were established from the receiver operating characteristic (ROC) curve analysis of the probabilities of all subjects. Finally, the image-based classifications of individual patients were compared to their follow-up clinical diagnosis. It was found that the image-based algorithm achieved highly accurate classification results (91–98 % positive predictive value, 94–96 % specificity, and 84–88 % of sensitivity) for differential diagnosis of PD, MSA, and PSP. In addition, the classification results remained accurate in a subset of early patients with very short symptom durations (i.e., <2 years) at the time of PET as well as in a small subgroup of subjects whose clinical diagnoses were confirmed at autopsy. It is worthwhile to point out that a small proportion (14 %) of subjects could not be definitively classified as having either PD or APS and were classified into an indeterminate parkinsonism category. These indeterminate cases may not have developed sufficient metabolic abnormalities at the time of PET, thus requiring clinical follow-up to reach a definitive diagnosis, or they may have had other atypical parkinsonian syndromes such as CBD.
Indeed, the automated algorithm for differential diagnosis may be further developed to include CBD. Because this disease only accounts for less than 5 % of APS (Hughes et al. 1992, 2002), it is more difficult to recruit a group of CBD patients with reliable clinical diagnosis than other types of APS in a PET study. Nonetheless, there is an ongoing investigation to identify a metabolic network specifically related to CBD. Network analysis on preliminary PET data revealed a prototype CBD-related pattern (CBDRP) characterized by asymmetric metabolic decreases in the motor/premotor cortex, supplemental motor area, caudate, thalamus, and inferior frontal gyrus (Fig. 28.3a; unpublished preliminary data). Subject scores of this pattern computed from the scans significantly separated the individual CBD patients from the healthy controls (Fig. 28.3b). Though these preliminary results are promising, this pattern was derived from a small group of patients and has not been validated in independent patient cohorts. Nonetheless, once a specific network for CBD is identified and confirmed, it can be incorporated into the present automated algorithm for differential diagnosis of this disease.
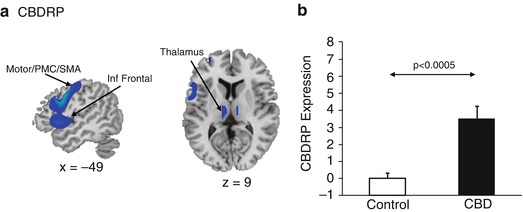

Fig. 28.3
Metabolic networks associated with CBD. (a) Prototype corticobasal degeneration-related pattern (CBDRP) characterized by covarying metabolic decreases in the motor cortex, premotor cortex (PMC), supplementary motor area (SMA), caudate, thalamus, and inferior frontal gyrus. (b) CBDRP expression was abnormally elevated (p < 0.0005) in seven CBD patients relative to seven healthy control subjects, whose FDG PET scans were used for the derivation of this pattern
These data have demonstrated that the imaging classification approach based on disease-related metabolic networks can assist in accurate differential diagnosis for parkinsonian patients several years before a final diagnosis is made. Before its application to clinical cases, the automated differential diagnosis algorithm needs to be prospectively tested in independent patient populations with rigorously ascertained follow-up diagnosis in multicenter longitudinal studies. The algorithm may also prove useful as a screening test for the recruitment of participants in clinical trials for APS. The identification of misdiagnosed subjects and even “indeterminate” cases before enrollment provides a distinct advantage of the image-based classification procedure for identifying appropriate candidates in clinical studies.
Microglial Imaging
Neuropathological studies have demonstrated that neuroinflammation associated with increased microglial activation is present in PD (Imamura et al. 2003), MSA (Ishizawa et al. 2004), and PSP and CBD (Ishizawa and Dickson 2001), suggesting that activated microglia play a role in the pathogenesis of these neurodegenerative disorders. [11C](R)-PK11195 is a specific ligand for the mitochondrial translocator protein 18 kDa (TSPO; previously also known as the peripheral benzodiazepine binding site (PBBS)), which is highly expressed in activated microglial cells (Papadopoulos et al. 2006). [11C](R)-PK11195 with PET has thus been utilized to investigate microglial activation in idiopathic PD and other parkinsonian syndromes.
In a 6-OHDA-induced PD rat model, increased [11C](R)-PK11195 binding was found in the substantia nigra and striatum, indicating marked microglial activation in these areas, further confirmed by postmortem immunohistochemical evidence of regional neuroinflammatory responses (Cicchetti et al. 2002). PD patients with established diagnosis also exhibited significantly increased [11C](R)-PK11195 binding in the basal ganglia, as well as in the pons and frontal/temporal cortical regions. The binding levels, however, were not correlated with clinical severity and remain stable over time (Gerhard et al. 2006a). Nonetheless, in early drug-naïve PD patients, microglial activation in the midbrain was found to be correlated with clinical severity and also associated with dopamine loss in the putamen (Ouchi et al. 2005). Therefore, it was postulated that neuroinflammation with microglial activation contributes to the early neurodegenerative process of the disease and that, theoretically, early treatment with anti-inflammatory or neuroprotective drugs may be beneficial to patients with PD (Bartels and Leenders 2007). To explore this hypothesis, Bartels et al. recently conducted a pilot [11C](R)-PK11195 PET study on five PD patients treated with celecoxib – a cyclooxygenase-2 (COX-2) inhibitor (Bartels et al. 2010). Although COX-2 inhibition did not result in significant posttreatment changes in the putamen and midbrain binding levels in this small sample, the study provided useful information suggesting that the neuroinflammation is likely to be a persistent neuropathological process in PD that is not easily altered by the conventional anti-inflammatory therapy.
Several studies have also focused on investigating neuroinflammatory changes with [11C](R)-PK11195 PET in APS patients. Increased binding was found in the substantia nigra, putamen, pallidum, pons, and dorsolateral prefrontal cortex in MSA patients (Gerhard et al. 2003). In a clinical trial on MSA patients treated with minocycline, a second-generation tetracycline that has anti-inflammatory effects, two of the three patients scanned with [11C](R)-PK11195 PET showed decreased binding at 24 weeks after the treatment, in contrast to a longitudinal increase in binding in the placebo group (Dodel et al. 2010). Increased binding and microglial activation was also evident in the basal ganglia and cortical/subcortical regions in patients with PSP (Gerhard et al. 2006b) or CBD (Gerhard et al. 2004; Henkel et al. 2004), in accordance with the neuropathological changes in these disorders. These findings, though based on studies of small patient cohorts, support the notion that neuroinflammation and associated microglia activation contribute to the pathogenesis of APS. Large-scale studies on APS patients and healthy controls are needed to confirm these results and, importantly, examine the relationship between changes in microglial activation and disease progression. Whether anti-inflammatory therapy is an effective strategy for APS is also a topic of further investigation.
28.3 Future Directions
In this chapter, we have briefly reviewed recent advances in SPECT and PET imaging in the study of the progression and differential diagnosis of parkinsonian syndromes. We discussed the use of various presynaptic and postsynaptic radioligands with SPECT in the research of MSA, PSP, and CBD, as well as the latest FDG PET findings of brain metabolic networks associated with these disorders. A distinct advantage of network analysis over conventional imaging analytical techniques, such as group-mean-based statistical parametric mapping (SPM) analysis, is its prospective application on individual subjects. That is, once a disease-specific pattern has been identified and validated, the expression of this pattern in a given subject can be computed prospectively from that individual’s scan. The resulting pattern expression values for individual subjects can be used to discriminate between groups, assess the progression of the disease, or correlate with other measures/biomarkers in cross-sectional or longitudinal datasets (Eidelberg 2009).
Although the disease-specific patterns identified were derived originally from FDG PET scans using spatial covariance analysis, the application of these patterns is not limited to metabolic imaging. Eckert et al. have demonstrated that the expression of the PD-related metabolic pattern (i.e., PDRP) derived from FDG PET scans not only can be quantified prospectively in 99mTc-ECD SPECT images of patients with PD or MSA but also differentiate the two diseases with an accuracy of 91 % (Eckert et al. 2007). This proof-of-principle study indicates that network analysis can be applied to SPECT scans of parkinsonian patients and that the disease-related brain networks represent the underlying pathology of respective disorders rather than the imaging modality per se. In this vein, it is conceivable that spatial covariance analysis may be utilized in future SPECT imaging studies to identify abnormal functional networks specific to each parkinsonian disorder.
For differential diagnosis of APS, we focused on the development and application of an automated algorithm integrating multiple disease-related networks for accurate classification of individual patients with PD, MSA, or PSP at early disease stages when the clinical diagnosis is still uncertain. This algorithm for differential diagnosis can be further developed to include other less common APS, such as CBD, after the disease-related patterns for these disorders are formally derived and validated. Needless to say, this method may have a profound impact on the research of parkinsonism as it can be used as an objective screening tool that, in addition to improving clinical diagnosis, can identify ideal candidates in clinical trials of APS. It may also help general neurologists and even the specialists to achieve higher accuracy in recognizing and diagnosing APS in routine clinical practice.
Stay updated, free articles. Join our Telegram channel

Full access? Get Clinical Tree


