PET Imaging in Cerebrovascular Disease
Alfred Buck
Bernhard Schuknecht
Yasuhiro Yonekawa
Cerebrovascular disease can be chronic or acute. A typical example of the latter is stroke. The clinical value of PET in the diagnostic workup of stroke patients is small, mainly due to its limited availability and high cost. Magnetic resonance imaging (MRI) has established itself as the method of choice in this field. Chronic cerebrovascular disease (CVD) is another matter. Symptoms such as transient ischemic attacks (TIAs) are often caused by severe stenoses in the larger arteries feeding the brain. In most cases, the treatment will be conservative. However, selected patients may benefit from surgical revascularization procedures. In these patients, a thorough diagnostic workup, including PET, is indicated. A special vascular pathology is moyamoya disease, which has the highest prevalence in Japan. At present, PET is the only method that allows a fully quantitative assessment of cerebral perfusion.
The physiological parameters of interest are blood flow (rCBF), blood volume (rCBV), and cerebral perfusion reserve, which can be evaluated with oxygen 15 [15O]H2O for perfusion and [15O]CO for blood volume. An important parameter is the perfusion reserve, which is the ratio of rCBF at rest to that during vasodilation. The latter is induced by hypercapnia achieved by inhalation of CO2-enriched air or the intravenous administration of acetazolamide (Diamox). In compromised areas, blood vessels are normally dilated, and the effect of hypercapnia is minimal. Thus, the perfusion reserve in such areas is reduced. For the assessment of perfusion reserve, two injections of [15O]H2O are needed, one at rest and one during hypercapnia. In between the two scans, it is possible to acquire the transmission scan for the correction of photon attenuation. The duration of the whole examination is 30 minutes. An example of a patient with a severe stenosis of the right internal carotid artery is shown in Figure 27.1.
The major indication for PET is the hemodynamic evaluation of cerebral perfusion before surgical revascularization. The most common tracer used to evaluate cerebral perfusion is [15O]H2O, which most often is intravenously injected as a bolus. Some groups use [15O]CO2, which is inhaled trough special delivery systems. In the body, [15O]CO2 is almost immediately converted to [15O]H2O. Another PET perfusion tracer is [15O]butanol. Cerebral blood volume (CBV) is typically altered in chronic cerebrovascular disease. It can be measured with [15O]CO. Recent studies demonstrated that the density of benzodiazepine receptors is a good predictor for potentially salvageable tissue following stroke. It can be assessed with carbon 11 [11C]flumazenil. Another crucial measure for the survival of tissue is oxygen metabolism, which is evaluated using 15O.
Cerebrovascular Disease–Imaging Methodology
Perfusion
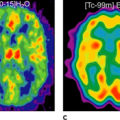
The kinetic behavior of diffusible perfusion tracers such as oxygen 15 [15O]H2O is crucially different from tracers that get trapped, such as the SPECT agent technetium 99m [99mTc]HMPAO. This difference warrants a completely different acquisition protocol. Since [99mTc]HMPAO uptake does not change following injection, imaging can be performed as a single scan from minutes to hours following injection. In contrast, [15O]H2O is washed in and out of the tissue within minutes. Together with the short physical half-life of [15O], this requires imaging to be performed within minutes following injection if one uses a bolus injection. An interesting alternative method for certain applications is the use of a constant infusion protocol, which allows the continuous monitoring of blood flow (1). A detailed description of the methods used for [15O]H2O imaging is given in the appendix at the end of the chapter.
Cerebral Blood Volume
Following inhalation as a bolus, [15O]CO is irreversibly bound to hemoglobin. Its distribution is therefore restricted to intravascular space. Thus, the ratio of the [15O]CO concentration in the brain and in blood directly yields the CBV.
Chronic Cerebrovascular Disease
PET Imaging in Chronic Cerebrovascular Disease
Stenoses of the larger arteries feeding the brain are common. An important clinical aspect in this regard concerns the hemodynamic significance. There are two mechanisms by which artherosclerotic plaques may lead to symptoms such as transient ischemic attacks (TIAs) or stroke. Emboli may break lose from the plaques and cause the symptoms. Another possibility is that the stenosis is severe enough to lead to compromised cerebral perfusion in areas fed by the affected artery. The cerebral vascular response to reduced perfusion is complex. As a first response to decreased perfusion, the brain increases the oxygen extraction fraction. Another response is the dilatation of the vessels in an attempt to reduce vascular resistance and counteract reductions in perfusion. When the potential of these mechanisms is fully exploited and the perfusion still decreases, the patient becomes symptomatic. For instance, if the perfusion is just sufficient with maximum oxygen extraction and fully dilated vessels, any further stress will lead to decompensation. Such patients may benefit from a revascularization procedure such as endarterectomy or extracranial to intracranial (EC-IC) bypass surgery. The improvement of cerebral perfusion following revascularization has been demonstrated in several studies (2,3,4,5,6,7). An example of a patient with a severe stenosis of the right internal carotid artery is shown in Figure 27.1.
There exist several methods and parameters for evaluating patients with chronic cerebrovascular disease. Based on the physiological regulation of cerebral blood flow, the assessment of blood volume and perfusion is useful. This is illustrated in Figure 27.2A. The images on the left sketch the vascular autoregulation that occurs in cerebrovascular disease. The most common site for stenoses is the carotid bifurcation. The regulatory steps include increase of the oxygen extraction and dilatation of the vessels to reduce vascular resistance. The latter step is equivalent to an increase in cerebral blood volume (CBV). One method of evaluating the hemodynamic situation is indeed based on the measurement of CBV. The CBV/CBF ratio is an especially useful measure. The critical situation is reached when the vessels are fully dilated and CBF continuous to decrease. This situation is reflected by an increasing CBV/CBF ratio. Alternatively, one can measure hemodynamic behavior during induced vasodilatation. A strong stimulus for vasodilatation is an increase in arterial CO2 (PaCO2). Hypercapnia can be induced by inhalation of an CO2-enriched air mixture or by the administration of acetazolamide (Diamox).
In healthy subjects, the reduced vascular resistance due to induced vasodilatation leads to an increase in CBF. The ratio of CBF during hypercapnia and at baseline is often referred to as the cerebral perfusion reserve. The situation with a stenosis is illustrated at the bottom of Figure 27.2A. rCBF is normal at baseline due to chronic vasodilation on the compromised side. Blood flow images will reveal symmetric perfusion in both hemispheres. Inducing hypercapnia will now dilate the vessels on the healthy side but not on the affected side or to a lesser degree, as they are already dilated. Blood flow will therefore predominantly increase on the healthy side, leading to a marked asymmetry in rCBF.
Blood flow imaging with SPECT primarily allows the qualitative assessment of CBF. The assessment of the hemodynamic situation with that modality most often relies on the evaluation of the CBV/CBF ratio or the asymmetry index during baseline and induced hypercapnia. A common problem arises if there is bilateral or even more extended disease. In that case, the hypercapnia-induced blood flow increase may be uniformly impaired and not lead to marked asymmetries. In these situations, the CBV/ CBF ratio may be a more reliable measure for the hemodynamic situation. The most accurate evaluation is the quantitative assessment of the hemodynamics, as is possible with PET. A disadvantage in the clinical setting is that the accurate full quantification of cerebral blood flow requires the placement of an arterial catheter for the measurement of the tracer concentration in arterial blood. However, in a recent publication we showed that a simplified method may be sufficient for clinical purposes. The method is based on injected activity and does not require arterial blood sampling (8). Another important issue is the reproducibility of a method. We did an evaluation in 42 subjects who underwent quantitative perfusion scanning on two
consecutive days. On each day, three scans were performed 10 minutes apart. It was then assumed that the actual flow values during the same session were identical. So the difference between scan 2 – scan 1 and scan 3 – scan 2 in the same session is a measure of reproducibility. The results are shown in Figure 27.2B as a Bland-Altman plot (9) for gray and white matter. To determine gray matter flow, the flow values in all gray matter voxels were averaged. The range between the bottom and top horizontal line is defined by mean ± 2 SD. In gray matter, 2 SD was 17.2%. This means that a change in mean gray matter flow has to be larger than 17% in order to be considered significant with a 95% probability. In white matter, the corresponding value is 20.5%.
consecutive days. On each day, three scans were performed 10 minutes apart. It was then assumed that the actual flow values during the same session were identical. So the difference between scan 2 – scan 1 and scan 3 – scan 2 in the same session is a measure of reproducibility. The results are shown in Figure 27.2B as a Bland-Altman plot (9) for gray and white matter. To determine gray matter flow, the flow values in all gray matter voxels were averaged. The range between the bottom and top horizontal line is defined by mean ± 2 SD. In gray matter, 2 SD was 17.2%. This means that a change in mean gray matter flow has to be larger than 17% in order to be considered significant with a 95% probability. In white matter, the corresponding value is 20.5%.
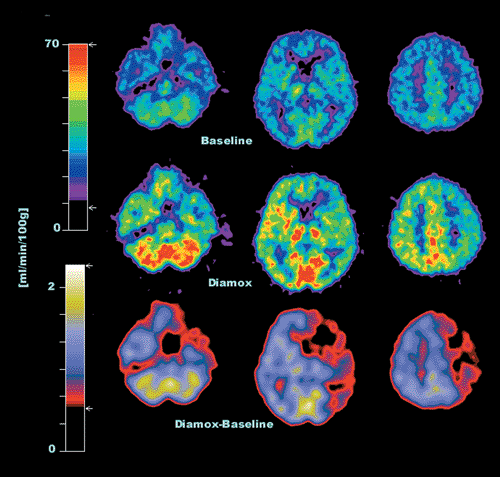 Figure 27.1 Evaluation of cerebrovascular perfusion status in a patient with severe stenosis of the right internal carotid artery. The baseline examination shows a symmetrical normal perfusion. After acetazolamide (Diamox) stimulation, the increase in perfusion is severely decreased in the territory of the right middle cerebral artery, which is also clearly appreciated on the difference image on the bottom. |
Examples of cerebrovascular evaluations are shown in Figures 27.3, 27.4 and 27.5. The benefit of surgical treatment of occlusive cerebrovascular disease is still inconclusive. One large international trial failed to demonstrate the effectiveness of EC-IC bypass surgery for preventing cerebral ischemia in patients with arteriosclerotic cerebrovascular disease (10). However, one criticism of that study is that the patients preoperative hemodynamic status was not
fully assessed. It is possible that a quantitative evaluation of the hemodynamic situation may better select those patients who can potentially benefit from bypass surgery. A more recent study involving 12 patients demonstrated hemodynamic improvement following bypass surgery using quantitative [15O]H2O PET (11). A Japanese trial involving patients with low rCBF demonstrated no benefit from EC-IC bypass surgery in terms of stroke prevention, although a significant improvement of rCBF was found in the surgical group (12). It is obvious that larger studies are needed to resolve the issue.
fully assessed. It is possible that a quantitative evaluation of the hemodynamic situation may better select those patients who can potentially benefit from bypass surgery. A more recent study involving 12 patients demonstrated hemodynamic improvement following bypass surgery using quantitative [15O]H2O PET (11). A Japanese trial involving patients with low rCBF demonstrated no benefit from EC-IC bypass surgery in terms of stroke prevention, although a significant improvement of rCBF was found in the surgical group (12). It is obvious that larger studies are needed to resolve the issue.
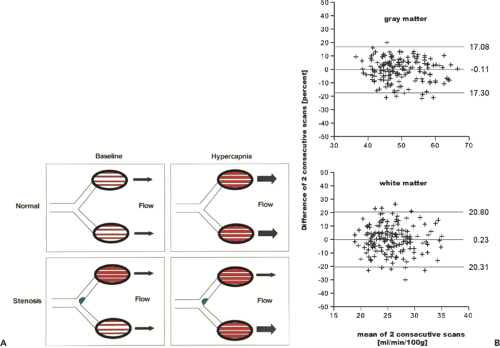 Figure 27.2 A: Schematic representation of the vascular response to hypoxia and hypercapnia. In the normal brain, hypercapnia induces vasodilatation and a subsequent symmetric increase in blood flow (top row). In chronic cerebrovascular disease, a severe stenosis may lead to vasodilatation in an attempt to reduce vascular resistance and maintain an adequate blood flow (bottom left). The flow may still be symmetric. If the vessels are maximally dilated on the compromised side, hypercapnia will only dilate the vessels on the healthy side, leading to an asymmetric increase of blood flow (bottom right). B: Reproducibility of [15O]H2O perfusion measurements. Shown is the Bland-Altman plot of 336 consecutive perfusion scans performed in 42 subjects. The represented parameter is mean gray and white matter blood flow. The x-axis represents the mean of two consecutive scans acquired 10 minutes apart. The difference of two consecutive scans in percentage change is shown on the yaxis. The middle line is the mean difference, the top and bottom lines represent the mean ± 2 SD. |
SPECT Imaging in Chronic Cerebrovascular Disease
SPECT allows the qualitative assessment of the hemodynamics using tracers like [99mTc]HMPAO or [99mTc]ECD. The major advantage of SPECT is its wide availability. Differences in the uptake pattern at baseline and during hypercapnia allow conclusions regarding the perfusion reserve. The cerebral blood volume can be assessed using 99mTc-labeled erythrocytes. The disadvantages of SPECT compared with PET are as follows:
It is qualitative, although attempts at quantification have been published.
Under physiological conditions, the SPECT perfusion tracers are only 60% to 70% extracted, and the intracellular trapping requires an intact metabolism. In pathological situations, the extraction and the intracellular trapping may be changed. Thus, altered uptake may reflect not just changed blood flow. In this regard, [15O]H2O is ideal: it does not require intact metabolism, and its extraction fraction is high.
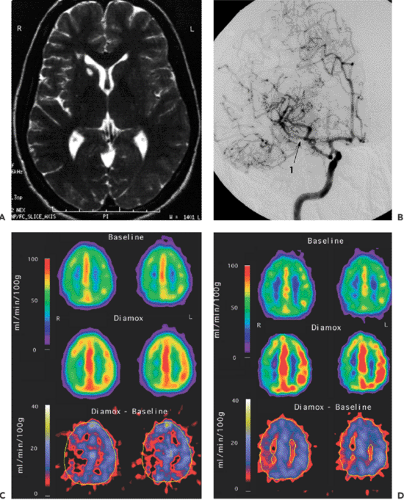
Figure 27.3 A: The axial T2-weighted image shows enhanced signal in the right caudate, indicating infarction. B: The preoperative angiogram shows the stenosis of the right middle carotid artery (arrow 1). C: Preoperative quantitative evaluation of cerebral blood flow with [15O]H2O PET. The difference between blood flow during hypercapnia (Diamox) and baseline is depicted in the bottom row. Note the reduced baseline flow and the lack of increase during hypercapnia in most of the right MCA territory. D: Quantitative evaluation of cerebral blood flow with [15O]H2O PET following EC-IC bypass from the superficial temporal artery to the middle carotid artery. There is a marked improvement in the hemodynamic situation, best appreciated on the difference images (bottom row). Although there is still an impaired perfusion reserve in the posterior part of the MCA territory, the situation has clearly improved in the anterior part.
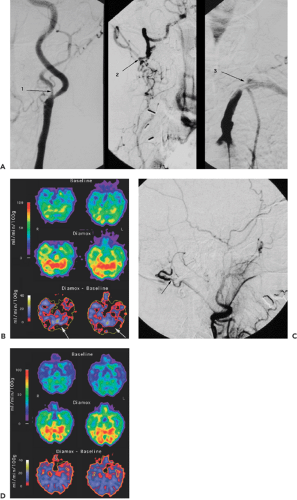
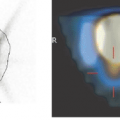
Figure 27.4 A: The preoperative angiograms in this patient show a stenosis of the left internal carotid artery (1) and the right vertebral artery (2) and a complete occlusion of the left vertebral artery (3). B: Preoperative quantitative evaluation of cerebral blood flow with [15O]H2O PET. The difference between blood flow during hypercapnia (Diamox) and baseline is depicted in the bottom row. Note the lack of increase of blood flow during hypercapnia in parts of the left cerebellum (arrows). C: Angiogram following EC-IC bypass from the occipital artery to the posterior inferior cerebellar artery. The arrow points to the anastomosis at the occipital artery. D: Quantitative evaluation of cerebral blood flow with [15O]H2O PET following EC-IC bypass from the occipital artery to the posterior inferior cerebellar artery. The hemodynamic situation has completely normalized.Related posts:
 Basics of PET Scanning
 PET Radiopharmaceuticals: Perfusion Compounds [13N]Ammonia, [15O]Water, [82RB]Rubidium, and Other Generator Products of Clinical Relevance
 The Normal Brain Scan
 Sentinel Node Imaging in Head and Neck Tumors
 PET-CT and SPECT-CT of Bone Metastases
 SPECT and PET in Benign Thyroid and Parathyroid Disease

Stay updated, free articles. Join our Telegram channel

Full access? Get Clinical Tree

 Get Clinical Tree app for offline access
