Fig. 11.1
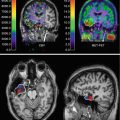
In the SPM analysis the coloured clusters label the significantly lower α4β2*-nAChR availability by assessment of the 2-FA distribution volume ratio (2-FA-DVR) in AD and MCI patients (pilot cohort and extended cohort each) compared with healthy controls. For calculation of 2-FA-DVR, see 2-FA-PET – Methods. Unpaired t-test for group comparisons, significance at p < 0.005 and p < 0.001. Medial views (top), posterior view (second row left), anterior view (second row right), lateral views (third row), inferior view (bottom left) and superior view (bottom right) (Adopted from Kendziorra et al. (2011) with modifications – permission for reproduction by Springer-Verlag)
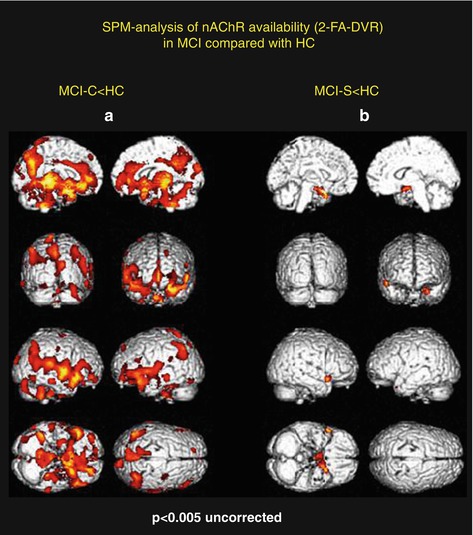
Fig. 11.2
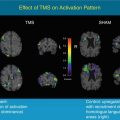
In the SPM analysis, compared with healthy controls, the coloured clusters label the significantly lower α4β2*-nAChR availability by the assessment of the 2-FA distribution volume ratio (2-FA-DVR) in MCI who converted to AD (MCI-C, n = 5) (a) and in MCI who remain stable in the clinical follow-up period and show only minor 2-FA-DVR changes (b) (MCI-S, n = 3). For calculation of 2-FA-DVR, see 2-FA-PET – Methods. Unpaired t-test for group comparisons, significance at p < 0.005. Medial views (top), posterior view (second row left), anterior view (second row right), lateral views (third row), inferior view (bottom left) and superior view (bottom right) (Adopted from Kendziorra et al. (2011) – permission for reproduction by Springer-Verlag)

For the SPM analysis the 2-FA-DVR was calculated by scaling the 2-FA-DV to the corpus callosum (CC) or the cerebellum. To determine the 2-FA-DVR, 2-FA-DV values within the CC and the cerebellum were assessed by the ROI analysis. For the SPM analysis brain images of the subjects were spatially normalized to the Talairach space using the [15O]H2O SPM PET template provided by SPM. The PET data were smoothed with a 12-mm FWHM Gaussian kernel in order to adapt the variation between the individual brains and heighten the signal-to-noise ratio (Kendziorra et al. 2011).
11.5.2 2-FA-PET: Results and Discussion
Both voxel-based (SPM) and ROI-based analyses revealed a widespread, significant reduction of 2-FA binding in the AD and MCI cohort comprising especially the posterior cingulate cortex/precuneus, the temporal cortex and the hippocampus, as well as the thalamus. The reduction pattern was found in both the pilot sample and the extended cohort in AD and MCI (Fig. 11.1). In the extended cohort of AD compared to the pilot cohort of AD, the pattern of lower α4β2*-nAChR binding relative to HC was more widespread, possibly due to the fact that the extended cohort of AD had a slightly higher degree of dementia as indicated by the lower MMSE (16.8 ± 5.9, p < 0.05) compared to the pilot cohort of AD (MMSE 18.3 ± 5.8) (Fig. 11.1, Kendziorra et al. 2011; Sabri et al. 2008). The nAChR reduction pattern corroborates postmortem data and points to a diagnostic capacity of high-affinity α4β2*-nAChR-specific PET radioligands such as 2-FA.
In order to assess whether amnestic MCI later progress to AD, patients were clinically followed with the mean follow-up of our cohorts of 33 months ranging from 24 to 44 months. From the pilot cohort, five out of eight with MCI converted into probably AD (MCI-C), whereas three remained stable (MCI-S; Fig. 11.2). In the extended study cohort, there were seven converters and four cognitively stable patients out of 11 with amnestic MCI (Fig. 11.1). Using 2-FA-PET, HC and AD clearly differed from each other with clear reduction of α4β2*-nAChR binding across the brain in typically AD-affected brain regions especially in the precuneus/posterior cingulate cortex, thalamus, (para)hippocampus, temporal cortex, frontal cortex and caudate nucleus in case of AD (Fig. 11.1). Whereas the cognitively stable MCI (non-converters, MCI-S; Fig. 11.2b) had α4β2*-nAChR binding in the range of HC, the MCI patients later progressing to AD showed a α4β2*-nAChR reduction pattern and values similar to AD (MCI-C; Fig. 11.2a, Kendziorra et al. 2011). This important finding suggests that 2-FA-PET is highly sensitive and capable to predict a later progression from amnestic MCI to AD.
Interestingly, using FDG-PET in amnestic MCI, we found less pronounced and less significant reduced FDG uptake especially in the precuneus/posterior cingulate cortex (MCI-S) and parietotemporal (MCI-C), suggesting that 2-FA-PET might be more sensitive than FDG-PET to detect abnormalities in amnestic MCI. However, due to the small numbers of the study subjects, further multicentre investigations for verification would be needed (Sabri et al. 2008). Moreover, lower α4β2*-nAChR binding in AD and MCI was significantly related to the degree of cognitive symptoms as assessed by DemTect and MMSE in brain regions typically affected in AD such as the temporal cortex, anterior and posterior cingulate cortex, hippocampus, frontal cortex as well as caudate nucleus (Kendziorra et al. 2011; Sabri et al. 2008).
Also, preliminary analyses in VaD (n = 4) defined as having a lesion load greater than 40 % of deep white matter indicate that there is a broad reduction of α4β2*-nAChR availability similar to AD. When compared with each other in a ROI analysis, cortical and subcortical grey matter α4β2*-nAChR reduction patterns are similar in AD, mixed dementia, or VaD. In contrast, in the white matter, α4β2*-nAChR binding significantly differ between patient groups and compared to HC. In AD white matter, α4β2*-nAChR binding is not reduced; in mixed dementia white matter, there is interestingly a tendency for reduced α4β2*-nAChR binding (p < 0.01); and in pure VaD white matter, there is significantly lower α4β2*-nAChR binding. Thus, patients with vascular dementia have additionally significantly reduced α4β2*-nAChR binding in the deep white matter (which is not found in AD), indicating a disrupted integrity of distinct fibre bundles in the brain of VaD.
Cerebral atrophy, especially in patients with moderate AD, and successive atrophy-allocated effects on the 2-FA-PET data are critical and should be taken into account for the interpretation of the PET results. Due to the fact that there is lower nAChR also in amnestic MCI, who have no or only mild brain atrophy, it is conceivable that the findings in AD patients are not primarily a result of atrophy (Kendziorra et al. 2011; Sabri et al. 2008). Also, to diminish atrophy-related effects, individual ROI analysis was performed and irregular, only appropriate brain tissue-comprising ROIs were assessed by means of individual MRI following MRI/PET coregistration (Kendziorra et al. 2011; Sabri et al. 2008). However, it cannot be ruled out that cerebral atrophy may contribute to the observed pattern of nAChR deficits especially in moderate AD compared to HC, and attempts to partial volume consideration shall be administered to clarify the influence of structural changes on the nAChR signal.
11.6 Monocentre 2-FA-PET Data in Context with Other Available PET/SPECT Studies on α4β2*-nAChR Binding in AD/MCI
There is some controversy regarding the question whether α4β2*-nAChRs are reduced, normal or even increased, for example, in the early stage of AD. Two studies using 5-[123I]I-A85380 (5-IA)-SPECT in mild AD (n = 12), MCI (n = 10) vs. HC (n = 10) (Mitsis et al. 2009) and 2-[18F]F-A85380 (2-FA)-PET in mild AD (n = 15) vs. HC (n = 14) (Ellis et al. 2008) assessed the distribution volume and did not find any significant differences of α4β2*-nAChR availability between groups. In contrast, using three different radioligands for the assessment of α4β2*-nAChR binding such as 5-IA, [11C]nicotine, 2-FA and four different research groups (O’Brien et al. 2007; Terriere et al. 2010; Nordberg et al. 1995; Sabri et al. 2008; Kendziorra et al. 2011) consistently reported decreases in α4β2*-nAChR binding. Using 5-IA-SPECT, O’Brien et al. 2007, investigated mild to moderate AD (n = 16) which were compared to HC (n = 16). The cerebellum was used as reference region to normalize the data in order to account for interindividual variability. Lower α4β2*-nAChR binding was found in AD in frontotemporal cortices, striatum and pons. Terriere et al. (2010) performed a 5-IA-SPECT study in amnestic MCI (n = 9) and HC (n = 10). SPM analysis was performed and SPECT data was scaled to cerebellum as reference region. There was reduced nAChR binding in MCI in the medial temporal cortex. Nordberg et al. (1995) found lower nAChR availability using [11C]nicotine PET in AD (n = 8) compared to HC (n = 3) in the cortical regions (frontal, temporal, hippocampal).
11.6.1 Own Data (Kendziorra et al. 2011; Sabri et al. 2008)
Parametric images of the 2-FA-DV were calculated using the Logan method, and the 2-FA-BP or 2-FA-DVR was assessed, normalizing the PET-DV data to the CC as unspecific reference region.
The major findings of these two studies were significantly lower nAChR binding in typically AD-affected brain regions in AD and amnestic MCI (pilot cohort and extended cohort) especially in the precuneus/posterior cingulate cortex, thalamus, (para)hippocampus, temporal cortex, frontal cortex and caudate nucleus. MCI were more mildly affected than AD. Of note, only MCI, who later converted to AD (MCI-C) demonstrated significantly lower nAChR binding. In contrast, MCI who were stable (MCI-S) during clinical follow-up did not show significant nAChR differences.
11.6.2 Differences and Similarities Between the nAChR PET/SPECT Studies Conducted So Far in AD
In two of the mentioned SPECT studies, Mitsis et al. (2009) and Ellis et al. (2008) did not find any differences between groups. For assessment of nAChR availability, the 2-FA-DV was calculated. The other five nAChR studies (O’Brien et al. 2007; Terriere et al. 2010; Nordberg et al. 1995; Kendziorra et al. 2011; Sabri et al. 2008) consistently find nAChR reductions, especially cortical in the cingulate cortex, frontotemporal cortices and hippocampus and also subcortical in the striatum. All these PET/SPECT studies used relative quantification normalizing the PET/SPECT data to a reference region (CC or cerebellum) in order to account for unspecific binding or interindividual variability. Furthermore, almost all nAChR PET/SPECT studies found a relationship between lower (especially) cortical nAChR binding and the degree of cognitive dysfunction in AD/MCI and HC (O’Brien et al. 2007; Terriere et al. 2010; Nordberg et al. 1995; Sabri et al. 2008; Kendziorra et al. 2011; Mitsis et al. 2009). In contrast, no correlations were demonstrated between nAChR availability in AD and cognitive symptoms by Ellis et al. (2008).
11.6.3 Possible Reasons for Discrepancies Between the Different PET/SPECT Studies
There are various possible reasons for the discrepancies between these studies. In general, PET is superior to SPECT regarding higher scanner resolution, sensitivity and specificity and allows absolute quantification of receptor availability. The negative findings of the two SPECT/PET studies (Mitsis et al. 2009; Ellis et al. 2008), however, may be mainly due to the fact that only the distribution volume was calculated to assess the nAChR availability. The relatively high amount of unspecific binding of 2-FA (and to a lesser amount of 5-IA) and interindividual variability can potentially influence data analysis and accuracy of the results. For between-group comparisons, therefore, it is favourable not only to calculate the parametric images of the DV but also to calculate the BP or DVR as the most specific measure of the α4β2*-nAChR availability (Sabri et al. 2008; Kendziorra et al. 2011). We demonstrated that the calculation of the 2-FA-BP or 2-FA-DVR using the CC as reference region is superior and more sensitive compared to another reference region, such as the cerebellum, which have been used in SPECT studies before. Since the cerebellum is not free of nAChR, it cannot be regarded as an optimal reference region. However, using the cerebellum as reference region may be helpful to account for interindividual variability when the CC cannot be assessed due to the limited resolution of SPECT (O’Brien et al. 2007; Kendziorra et al. 2011). However, discrepancies of the findings by the different study groups may also be a result of heterogeneity of (1) clinical parameters of the patient cohorts such as severity of dementia, (2) ApoE status, (3) age or (4) the relatively small number of patients in the study groups. Interestingly, it has been shown that early-onset AD has more cholinergic brain abnormalities than late-onset AD, matched for clinical and cognitive parameters (Meyer et al. 2012; Kuhl et al. 1996). Further investigation in large patient groups is required to definitely clear this controversy.
Stay updated, free articles. Join our Telegram channel

Full access? Get Clinical Tree


