Fig. 8.1
Schematic of positron decay: the unstable parent nuclei decay emitting a positron in the process. The positron travels some distance (referred to as positron range) while losing its kinetic energy through interactions with surrounding molecules before combining with an electron causing an annihilation event to occur. The annihilation results in the emission of two 511 keV photons emitted 180° apart (±0.25°)
8.1.3 Types of Events Detected by a PET Scanner
Events from coincidence detection can be categorized into three groups: trues (signal), scatter (background), and randoms (background). Figure 8.2 shows a diagram of a positron source emitting inside of a scattering medium. Ideally, during the detection process, two separate annihilation events would not overlap in time, and photons would not scatter within the body—events meeting these criteria would be considered true events. If either of the two annihilation photons undergoes a Compton scatter interaction before reaching the detector, the event is designated a scattered event. If two decays occur close in time, each contributing at least one photon to be detected, the event is considered a random. Unlike true events, which do not scatter within the body or overlap in time, scatter and random events reduce image quality by adding background signal to the image and reducing contrast.
Fig. 8.2
Types of events detected in coincidence. A true event would provide correct localization of the annihilation site; if one or both of the annihilation photons undergo Compton scatter in the tissue and change direction, the event is considered scattered; a random event occurs when two separate decays each contribute a photon to be detected
Because photons lose energy when they scatter and, in theory, there is a very low probability that two events happen at exactly the same time (within ~10−12 s), coincidence logic can perfectly distinguish all true events. The detector’s ability to perform coincidence detection is characterized by its energy resolution and timing resolution—parameters that quantify the uncertainty in measuring the photon energy and its time of arrival.
The detector works by creating an electronic pulse when a photon hits the detector. The electronic pulse is then integrated to calculate the total energy deposited. If the detected energy is not 511 keV, the event is typically discarded. Another specialized electronic circuit is used to assign a digital “time stamp” to each detected event. The time stamp is then sent to a coincidence processor, which looks for overlapping coincidences in opposing detectors. If an overlapping time stamp from another detector is found, the event is kept; if no time stamp is found, the event is discarded. A detector with perfect energy resolution and timing resolution would be able to identify all true coincidences and discard any scattered or random events; however, because of the detector’s finite resolution, this is not possible in practice.
8.1.4 Time-of-Flight PET
It is possible to measure additional parameters of the positron decay with coincidence detection when using detectors with extremely good timing resolution. A very accurate measurement of the time difference between interactions occurring in the two detectors allows for time-based information to be used to localize the event, as shown in Fig. 8.3. This technique is referred to as time-of-flight PET. The time difference (Δt), between the arrival times of the two coincidence photons, can be related to the location of the annihilation (Δx), with respect to the midpoint between the two detectors, using Eq. 8.1, where c is the speed of light:


A time difference of zero corresponds to the annihilation occurring at the midpoint. The measurement of Δt will have some uncertainty (determined by the detector timing resolution), limiting the precision of Δx. In theory, with perfect timing resolution, image reconstruction would not be needed as all events could be localized in three dimensions with the timing and spatial information from each coincidence detector. As will be discussed later, current clinical whole-body PET scanners achieve a timing resolution of ~375–600 ps, corresponding to a localization uncertainty of about 5.6–9.0 cm; a timing resolution of ~30 ps would be needed for a direct formation of the image without reconstruction. Over the last 10 years, TOF-PET/CT has vastly improved PET imaging quality and capabilities, with all commercial manufacturers offering a TOF-PET/CT scanner model.
Fig. 8.3
The time-of-flight (TOF) information measured through the recorded time difference between the two detectors is incorporated into the image reconstruction model, limiting the event localization probability along the line of response (LOR). Without TOF there is a uniform probability applied along the LOR
(8.1)
8.2 PET Instrumentation
8.2.1 Scintillation Detectors
As described earlier, a PET scanner is designed to detect antiparallel pairs of 511 keV photons originating from positron annihilations and typically consists of a ring of detectors surrounding the imaging subject. The typical role of a detector is to measure the position and energy of the incoming 511 keV photon. Since PET relies on detecting 511 keV photons that occur near in time, PET detectors also need to measure arrival times of the two coincident photons.
The standard PET detector utilizes an inorganic scintillation crystal coupled to a photosensor. The scintillation crystal converts the energy of the ionizing radiation into optical photons that are subsequently detected by the photosensor and converted into an electrical signal. The 511 keV photons interact within the scintillator primarily via photoelectric or Compton interactions and generate electron-hole pairs that transfer this energy to luminescent centers in the scintillator. The process results in the emission of many scintillation (light) photons within a very short time frame (<1 μs). Birks [14] provides a more detailed explanation of this process. An important property of the scintillator is its ability to respond proportionally to the energy deposited by the 511 keV photon, i.e., the number of scintillation photons produced is directly proportional to the energy deposited by the 511 keV photon. An ideal PET scintillator should have (i) high density and large atomic number to efficiently stop 511 keV photons with the least amount of scintillator material, (ii) the scintillation light pulse should have fast response to provide high count-rate capability and good timing resolution for rejecting random coincidences, and (iii) high light output and good energy resolution to identify the scattered photons. In addition, the scintillation material should be optically transparent, mechanically rugged, nonhygroscopic, affordable, and easy to produce. While the search for an ideal scintillator is still ongoing [15], amongst currently available scintillators, lutetium-based scintillators such as LSO and LYSO are widely used as they have the best overall characteristics. Their high density (7.1 g/cm3), high light output (32,000 photons/MeV), and fast response time (decay time = 41 ns) make them appropriate for use in PET [16].
8.2.2 Photosensors
Photomultiplier tubes (PMTs) are the most common photosensor used in scintillation PET detector designs. The PMT is used to convert the scintillation photons into a proportional electrical signal. PMTs are vacuum devices and offer excellent signal-to-noise characteristics for detecting optical photons from scintillators. They are fast, linear, stable, mature, low-noise devices having very high gain (106–107). While single-channel PMTs have been the standard photosensor used in clinical PET scanners for a long time, these PMTs do not easily permit design of a high spatial resolution detector required for small animal PET. In this scenario, multi-anode (MA) or position-sensitive (PS) PMTs and avalanche photodiodes (APD) provide viable alternatives. In a MA-PMT, a single PMT is segmented into multiple smaller channels with independent anode readout for each channel (N channels along each direction leading to a total of N2 channels). To decrease the complexity and cost associated with reading out all individual channels of a MA-PMT, a charge-resistive readout network integrated with the PMT anode outputs is sometimes used to encode the interaction position with fewer electronic channels. On the other hand, PS-PMTs utilize a 2D arrangement of cross wired anodes to readout and decode the gamma-ray interaction location. While the MA-PMT has ‘N × N’ readout channels, the PS-PMT only has ‘N + N’ readout channels. Unlike PMTs, APDs are solid-state photosensors that are compact, have high quantum efficiency, offer low gamma attenuation, and are insensitive to magnetic fields. APDs are particularly interesting, as they can be made very small and close packed, opening up the possibility of one-to-one coupling of crystal to photosensor that may be needed for developing higher spatial resolution PET detectors.
8.2.3 PET Detector Designs
The first SPECT camera designed by Hal Anger comprised of a single continuous scintillator slab viewed by an array of PMTs and position decoding performed by using a weighted centroid algorithm [17]. Some of the early large-area PET scanners borrowed the same design, albeit with a more appropriate thicker scintillator for PET (Fig. 8.4a). This design is more practical in comparison with the first PET scanners that used a one-to-one coupling scheme with a single PMT to read out a single scintillation crystal [18, 19]. Since then the major detector designs used for clinical PET have relied on using some form of light sharing to decode the gamma-ray interaction location. One approach modifies the original Anger detector to read out an array of pixelated scintillators [20] (Fig. 8.4b). The “block detector” developed in the mid-1980s [21] is another popular design that relies on coupling a scintillator block to four PMTs. Cuts are introduced in the scintillator, and the block is segmented in a careful manner to induce sharing of light between the four PMTs (Fig. 8.4c). A modified version of the block detector concept which uses larger PMTs that overlap adjoining block detectors is known as the quadrant-sharing detector [22]. Higher spatial resolution detectors required for small animal PET, on the other hand, typically utilize multi-anode or position-sensitive PMTs and APDs in a light-sharing (Fig. 8.4d) or one-to-one coupling design (Fig. 8.4e) configuration [23–29]. Each of the above detector designs has their own merits and trade-offs, but they all provide a practical technique for designing a clinical scanner. Continuous crystal detectors have lower manufacturing costs and offer continuous position sampling, but have limited count-rate capability. The one-to-one or direct coupling detector offers the best count-rate performance but requires a larger number of photosensors and readout electronics, which can increase the scanner complexity and cost. Pixelated light-sharing detectors offer a compromise between count-rate performance and cost. Current whole-body PET/CT scanners typically use pixelated detectors with 4 mm wide crystals, while small animal scanners use 1.5–2 mm wide crystals.

Fig 8.4
Illustration of commonly used PET detector designs used in clinical and preclinical PET scanner designs: (a) continuous crystal light-sharing detector, (b) pixelated light-sharing detector, (c) block detector, (d) pixelated light-sharing detector with a multi-anode or position-sensitive PMT, and (e) one-to-one coupling detector with an array of solid-state photosensors
8.2.4 PET Data Acquisition and Signal Processing
The electrical pulse produced by the PET detector undergoes signal conditioning and processing before being handled by the data acquisition system. The PMT outputs are routed to an amplifier and shaper first, before being digitized by an analog to digital convertor (ADC). Since the timing resolution is very sensitive to the scintillation pulse rise time, separate energy (slow) and timing (fast) pathways are typically employed. A sum of all PMT signals belonging to the full or some predetermined portion of the detector is used to determine event energy and time of arrival, while a weighted centroid algorithm is used to compute the interaction position of the 511 keV photon. The calculated interaction position is mapped to scanner coordinates via a pre-computed look-up table that is generated in a separate scanner calibration step. To efficiently use data acquisition transfer rates and decrease scanner dead time, coincidence detection is followed by energy thresholding (via analog or digital energy discriminators). Only coincidences depositing a predefined minimum energy (typically 300–400 keV) are handled. The position, energy, and TOF information for all valid events are stored by the data acquisition and are used later for performing data corrections and PET image generation.
8.2.5 PET System Design and Geometry
While some of the early generation PET systems made use of flat-panel detectors that were rotated around the patient to collect full tomographic data, these designs eventually evolved to using a stationary ring of detectors. Current whole-body PET scanners have an ~90 cm ring diameter and 16–22 cm axial field of view (FOV). All scanners operate in fully 3D mode and require good energy resolution to discard the scattered radiation and fast scintillators to keep up with the expected count rate in these systems. Lutetium-based scintillators like LSO/LYSO are thus attractive and preferred in current PET/CT scanners.
8.3 PET System Characteristics
8.3.1 Sensitivity
PET scanner sensitivity is defined as the fraction of positron annihilation events that are detected in the scanner. The PET scanner is essentially a photon counter, and the statistical noise is inversely proportional to the square root of the number of coincident events it detects. Hence, scanner sensitivity plays an important role in determining image noise or activity concentrations at which imaging can be performed. A high sensitivity scanner would reduce imaging time and/or permit imaging at lower activity concentration, thereby decreasing the injected activity and/or radiation dose. It would also permit dynamic scans with short-lived isotopes and repeated longitudinal studies without exaggerating concerns over administered dose. Scanner sensitivity is determined by two factors: scanner geometric coverage, also referred to as solid angle, and the scintillator stopping power and thickness. Clinical whole-body scanners use 20–30 mm long crystals with ~20 % angular coverage and typically have ~5–6 % sensitivity for a point source at the center. Small animal scanners use 10–15 mm long crystals with ~40 % scanner angular coverage and achieve typical sensitivity values in the range of ~2–7 % for a point source at the center.
8.3.2 Spatial Resolution
Spatial resolution determines the smallest structure that can be clearly visualized, and a scanner with the highest spatial resolution is necessary to resolve the finest details in an object. Two physic processes that arise from positron decay limit spatial resolution in PET scanners: positron range and annihilation photon acollinearity. The positron emitted by the radionuclide has some kinetic energy and therefore travels a short distance from the emission point before annihilating with an electron. This positron range is related to its kinetic energy; for 18F (maximum positron energy = 0.635 MeV), the root mean square value of distanced traveled in water is 0.2 mm, while for 82Rb (maximum positron energy = 3.4 MeV), it is 2.6 mm [30, 31]. Annihilation photon acollinearity arises from the conservation of momentum during the electron-positron annihilation process. Instead of being emitted at exactly 180°, there is a small deviation of ±0.25° on account of some residual kinetic energy the positron-electron pair possesses at the time of annihilation. While the deviation is small, its contribution to the spatial resolution degradation is dependent on the scanner diameter, i.e., the larger the diameter of the scanner, the larger its contribution. For whole-body PET scanners having a diameter of 90 cm, the degradation is ~2 mm, while for small animal scanners with an 18 cm ring diameter, the contribution is ~0.4 mm. In addition to the limits from fundamental positron decay physics, PET scanner spatial resolution is also dependent upon the spatial resolution of the detector. The spatial resolution in pixelated-detector designs is limited by the cross section (width) of the individual crystals used in the PET detector. While a theoretical spatial resolution of half the crystal width can be achieved (for events at the center of the scanner), the finite detector sampling over the FOV often degrades it [32]. There are additional contributions from Compton scattering of the 511 keV photon in the detector and the error in interaction position determination due to the use of light-sharing techniques in the detector. Currently clinical PET scanners for whole-body imaging have a spatial resolution in the range of 4–6 mm [33–35], while small animal scanners have a spatial resolution of 1.5–2 mm [36], both of which are primarily determined by the scintillation crystal widths used in the detector.
An additional source of spatial resolution degradation is from parallax error. Events that occur away from the center of the scanner result in the 511 keV photons no longer traveling perpendicular to the scintillator entrance face. Depending on the scintillator depth at which the 511 keV photon interacts, there is an error in determining the correct line of response (LOR). This LOR mispositioning error is known as parallax error (Fig. 8.5) and degrades the overall spatial resolution as a function of the distance from the center of the scanner. Parallax error is particularly evident in small animal scanners since they make use of small ring diameters and long crystals to improve sensitivity. Clinical whole-body scanners have ~90 cm ring diameter and ~50 cm FOV, making them less susceptible to parallax errors.

Fig 8.5
Parallax error in a PET scanner: for off-center positron annihilations, there is an error in determining the correct line of response, which degrades the overall spatial resolution of the scanner
8.3.3 Energy Resolution
Energy resolution determines the accuracy with which the scanner can measure the energy of the 511 keV photon interactions and affects the ability to reject scatter coincidences where at least one of the two 511 keV photons has incident energy <511 keV. Current clinical whole-body PET scanners using LSO/LYSO scintillators have ~12 % energy resolution that allows the use of a high event energy acceptance threshold (up to 440 keV), thereby collecting all true coincidences with a small fraction of scattered coincidences as well. The importance of energy resolution is less significant for small animal PET where object scatter from the animal is small relative to that observed in clinical whole-body imaging.
8.3.4 Coincidence Timing Resolution
Since a PET scanner relies on collecting coincident pairs of 511 keV photons, the coincidence detection mechanism is an essential component of a PET scanner. In addition to measuring the interaction location and energy, the PET detector also measures time of arrival for both the coincident 511 keV photons. The time within which coincidence pairs are identified is called the coincidence timing window (τ). A smaller τ will reduce the number of random coincidences collected by the scanner. While the time-of-arrival measurement is fundamentally limited by the timing accuracy of the detector (timing resolution), there is also the path length of the photon to keep in mind. For an annihilation occurring near one detector surface, one of the two 511 keV photon possibly needs to travel much longer before it reaches the detector. In a clinical scanner with ~90 cm ring diameter, it takes the photon ~3 ns to travel this distance. Also, depending on the scanner readout design, either of the two 511 keV photons can be detected first.
8.3.5 Count-Rate Performance
With all scanner designs, there is a minimum amount of time necessary for the scanner to process the event before it is ready to accept another event. This minimum time is referred to as “dead time” and defines the maximum rate at which the scanner can operate. A lower dead-time value (less time in processing events) translates into a higher count-rate capability. While the scanner dead time has contributions from the readout electronics and coincidence processing, it is typically the scintillator conversion process within the detector that primarily limits the overall count-rate performance. A short scintillator signal decay time will allow higher count-rate capability. LSO has an ~40 ns decay time and can provide an average count-rate capability of ~10 million counts/s. Dead time is classified as being either non-paralyzable or paralyzable. A non-paralyzable system will not accept any additional events for processing when it is busy processing an earlier event, and hence all events arriving during this time are simply lost. A paralyzable system on the other hand will process all the events as a single event, increasing the dead time as a result. Dead time arising due to readout electronic limitations is typically non-paralyzable, while scintillator dead time is paralyzable. The count-rate measurement for a scanner is characterized by plotting the measured scanner count rate with a known amount of activity in its FOV. Whatever the mechanism, a scanner with the highest count-rate capability is desirable and remains a priority for PET system designs.
8.4 Multimodality PET/CT
8.4.1 Motivation and Review of Fusion Imaging
Imaging techniques like computed tomography (CT) and magnetic resonance imaging (MRI) offer excellent spatial resolution better than 1 mm and produce exquisite three-dimensional anatomical images. They help in identifying abnormalities based on structural and anatomic changes in the body. While they are well established and are routinely used in the clinic, they provide limited or no physiological information. PET, on the other hand, can measure many different physiological parameters, such as glucose metabolism with 18F-FDG that can help differentiate between malignant and nonmalignant tissue. However, the relatively limited spatial resolution of PET makes it difficult to accurately localize such lesions, especially ones that occur in heterogeneous regions like the abdomen or at organ boundaries. To make the best use of their individual strengths, clinicians in the past viewed images acquired from both modalities separately. Differences in the system spatial resolutions, image pixel sizes, and slice thicknesses limited the accuracy with which information from both modalities could be correlated. Several techniques, such as the use of external fiducial markers and stereotactic methods, were developed to correlate the data with other image sets or to an image atlas [37]. Dedicated fusion software that performed co-registration in a semiautomatic or automatic manner was also devised [38–40]. These techniques improved co-registration accuracy, and software fusion found a larger role, especially in brain imaging, as the brain is a sufficiently rigid organ unaffected by organ motion. For whole-body imaging, these techniques were often laborious and sometimes unfeasible. The longer duration for PET imaging meant that whole-body PET images were inconsistent and their resolution affected due to patient breathing. Involuntary internal organ motion and variability/mismatch in patient positioning due to patient transfer and scanner availability constraints added to their troubles. Subsequently, software-based fusion PET/CT found limited success in routine whole-body PET.
8.4.2 Hardware-Based Multimodality PET/CT
The problems encountered by the software-based approach were addressed by a hardware approach to combine them, one that could provide a fully co-registered PET/CT image in a single imaging session. In PET/CT scanners, the PET and CT data are acquired sequentially on a common bed requiring no additional software alignment. While acquiring the two datasets with a single scanner would have been ideal, it engenders several technological challenges that need to be overcome. Apart from improving the scanner readout electronics and count-rate performance, the most important challenge lies in designing a common detector that would work efficiently for both imaging modalities. The very first multimodality nuclear-imaging scanner was designed in the early 1990s and made use of a single high-purity germanium detector to integrate CT with single-photon emission computed tomography (SPECT) [41]. While the prototype scanner demonstrated single detector feasibility, there were some performance compromises, and it was more challenging to adapt for PET/CT. As opposed to the 511 keV photons emitted by PET tracers, the most commonly used SPECT tracer, i.e., Technetium-99 (99mTc), generates 140 keV photons, close to the X-ray energies used for CT imaging (40–140 keV). The use of a single detector for a PET/CT scanner necessitates compromises for either or both modalities.
It was not until the late 1990s that the first design for a combined PET/CT scanner was presented [42]. It combined an existing partial-ring PET scanner and an existing CT scanner into a single-gantry scanner with a single bed. Independent consoles were used for scanner control, data acquisitions, and image reconstructions. The PET/CT scanner could be operated either independently (i.e., PET or CT) or in a combined mode with the CT assisting PET imaging. After image reconstruction both the images were sent to a workstation for fused viewing. During normal operation patients were scanned sequentially, first in the CT and then PET. The primary goal of the prototype was to demonstrate the value of a combined scanner providing accurately co-registered PET/CT images. Numerous studies were successfully performed with this prototype that provided sufficient proof of its diagnostic powers and also generated sufficient interest in the clinic [43–47]. Whilst the prototype scanner design was not optimized, it was a significant milestone that spurred the design of next generation PET/CT scanners. Medicare reimbursement approval for certain whole-body FDG-PET scans in 1999 provided further impetus to the utilization and popularity of PET/CT scanners.
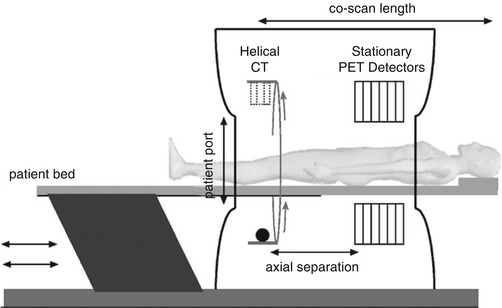
By the early 2000s there was enough enthusiasm and clinical evidence for whole-body PET that all major PET vendors began manufacturing and selling PET/CT scanners. Excluding for some variations in the gantry design from each vendor, the commercial PET/CT scanners essentially all include fixed full-ring PET and CT scanners that are melded into a common gantry housing (Fig. 8.6). The individual PET and CT scanners have minimal modifications to potentially offer full performance PET and CT scans, as if they were sold individually. There is typically a gap between the two scanner rings in order to accommodate the scanner readout electronics as well as to minimize the interference (e.g., temperature variations) from each scanner. Care is also taken to match the patient-port sizes for patient comfort. The scanner control and acquisition hardware have better integration than the first prototypes. A common patient couch that traverses the entire axial field of view (FOV) with minimum deflection is key to acquiring accurately co-registered images between the two scanners. Imaging sequences comprise of a short CT scout scan to position the patient within the FOV followed by the CT scan. At the end of the CT scan, the patient couch is translated to the PET FOV and PET imaging begins. Image reconstruction occurs on separate hardware for the PET and CT, each of which is optimized for fast image reconstruction. Proprietary dedicated software to visualize the PET and CT images as overlaid [49–52] or separate images, image analysis, and measurement tools are also provided with the scanner. Figure 8.7 shows an example image acquired with a clinical whole-body PET/CT scanner. As can be seen, the fused PET/CT image improves anatomic localization of lesion within the body.
 Regulatory Aspects of PET Radiopharmaceutical Production in the United States
 Regulation of PET Radiopharmaceuticals Production in Europe
 Clinical Applications of PET/CT in Oncology
 PET Calibration, Acceptance Testing, and Quality Control
 Role of PET/CT in Pediatric Malignancy
 Compartmental Modeling in PET Kinetics


Related posts:
Regulatory Aspects of PET Radiopharmaceutical Production in the United States
Regulation of PET Radiopharmaceuticals Production in Europe
Clinical Applications of PET/CT in Oncology
PET Calibration, Acceptance Testing, and Quality Control
Stay updated, free articles. Join our Telegram channel
Full access? Get Clinical Tree
