Fig. 1.1
Molecular formula of ICG
1.2 Optical Characteristics of ICG
The optical characteristics of ICG is shown in Fig. 1.2.
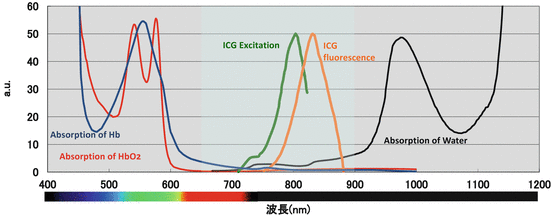

Fig. 1.2
Optical characteristics of ICG and absorption spectra of hemoglobin and water
The peak optical absorption wavelength of ICG is approximately 800 nm, with a fluorescence wavelength of approximately 810 nm in water and 840 nm in the blood. These wavelengths cannot be observed by the naked eye, while the use of video camera with high sensitivity in the near-infrared wavelength is used for measuring ICG fluorescence. The use of optical technology in the near-infrared wavelength for tissue measurement of ICG is advantageous as it can avoid the influence of autofluorescence and allow measurement of relatively deep tissues. The limitation of depth observation in human tissues is strongly related to the wavelength. For tissue measurement, hemoglobin and water are the main absorbance molecules. The optical absorption spectra of hemoglobin and water are also shown in Fig. 1.2. Hemoglobin strongly absorbs light at wavelengths shorter than 650 nm, while water absorbs light at wavelengths longer than 900 nm. The wavelength between 650 and 900 nm, termed the “optical window,” has a high transparency because of low light absorbance by hemoglobin and water. The peak excitation and emission wavelengths of ICG are 800 nm and 840 nm in the blood, respectively, which are both within the optical window. Thus, the ICG fluorescence method can be used to provide angiographic assessment of blood vessels or lymphatic vessels located relatively deep (up to 10 mm) in tissue. With respect to image quality for tissue measurement, it is necessary to consider both light absorption and scattering. In particular, adipose tissue has low optical absorption but very high scattering characteristics, which results in blurring of the fluorescent image.
1.3 How ICG Generates Fluorescence
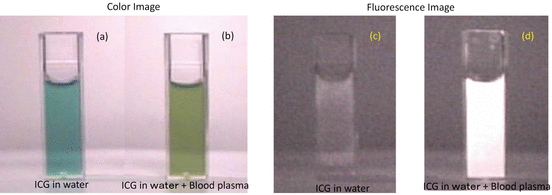
The color images (Fig. 1.3, left panel) and fluorescence images (Fig. 1.3, right panel) under conditions of ICG diluted by water (Fig. 1.3, left image) and addition of a small amount of blood plasma (Fig. 1.3, right image) are presented. ICG that has just been diluted by water exhibits an unstable and relatively weak fluorescence intensity (Fig. 1.3c). However, the fluorescence intensity increases when blood plasma is added to the ICG solution (Fig. 1.3d). A similar phenomenon occurs in human tissues, whereby an injected ICG solution immediately combines with blood plasma to generate strong fluorescence. Although ICG was originally considered to combine with albumin, it was more recently reported to predominantly bind to alpha-1 lipoprotein [2]. Yoneya et al. also demonstrated that ICG fluorescence is generated by high-density lipoprotein (HDL) and low-density lipoprotein (LDL) from blood plasma using electrophoresis and suggested that HDL is the major component involved in ICG fluorescence [3]. ICG fluorescence is also induced by dimethyl sulfoxide (DMSO), methanol (CH3OH), and ethanol (C2H6O) [4], which are easier to use than lipoprotein for creating an ICG fluorescence phantom.
