CHAPTER 23 Physics and Instrumentation of Cardiac Positron Emission Tomography/Computed Tomography
SCANNER PHYSICS
Positron emission tomography (PET) takes advantage of the unique characteristics of positron decay. A proton-rich nucleus, such as 82Rb or 18F, can eliminate its excess charge by emitting a positron, which is the antiparticle of the electron. The positron will scatter around in the body (within a millimeter or so of where the decay took place) until it meets an electron, and then they are annihilated. The annihilation converts the mass of the positron and electron into energy, in this case two 511-keV photons that travel in nearly opposite directions (Fig. 23-1). If both of these photons can be detected, then it is known that there is activity somewhere along the line between the two responding detectors. After enough of these events have been recorded, the information can be combined to form an image.
At the heart of a PET camera are scintillation detectors. A scintillation detector is a crystal that gives off many low-energy photons when a high-energy photon interacts with its molecules. The low-energy photons are collected by photomultiplier tubes, which convert them into an electronic signal. The precise time of arrival of the event and the energy of the event are recorded. This is diagrammed in Figure 23-2. The timing is critical because it is used to decide if two photons came from the same annihilation. If two photons are detected within a very short time (called the time window, typically 3 to 12 ns, depending on the type of detector used in the scanner), it is assumed that they were created from a single positron-electron annihilation that occurred somewhere on the line that connects the two recording detectors. This is called a coincident event, and the line is termed a line of response. If the time between detecting two photons is greater than the time window, the two detected events must have originated from two separate annihilations because light travels at approximately 0.3 m/ns and the scanner is only about 1 m in diameter. The primary data set from the scanner is the number of coincident events that are recorded for each line of response.
A PET camera is made by arranging detectors in a cylindrical geometry as depicted in Figure 23-3. All detectors are continually monitoring for photons. The main advantage of PET imaging over SPECT is the vastly increased count rate capability. All detectors in the PET ring are continuously monitoring for events versus a gamma camera, which uses a lead collimator to detect only events along certain projections at any given time.
There are several types of events that can be recorded in a PET scanner. The example shown in Figure 23-1 is called a true event. “True” comes from a positron-electron annihilation generating two photons that travel in opposite directions and are both recorded. This is the raw data that we desire to accurately reconstruct an image. Unfortunately, collecting data as described also results in recording of other types of events. It is possible for photons from two different positron annihilations that by random chance happen to decay within a few nanoseconds of each other to be detected in separate detectors within the time window. This situation is depicted in Figure 23-3. When this happens, there is the potential for incorrectly assuming that radioactivity is present between the two responding detectors. This type of event is called a random event because the two detectors that are involved and the time between detection of the two photons are both completely random. Random events add a uniform background to the primary data set.
The randomness in time between the two detections can be exploited to estimate the number of random events that are confounding the primary data set. The number of random events is estimated by one of two methods. The first method is the “delayed window” method. In this technique, a second data set is simultaneously acquired that includes only random events.1 The second method probabilistically calculates the number of expected random events based on the count rates in each of the detectors. In either case, the estimate is subtracted from the primary data set to produce a random corrected data set.
A multiple event is a combination of a true event and a random event as shown in Figure 23-4. By random chance, a third photon falls within the time window of a true event. When this occurs, it is unknown which pair of detectors represents the true event and which pair represents the random event. In all cases, one of the potential lines of response can be eliminated because it does not go through the imaged field of view. This leaves two lines of response, one true and one random. Both of the events are recorded. On average, the random events are corrected in the process described earlier. Recording both events and later correcting for the random yields additional information that can be used to reconstruct the image. This is as opposed to the archaic practice of ignoring multiple events because it cannot be known which two detectors recorded the true event.
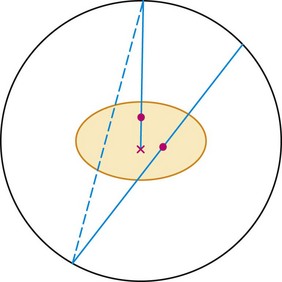
 FIGURE 23-4 Two other types of events that can occur during a PET acquisition. The straight line represents a true event as depicted in Figure 23-1. The line with the x indicates an attenuation event. One of the photons heading toward the detectors is attenuated by the body, so a coincidence event could not be recorded. This leads to an underestimate of the amount of activity in the body. This is fixed by the attenuation correction derived from the collected CT scan. If these two events happen to occur at the same time, the event is termed a multiple. In this case, it is not clear from the collected data if there is activity along the dotted or solid line. The data set is corrected for multiple events during the correction for random events.
Photon attenuation by the patient’s body leads to potential underestimation of the amount of activity in the patient. This is also depicted in Figure 23-4. Keep in mind that unless both photons are detected, no event can be recorded. It is the total amount of tissue that both photons must traverse that determines the probability of attenuation. Note that the probability of an event’s being attenuated is greater if the line of response traverses the center of the patient. On the other hand, some of the events originating at the edge of the body can reach the detectors after traversing only a small amount of tissue. Because of this, more events that originate at the center of the body are attenuated compared with the edge of the body. If this is not taken into account when images are reconstructed, the center parts of the image will be depressed (Fig. 23-5).
A scatter event is when one of the photons scatters in the patient so that the line of response between the two responding detectors does not include the location of the event (Fig. 23-6). Essentially all scattering of importance to PET is photons scattering off free electrons, called Compton scattering. When a photon scatters, it transfers some of its energy to the electron. The greater the scattering angle, the greater the energy transfer. A 511-keV photon that scatters by 30 degrees is reduced in energy to 450 keV, approximately the lower level threshold used in setting up PET detectors. Hence, if one or both of the annihilation photons scatter by less than 30 degrees, they can be recorded by the PET system. With this much scattering, a recorded event with a line of response that passes near the center of the scanner could be off by up to 10 cm. Scattering by small angles is more probable than by larger angles, so scatter affects PET images by reducing resolution and contrast.
The final type of event that needs to be considered for cardiac imaging is called a prompt gamma and is shown in Figure 23-7. This is a property of 82Rb decay that is not present with 18F. When a rubidium nucleus decays, it converts to a krypton nucleus by giving off its charge in the form of a positron. A significant fraction of the time, the krypton is in an excited state and almost immediately gives off another gamma ray. This is a situation that looks very much like the multiple event depicted in Figure 23-4, but there is a significant difference. The prompt gamma event is not random. The annihilation photons and the prompt gamma all are generated from a single decay process. In this case, the true and random events are correlated in time, that is, they happen at the same time. (Actually, the prompt gamma can be delayed by a few picoseconds, but this extremely small time is insignificant compared with the duration of the time window.) Compared with a multiple event, the random is equally likely to occur at any time.
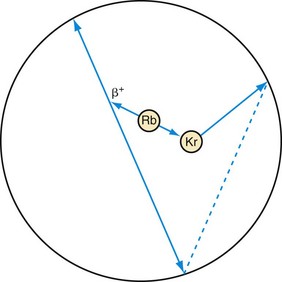
 FIGURE 23-7 Prompt gamma event. This type of event can occur in scanning with rubidium (Rb). Rubidium decays to an excited state of krypton (Kr), which gives off its excess energy in the form of a photon. If all three of these photons are detected, the event has the appearance of a multiple event (see Fig. 23-4). The difference is that one event precipitated all three photons as opposed to the two decays that just happened to occur at the same time in Figure 23-4. Hence, there is no randomness in the timing between these photons, so a conventional correction for random events will not remove them from the data set. A separate prompt gamma contamination estimate must be performed to account for these events before an image is reconstructed.
PET Detectors
All of the different types of events need to be accounted for in image reconstruction. The first defense against the confounding types of events is the detector itself. There are several different types of detector materials (Table 23-1). The three main characteristics for the detector material in PET are the stopping power, energy resolution, and time resolution. The greater the stopping power, the less detector material is needed to stop one of the annihilation photons. This is important for economic and image quality reasons. The detector material is the dominating cost of a scanner, so it pays to have higher stopping power material. It can also lead to better images. If a photon is detected in a smaller detector, the line of response is better defined, which leads to better images. Finally, for detectors of equal size, the one with the higher stopping power is more likely to record the event, leading to a higher sensitivity scanner and, again, better images.
In many of the preceding diagrams, it appears as if the PET scanner is a ring of detectors within a single plane. Historically, this was the case. A volumetric PET scanner was built by stacking a set of independent detector rings to make a scanner. At some point, it was realized that if the detected events are limited to those occurring only within a plane, the number of detected events will be many times less than it could be. On the other hand, it takes much more computer memory and processing power to reconstruct images when nonplanar events are also included. The computing threshold was passed around 1999, and in modern scanners, the acceptance of events is opened up so that any pair of detectors can record an event. This is depicted in Figure 23-3.
Conversion of CT Images to PET Attenuation Maps
Direct scaling assumes a linear relationship between CT and PET attenuation. This is a good assumption in low-density tissues such as lung and soft tissue. Bone is an exception because its CT attenuation is dominated primarily by photoelectric contributions. Therefore, the linear relationship depends on the effective energy of the CT scan. So, an appropriate calibration curve needs to be a combination of two or more linear curves that cover the range of attenuation commonly found in the body. A bilinear relationship is a common conversion technique used in PET/CT scanners (Fig. 23-8).
CT data are collected at higher resolution (typically 1- × 1- × 1-mm voxels) than are PET data (typically 6- × 6- × 6-mm voxels), requiring the converted CT image to be down-sampled to the PET image matrix size and smoothed with an appropriate kernel to match the PET resolution (Fig. 23-9). The attenuation map data are then used to correct the emission data.
Attenuation Mismatch
Motion of the Patient
Voluntary motion of the patient commonly occurs in response to discomfort experienced during long imaging scans. A motion event may occur between the CT and PET acquisition or, more commonly, during the PET study. Intra-scan motion is evident by mismatched boundaries and uptake in regions not normally associated with perfusion or increased metabolism (Fig. 23-10). Motion during a scan appears as blurred edges and loss of anatomic detail (Fig. 23-11).
Respiratory and Contractile Cardiac Motion
In dedicated PET systems, the long transmission time required for rotating radionuclide transmission sources around the body provides good respiratory and cardiac temporal averaging as is present in the emission scan. With the introduction of CT for attenuation correction, respiratory and contractile cardiac motion has considerably greater potential to unduly influence the attenuation correction because a fast helical CT scan fails to account for the time averaging observed in the emission acquisition (Fig. 23-12). As a result, the reported frequency of registration errors between the transmission and emission sequences has increased dramatically from dedicated PET systems2 to PET/CT hybrid systems.3
Drift of Thoracic Contents
Drift of the thoracic contents, such as slow continuous movement of the heart, occurs in response to changes in the patient’s state, such as changes in lung volume as a result of the introduction of a pharmacologic stressing agent.2 Misregistration caused by this mechanism is commonly observed as cardiac uptake overlying the CT lung field (Fig. 23-13). Furthermore, even in the presence of good respiratory averaged transmission data, drift of thoracic contents is still prevalent and is a main factor along with motion of the patient leading to registration errors in approximately one quarter of clinical perfusion studies. Given the nature of its mechanism, motion of the patient often cannot be accounted for by altering the transmission protocol and therefore requires that a post-reconstruction image registration method be available.
Attenuation Correction Protocols
Correction schemes to address the motion problem in the thorax have concentrated on gating techniques in the PET/CT acquisition and blurring or averaging of the transmission data.4 The first method uses either prospective (sinogram mode) or retrospective (list mode) gating of the respiratory and cardiac cycles. The respiratory cycle is normally monitored by use of a bellows, chest band, or infrared tracking system, of which the sinusoidal phase is then divided into a predetermined number of bins, commonly 10. Monitoring of the cardiac cycle is performed with an electrocardiograph; the phase is similarly divided into a preset number of bins between successive R–R waves, commonly eight bins. The data can then be binned into a two-dimensional histogram and reconstructed into separate image volumes of any cardiac-respiratory phase combination that matches the CT phase collected. The disadvantage of this technique is that the collected prompt events are distributed into many separate images (~80), and reconstruction of a single image results in poor quality because of the low number of counts. Therefore, multiple gates are often added together to improve image quality at the sacrifice of motion-free image information. These multiple gating techniques are achievable on PET/CT systems, but there are limited software resources capable of efficiently processing these events.
A second approach to matching PET emission and CT transmission data is blurring or averaging of the CT data to match the averaged nature of the PET study. This approach is referred to as time-averaged CT and has been explored more extensively because the protocols employed are used routinely in stand-alone cardiac CT units. Time-averaged CT protocols have been proposed in place of a breath-hold because they permit the patient to be scanned under free-breathing conditions (see Fig. 23-12B&C). The motivation is that the free-breathing state provides a more accurate representation of attenuating structures present in the emission examination. One method for obtaining a time-averaged CT scan is use of a low-pitch helical protocol whereby data are collected at a pitch of 0.5 or lower. This approach increases the axial sampling, which suppresses motion artifacts and results in blurring when linear interpolation algorithms are used in the reconstruction. In this case, the cardiac and respiratory phases are spread along the axial direction (see Fig. 23-12B).5 A second method is collecting an average CT by successive cine mode acquisitions (also referred to as sequential), whereby multiple images are collected over one or more breath cycles at a single bed position. The table is then stepped to the next position, and acquisition resumes. This sequence is repeated until the entire chest cavity is covered. The multiple image data are then averaged at each bed position and interpolated to the PET slice thickness for attenuation correction (see Fig. 23-12C).6
Stay updated, free articles. Join our Telegram channel

Full access? Get Clinical Tree


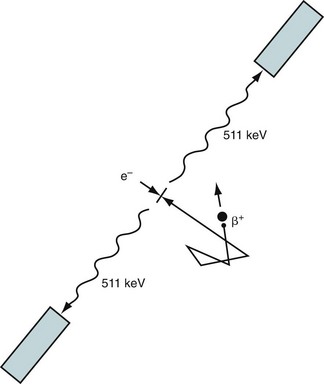
 FIGURE 23-1
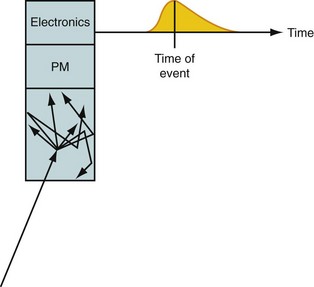
 FIGURE 23-2
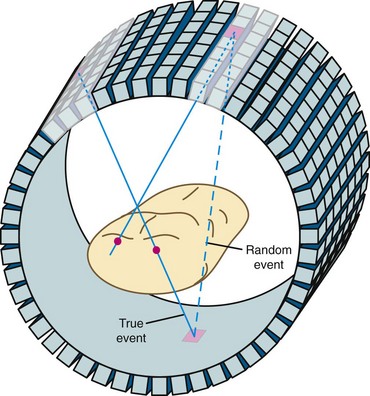
 FIGURE 23-3
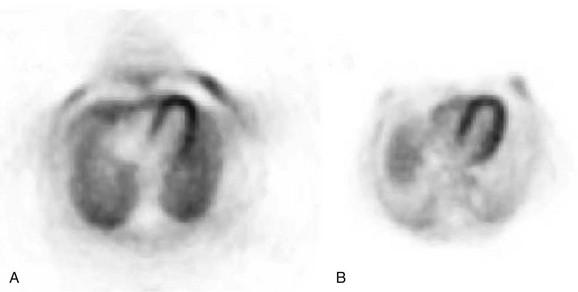
 FIGURE 23-5
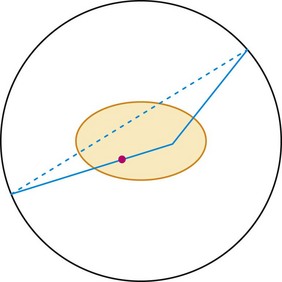
 FIGURE 23-6
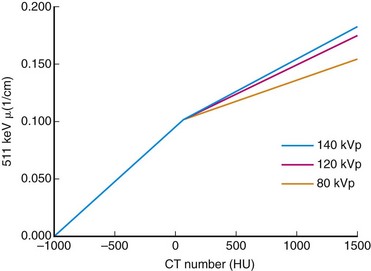
 FIGURE 23-8
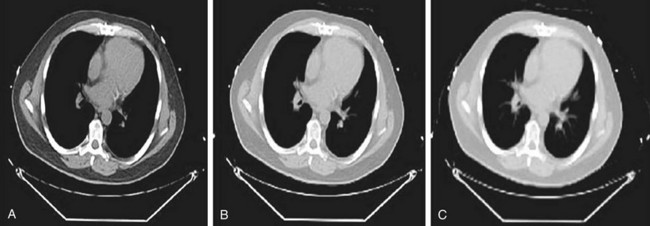
 FIGURE 23-9
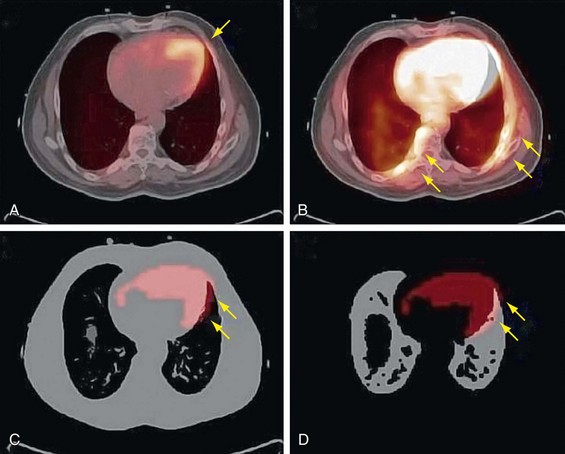
 FIGURE 23-10
 FIGURE 23-11
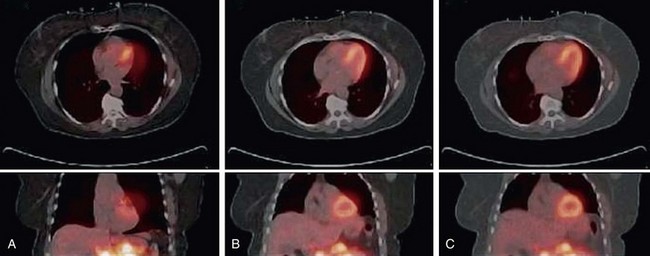
 FIGURE 23-12
 FIGURE 23-13