Physics
Norman McDicken
Tom Anderson
This chapter provides an introduction to the physics of medical ultrasound (US). Several books exist that can be consulted to extend the material presented here.1,2,3,4 Values are quoted for physical quantities related to ultrasound in tissues, such as speed of sound and attenuation. This will enable a better qualitative and quantitative understanding of musculoskeletal scanning. A detailed knowledge of these quantities is not required; indeed, it is often not available, but a working knowledge helps in the production and interpretation of ultrasound images and Doppler blood flow measurements. Some knowledge of the physics is also helpful for an appreciation of safe usage. However, safety is not a major concern in musculoskeletal work since most tissues examined are not sensitive to ultrasound energy of the levels encountered in clinical scanning.
ULTRASOUND
Ultrasound Propagation
Ultrasound vibrations are generated by a very small rapid push-pull action of a transducer held against a medium such as tissue. The ultrasound then passes through (“propagates” through) the tissue. A transducer converts electrical signals to ultrasound vibrations for transmission and conversely for detection. The vibrations are so small that they cannot be observed by eye. Vibration rates of a pitch too high to be heard by the human ear are called ultrasound. Vibration rates in the range 1,000,000 to 50,000,000 cycles per second are found in different applications of medical ultrasound. The term “frequency” is employed rather than vibration rate, and the unit is hertz (Hz) rather than cycles per second. Frequencies in the range 5 to 15 megahertz (MHz) are used in musculoskeletal ultrasound.
In medicine, ultrasound is transmitted when one or more piezoelectric crystals (element) in a transducer are driven to vibrate by an applied fluctuating voltage. Ultrasound is detected when vibrations strike a piezoelectric crystal, producing a small voltage signal across it. That the same piezoelectric crystal can generate large amplitude vibrations and detect extremely small ones has been central to the development of medical ultrasound technology. Piezoelectric properties occur naturally in some materials, for example, quartz, but today specially developed ceramics are employed. Medical ultrasound scanners often generate short bursts (pulses) of vibration, for example, each of three or four cycles in duration. Figure 2.1 illustrates pulsed and continuous ultrasound. For a continuous wave (CW), an alternating (oscillating) voltage is applied continuously, whereas for a pulsed wave (PW) it is applied for a short time. As the ultrasound from the transducer travels through the subject, echoes are generated by reflection or scattering of the transmitted ultrasound at changes in tissue structure within the body. The returning low-amplitude echoes are used to create images of these structures.
The vibration of the transducer elements, a push-pull action, causes regions of compression and rarefaction to pass from the transducer face into the tissue. A waveform can be drawn to represent these regions of increased and decreased pressure (Fig. 2.2). The distance between equivalent points on the waveform is called the wavelength, and the maximum pressure fluctuation is the wave amplitude (Fig. 2.3). Waves or wavefronts are said to have been transmitted from the transducer face. They can be focused by making the transducer face concave or by attaching a lens to it, but focusing is much more commonly achieved electronically by driving a large number of elements at slightly different times.
Ultrasound waves pass through tissue at very high speed, around 1540 m per second for most soft tissues. This is extremely useful since pulses can be transmitted and echoes collected in a fraction of a millisecond after
the instant of transmission and hence many images can be produced in a second. If 50 images are presented per second, the frame rate is said to be 50 per second. The speed of sound is simply related to the frequency and the wavelength by the formula:
the instant of transmission and hence many images can be produced in a second. If 50 images are presented per second, the frame rate is said to be 50 per second. The speed of sound is simply related to the frequency and the wavelength by the formula:
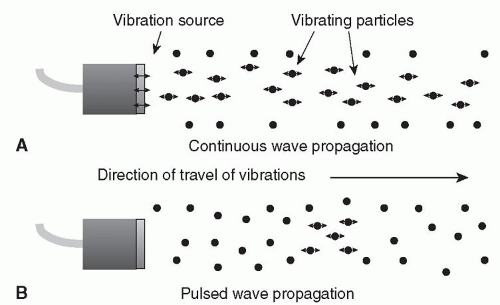 Figure 2.1. The generation of continuous (A) and pulsed wave (B) ultrasound by a vibrating source in contact with a propagating medium. |
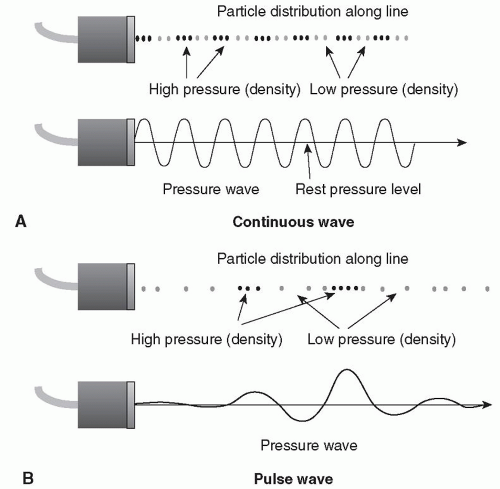 Figure 2.2. Waveform patterns related to pressure variations in ultrasound fields (A) Continuous wave, (B) Pulsed wave. |
c = f-λ
where c is the speed of sound, f is the frequency, and λ is the wavelength.
In most ultrasound waves used in medicine, oscillations of the particles of the medium are in the same direction as wave travel. Such waves are called longitudinal or compressional waves since they give rise to regions of increased and decreased pressure. Waves in which oscillations are perpendicular to the direction of travel, like ripples on a pond, are called transverse or shear waves. At megahertz frequencies, shear waves are rapidly attenuated in tissue and fluids and hence are not used at present in medical ultrasound. Developments at lower frequencies aim to utilize them in elastography (see later).
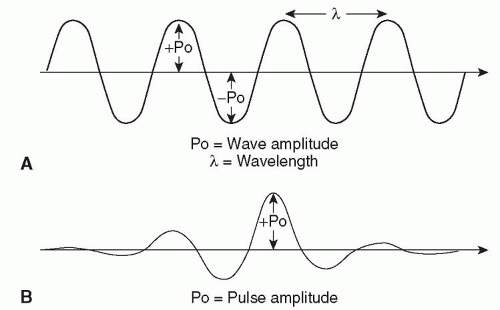 Figure 2.3. Definition of ultrasound wavelength and amplitude (A) Continuous wave, (B) Pulsed wave. |
TABLE 2.1. Speed of Ultrasound (m/s) in Tissue | ||||||||||||||||||||||
|---|---|---|---|---|---|---|---|---|---|---|---|---|---|---|---|---|---|---|---|---|---|---|
|
Speed of sound in a material depends on its rigidity and density (Table 2.1); the more rigid a material, the higher the speed. Diagnostic instruments measure the time of echo return to the transducer after the instant of pulsed ultrasound transmission and then use the average speed to convert this time into the depth in tissue of the reflecting structure. For a mixture of soft tissues along the pulse path, an accurate measure of depth is obtained by assuming an average speed of 1540 m per second for conversion of time into depth. As noted later, the speed of sound in bone can cause severe problems due to refraction of ultrasound. If possible, bone is best avoided during ultrasound examinations. The speed of ultrasound in tissues is independent of frequency over the diagnostic range, that is, 1 to 50 MHz.
Tip:
Ultrasound is vibration of frequency (pitch) above that which can be heard by the human ear.
Ultrasound is high-frequency vibration that travels through tissue at high speed, close to 1540 m per second in soft tissue.
The frequency range used in musculoskeletal applications is 5 to 15 MHz.
Ultrasound vibration travels as a pressure waveform.
Ultrasound can be generated and detected by piezoelectric crystals contained in small handheld transducers.
Echoes produced by reflection of transmitted ultrasound pulses at tissue interfaces are the basic source of information in diagnostic ultrasound.
Ultrasound Intensity and Power
When vibrations travel into tissue, energy passes from the transducer to the tissue. The intensity at a point in the
tissue is the rate of flow of energy through unit area at that point (Fig. 2.4); for example, the intensity may be 100 mW per cm2. The region of tissue in front of the transducer subjected to the vibrations is referred to as the ultrasound field or beam. For safety studies, intensity needs to be precisely defined. For a PW beam, ISPTA is the intensity at its spatial peak (often the focus) averaged over time, and ISPPA is the intensity at the spatial peak averaged over the pulse length. Intensities are not used in routine scanning, but it is useful to know their definitions when the safety literature is being considered. Later we will consider two quantities of interest to optimize safety: thermal index (TI) and mechanical index (MI). The energy of a pulsed or continuous wave is related to amplitude. It is not a quantity that is widely used in clinical practice.
tissue is the rate of flow of energy through unit area at that point (Fig. 2.4); for example, the intensity may be 100 mW per cm2. The region of tissue in front of the transducer subjected to the vibrations is referred to as the ultrasound field or beam. For safety studies, intensity needs to be precisely defined. For a PW beam, ISPTA is the intensity at its spatial peak (often the focus) averaged over time, and ISPPA is the intensity at the spatial peak averaged over the pulse length. Intensities are not used in routine scanning, but it is useful to know their definitions when the safety literature is being considered. Later we will consider two quantities of interest to optimize safety: thermal index (TI) and mechanical index (MI). The energy of a pulsed or continuous wave is related to amplitude. It is not a quantity that is widely used in clinical practice.
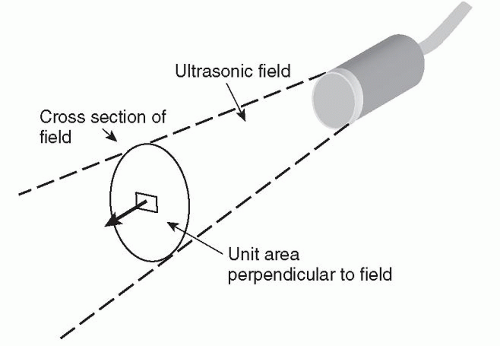 Figure 2.4. Power is the rate of flow of energy through the whole cross section of the field. Intensity at a point is the rate of flow of energy through unit area perpendicular to the field at that point. |
The power output of a machine is the rate of flow of energy through the cross-sectional area of the field (Fig. 2.4). The output power is related to possible biological effects, due to heating. Effects may also be due to cavitation, which is the violent response of bubbles when subjected to the pressure fluctuations of an ultrasound wave. The TI and MI are related to heating and cavitation, respectively, and are displayed on screen.
Ultrasonic intensity is normally measured with a hydrophone, a small probe containing a piezoelectric element. Ultrasonic power is measured with a radiation pressure balance whose pan is placed in the beam. Associated with the flow of energy in a beam there is a flow of momentum. When this momentum is interrupted by the pan, a force is experienced that is directly related to the power of the beam. This radiation force is small, for example, 0.135 mg per mW. Later it will be seen that radiation force is employed to generate shear waves in an elastography technique designed to measure tissue elasticity.
Tip:
The ultrasound field or beam is the region in front of the transducer that is affected by the transmitted vibration.
The vibration produced by the transducer is a flow of energy through the tissue.
Intensity and power are related and are of particular interest with regard to safety.
Radiation force is experienced when the transmitted energy strikes a target and is reflected or absorbed.
Diffraction
Diffraction is the spreading out of a wave as it passes through a medium. The pattern of spread depends on the size of the source relative to the wavelength. The diffraction pattern of a disc-shaped crystal as found in basic transducers is approximately cylindrical for a short distance, after which it diverges at a small angle (Fig. 2.5). The diffraction pattern from a small element of an array transducer is divergent at a large angle from close to the transducer (Fig. 2.6A). A diffraction pattern may exhibit fluctuations in intensity, particularly close to the transducer. Diffraction also occurs beyond a small obstacle or a slit aperture (Fig. 2.6B). The narrowness of a beam or the sharpness of a focus is determined by diffraction. The small wavelengths of high-frequency ultrasound enable the generation of well-focused beams. This is one of the most important facts in medical ultrasound technology. The higher the frequency, the narrower the beam, and hence finer detail is achieved in an image. Absorption increases with frequency, which puts an upper limit on the frequency that can be used.
Interference
Interference of waves results when two or more waves overlap as they pass through the propagating medium.
The resultant wave pressure amplitude at any point is determined by adding the pressure amplitudes from each wave at the point (Fig. 2.7A). When waveforms are in step, they add to produce constructive interference, giving an increase in amplitude. Out of step they add destructively, resulting in a lower amplitude (Fig. 2.7B).
The resultant wave pressure amplitude at any point is determined by adding the pressure amplitudes from each wave at the point (Fig. 2.7A). When waveforms are in step, they add to produce constructive interference, giving an increase in amplitude. Out of step they add destructively, resulting in a lower amplitude (Fig. 2.7B).
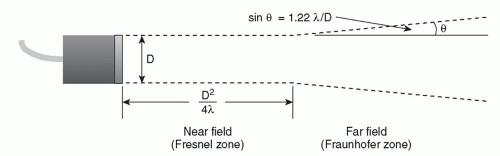 Figure 2.5. Idealized field for a disc-shaped source generating a continuous wave. |
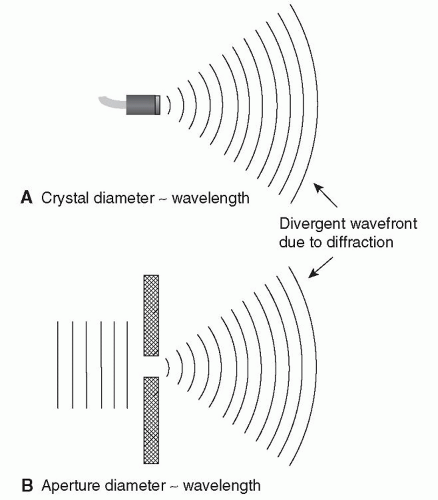 Figure 2.6. Diffraction of ultrasound from (A) a small source or on passing through (B) a small aperture. |
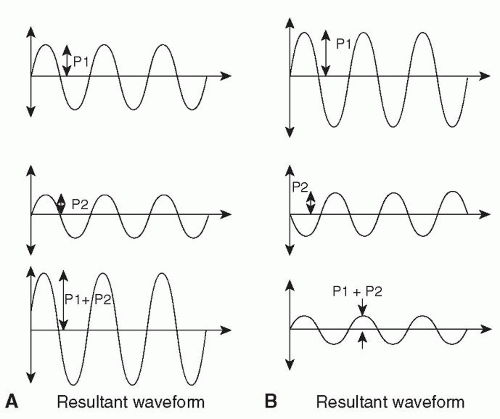 Figure 2.7. Examples of (A) constructive and (B) destructive interference. |
Image Speckle
Small echoes from tissue overlap and interfere, both constructively and destructively, to produce a fluctuating resultant signal at the transducer (Fig. 2.8A,B). The transducer signal is presented in the display as fluctuations in gray shades. The resultant tissue image is a speckle pattern. In practice, overall image speckle is often a combination of “true speckle” from very small parenchymal tissue structures and “coarser speckle” from bigger, more distinct echoes from structures such as small blood vessels or muscle fibers. The “true” speckle does not depict the very small tissue structures, but is the result of their echoes interfering. The overall speckled appearance of an image may help to identify a tissue and its state. The patterns generated by muscle, tendon, and nerve are examples of this. Comparison of speckle patterns between machines is problematic, as transducer design and signal processing affect the pattern. Tissue motion may be measured by tracking the speckle pattern, for example, in myocardial velocity imaging or elastography.
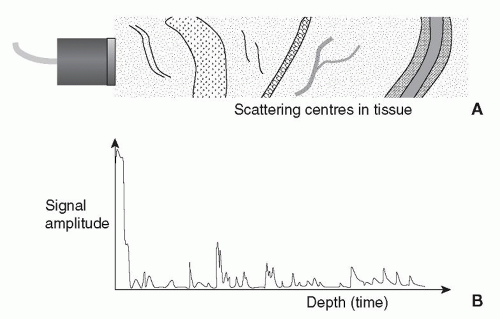 Figure 2.8. The fluctuating echo pattern produced by large and small structures lying along the beam. |
The true speckle image of blood can be observed with a sensitive high-frequency B-mode scanner. The complex pattern relates to the motion of cells or groups of cells.
Frequency (Fourier) Analysis
When two waves or signals overlap, the resultant wave pattern has a shape different from either of the two original waves (see Interference section). If two or more waves of different frequencies overlap, complex resultant waveforms can be produced (Fig. 2.9A-C). The opposite process of breaking a complex waveform down into its frequency components is called frequency or Fourier analysis. A CW of pure sinusoidal shape has one frequency component (Fourier component). A pulse has a range of frequency components, its bandwidth (Fig. 2.10). A transducer is able to handle a specific range of frequencies (the transducer bandwidth). Frequencies outside this range are lost to further processing. A Doppler blood flow signal is often analyzed into its frequency components since they relate directly to the velocities of blood cells (see Spectral Doppler).
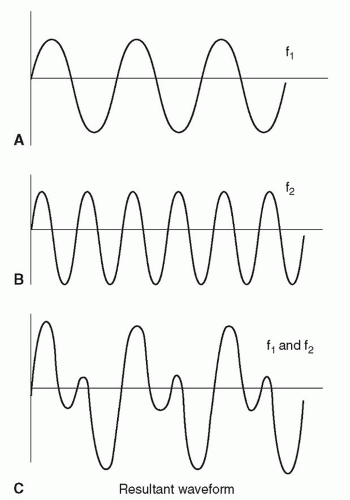 Figure 2.9. Overlapping signals of different frequencies producing a complex signal. |
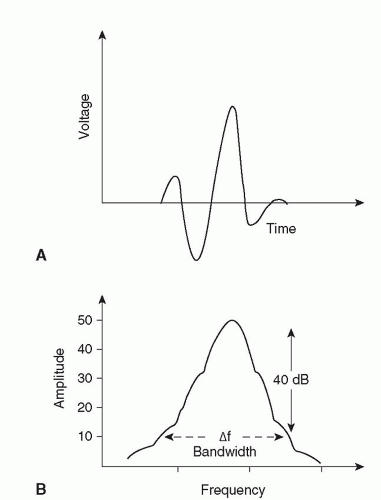 Figure 2.10. A: A short pulsed signal. B: The spectrum of frequencies in the pulse and the pulse bandwidth. |
Resonance
When a wave bounces around within a structure, there can be a buildup of wave amplitude (resonance) due to interference if the dimensions of the structure are simply related to the wavelength. Piezoelectric transducer elements are made equal in thickness to one half of the wavelength of the desired operating frequency. This gives efficient generation and detection of ultrasound. Continuous wave Doppler transducers have little or no damping and resonate at their operating frequency. Imaging and pulsed wave Doppler transducers have some damping, which spreads their sensitivity over a frequency range; that is, they have a wide bandwidth. Another interesting example is microbubbles of a particular size resonating in an ultrasound field. This resonance is exploited to improve their detection in blood when they are used as contrast agents.
Tip:
Waves diffract and interfere. At high frequencies, and hence small wavelengths, diffraction can be controlled to produce directional beams.
High frequencies produce narrow beams.
Image speckle is produced by interference of echoes from small structures within tissue.
Complex waveforms (ultrasonic or electronic) can be broken down into frequency components. Frequency analysis is a very powerful technique for characterizing signals.
The frequency spectrum of a signal is important when Doppler blood flow detection is employed.
Resonance can occur when ultrasound is reflected internally in a structure in which the dimensions are some multiple of the wavelength.
Resonance is commonly encountered in transducer crystals and microbubbles.
IMAGING TECHNOLOGY
Transducers
The transducer most suited to a particular application is chosen at the start of an examination, usually by referring to the literature. The highest frequency that will give the required tissue penetration is selected. The size and shape are chosen to couple well with the patient surface and provide good acoustic access to the site of interest. Figure 2.11 shows transducer shapes. Linear arrays are most commonly employed in musculoskeletal work. It is worth noting that modern transducers contain many active elements, for example, 256, which are under computer control during both transmission and reception. Computer control also governs both focusing and steering of the beam. Indeed, several beams may be manipulated simultaneously, provided there is clarity as to the
sources of echoes. As mentioned earlier, the piezoelectric property exhibited by the elements is very well-suited to transmitting large pulses and then switching quickly to receive weak echoes.
sources of echoes. As mentioned earlier, the piezoelectric property exhibited by the elements is very well-suited to transmitting large pulses and then switching quickly to receive weak echoes.
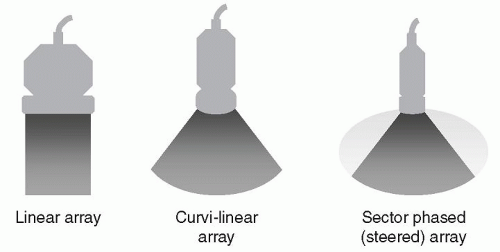 Figure 2.11. Common transducers and fields of view employed in musculoskeletal scanning. |
Basic 2D B-Mode Imaging
To produce an image, a very short ultrasound pulse, say of length 0.5 mm and frequency 10 MHz, is transmitted along a narrow beam into the body. The beam may be regarded as the acoustic analogue of a light beam of width 1 mm from a small torch, which can be directed along different paths through the tissue. When a pulse passes through small or large discontinuities within the tissue, echoes are produced, which travel back to the transducer, where they are converted into electronic signals for the production of an image. In addition to echoes, two further pieces of information are required, namely, the beam direction and the return time of each echo after the instant of transmission. Using these times and the known speed of sound in tissue, the distance along the beam of each discontinuity can be calculated. Using a number of beam directions in a 2D plane, say 128, echo information (position and echo amplitude) can be presented in the appropriate pixels on the image display (Fig. 2.12). Beam directions are determined by using neighboring groups of elements (say 16 at a time) across the transducer face. Different echo amplitudes are presented in different shades of gray, which can be related to the magnitude of the tissue discontinuities that produced the echoes. Since the speed of ultrasound is very high (1540 m per second), echo information is gathered rapidly, allowing many images to be presented per second, for example, at frame rates of 100 per second. At such high frame rates, tissue motion can be observed in the image and the scanning is said to be performed in real time. The small size of the transducer and the realtime nature of the images make ultrasound well-suited to examinations involving patient manipulation. The effects on the images of some physical processes such as attenuation, reflection, refraction, scattering, and nonlinear propagation are discussed later to provide a fuller understanding of the generation of image data and the factors that are relevant for image interpretation.
Related posts:
Stay updated, free articles. Join our Telegram channel

Full access? Get Clinical Tree


