Plain Film and High-resolution Computed Tomographic Assessment of Diffuse Infiltrative Lung Disease


Plain Film and High-resolution Computed Tomographic Assessment of Diffuse Infiltrative Lung Disease


W. Richard Webb


Diffuse infiltrative lung diseases (DILDs) may be acute or chronic, involving the interstitium, alveolar spaces, or both. Specific DILDs are discussed in other chapters in this book. This chapter reviews the radiographic and high-resolution computed tomography (HRCT) diagnosis of DILDs, including important findings and the differential diagnosis of various patterns of disease. Airways disease and emphysema, although diffuse lung diseases, are not considered DILDs and are discussed in Chapters 23 and 24.


PLAIN RADIOGRAPHIC ASSESSMENT OF DIFFUSE INFILTRATIVE LUNG DISEASE

On plain radiographs, infiltrative diseases usually are classified according to the pattern of abnormality they produce. There are six basic patterns:


  • Air-space or alveolar consolidation


  • Linear or septal


  • Reticular


  • Nodular


  • Reticulonodular


  • Ground-glass opacity


Air-space or Alveolar Consolidation

The terms air-space consolidation and alveolar consolidation refer to diseases associated with pathologic filling of alveoli (i.e., replacement of alveolar air) as the predominant abnormality. As discussed in detail in Chapter 2, radiographic abnormalities indicating the presence of air-space or alveolar disease include (1) confluent or homogeneous opacities obscuring vessels, (2) air bronchograms, (3) ill-defined or fluffy opacities, (4) air alveolograms, (5) “acinar” or air-space nodules, (6) preserved lung volume, and (7) a tendency for opacities to extend to pleural surfaces.

The differential diagnosis of diffuse air-space consolidation is reviewed in detail in Chapter 2 and Table 2-1. Alveolar filling may be caused by


  • Water (e.g., pulmonary edema)


  • Blood (e.g., pulmonary hemorrhage)


  • Pus (e.g., pneumonia)


  • Cells (e.g., bronchioloalveolar carcinoma, lymphoma, eosinophilic pneumonia, organizing pneumonia (also known as bronchiolitis obliterans or BOOP), hypersensitivity pneumonitis, interstitial pneumonia)


  • Other substances (e.g., lipoprotein in alveolar proteinosis, lipid in lipoid pneumonia)


Linear or Septal Pattern

A linear pattern is defined by the presence of Kerley’s A or B lines. Kerley’s A and B lines result from thickening of interlobular septa; this pattern also may be referred to as septal (Table 10-1).

Kerley B lines are most common (Fig. 10-1). They are horizontal lines, 1 to 2 cm in length. They are seen in contact with the pleural surface and are best seen laterally at the costophrenic angles. The characteristic appearance of Kerley B lines results from the consistent size and regular organization of pulmonary lobules at the lung bases.


TABLE 10.1 Linear or Septal Pattern: Differential Diagnosis


Pulmonary edema (hydrostatic most common), typically symmetric


Lymphangitic spread of neoplasm, often asymmetric


Chronic or recurrent pulmonary hemorrhage and hemosiderosis


Pulmonary fibrosis (sarcoidosis most common)


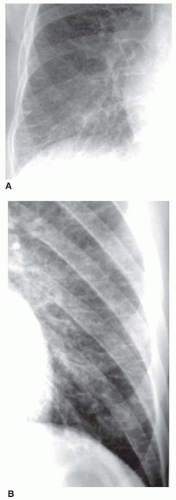
FIG. 10.1. Kerley B lines. Coned-down views of the right (A) and left (B) lateral costophrenic angles in two different patients with cardiogenic interstitial pulmonary edema. Thin horizontal lines in the lung periphery represent Kerley B lines. These represent thickened interlobular septa.

Kerley A lines are seen less often. They are oblique in orientation, several centimeters in length, and are located within the central or parahilar lung. Kerley A lines (Fig. 10-2) also represent thickened septa, but their appearance is different from that of B lines because of the different arrangement of pulmonary lobules in the parahilar lungs.


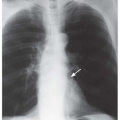
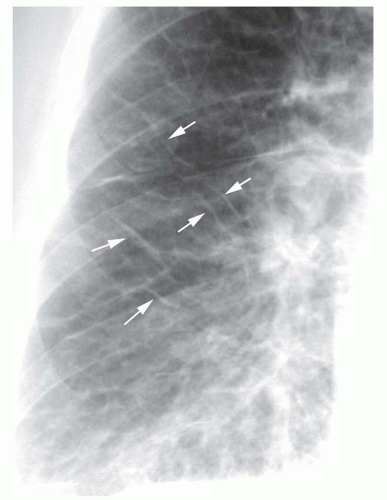
FIG. 10.2. Kerley A lines. A patient with pulmonary edema associated with fluid overload shows multiple Kerley A lines. Thin oblique lines in the parahilar lung (arrows) represent A lines. Thickening of the minor fissure also is seen.

Kerley C lines are seen at the lung bases and represent interlobular septa en face rather than in profile. They result in a nonspecific, reticular pattern and are unimportant in diagnosis, because B lines invariably are visible as well.

Peribronchial cuffing results from thickening of the peribronchovascular interstitium and also contributes to a linear pattern. This abnormality is seen as thickening of end-on bronchi or as lines radiating outward from the hila. To some extent, peribronchial cuffing contributes to the appearance of Kerley A lines on chest radiographs.

Well-defined and easily recognized Kerley’s lines are indicative of interstitial lung disease and have a limited differential diagnosis. They are typical of interstitial pulmonary edema and lymphangitic spread of carcinoma. Edema usually is symmetrical. Lymphangitic spread often is asymmetrical; asymmetrical Kerley’s lines strongly suggest lymphangitic spread of carcinoma.

Although consolidation may be seen with any type of pulmonary edema (e.g., hydrostatic, increased permeability with or without diffuse alveolar damage, or mixed), a septal pattern more often represents hydrostatic edema or increased permeability edema occurring in the absence of diffuse alveolar damage (see Chapter 11).

A septal pattern also can result from chronic or recurrent pulmonary hemorrhage and hemosiderosis.

Pulmonary fibrosis sometimes can result in well-defined Kerley’s lines, but a reticular pattern is more typical. Kerley’s
lines in patients with fibrosis are seen most commonly in patients with sarcoidosis.


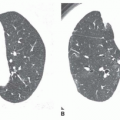
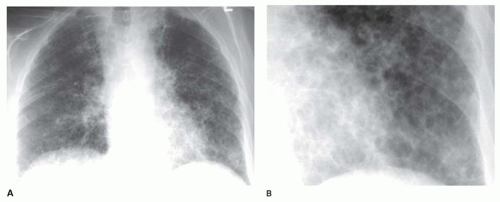
FIG. 10.3. Reticular pattern in rheumatoid lung disease. A: Chest radiograph shows decreased lung volumes and irregular reticular opacities at the lung bases. Kerley B lines are inconspicuous. The lines appear to outline spaces 1 cm or less in diameter, representing a medium reticular pattern. B: Coned-down view of the left lower lobe in the same patient shows the irregular reticular pattern.


Reticular Pattern

“Reticular” means “netlike,” which is an excellent description of the appearance of this pattern. A reticular pattern is characterized by multiple intersecting lines, often irregular in appearance, outlining round or irregular spaces (Fig. 10-3). Although a few Kerley lines may be visible, they do not predominate (if they did, the pattern would be linear). A reticular pattern indicates the presence of interstitial lung disease (Table 10-2).

The reticular pattern has been subdivided into three subpatterns, based on the size of the “spaces” surrounded by lines: a fine pattern (spaces smaller than 3 mm; Fig. 10-4), a medium pattern (spaces 3 to 10 mm; Fig. 10-5), and coarse pattern (spaces larger than 10 mm; Fig. 10-6). It should be kept in mind, however, that the size of the spaces visible on chest radiograph do not necessarily reflect the presence or size of the spaces present pathologically. Superimposition of the reticular opacities often confuses the picture; in the presence of extensive reticulation, the outlined spaces usually appear smaller than they really are (see Fig. 10-4). Medium or coarse patterns are the most common and the most easily seen on chest radiographs.

A medium pattern is typical of patients with pulmonary fibrosis and “honeycombing”; the reticulation often appears to have a peripheral, posterior, and lower lobe predominance (see Figs. 10-3 and 10-5). The abnormality often is best seen on the lateral view, just above the diaphragm, in the posterior costophrenic angles. Because of lung fibrosis, lung volumes usually appear reduced.

Honeycombing with a medium reticular pattern usually indicates the presence of usual interstitial pneumonia (UIP). UIP can be seen in a variety of conditions; however, over 90% of cases of honeycombing result from a small group of diseases, including idiopathic pulmonary fibrosis (IPF), collagen-vascular disease, drug-related fibrosis, asbestosis, end-stage hypersensitivity pneumonitis, or end-stage sarcoidosis. Nonspecific interstitial pneumonia (NSIP) less commonly results in honeycombing; it often is associated with collagen-vascular disease. Honeycombing also may result from radiation lung fibrosis, as an end-stage of acute respiratory distress syndrome, and other entities. Lung volumes are characteristically reduced in the presence of honeycombing.

Some cystic lung diseases (e.g., Langerhans’ cell histiocytosis, lymphangiomyomatosis [LAM]) result in a reticular pattern because of superimposition of the walls of cysts ranging in size from several millimeters to several centimeters in diameter (see Fig. 10-6). Depending on the size of the cysts, the pattern may be fine, medium, or coarse. This appearance can mimic honeycombing, but significant lung fibrosis is absent, and lung volumes are not reduced. In many such patients, lung volumes appear increased. An upper lobe predominance may be seen rather than predominance at the lung bases, depending on the responsible disease.


TABLE 10.2 Reticular Pattern: Differential Diagnosis


Usual interstitial pneumonia


Idiopathic pulmonary fibrosis


Collagen-vascular disease


Drug-related fibrosis


Asbestosis


End-stage hypersensitivity pneumonitis


End-stage sarcoidosis


Nonspecific interstitial pneumonia


Radiation


End-stage adult respiratory distress syndrome


Cystic lung disease


Langerhans’ cell histiocytosis


Lymphangiomyomatosis


Tuberous sclerosis


Sjögren’s syndrome with LIP


Lymphoid interstitial pneumonia (LIP)


Cystic bronchiectasis


Pneumonia with pneumatoceles (e.g., pneumocystis)


Papillomatosis


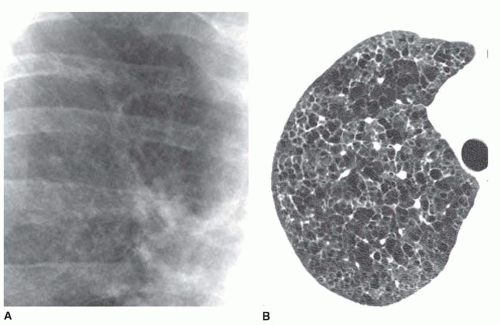
FIG. 10.4. Fine reticular pattern in Langerhans’ cell histiocytosis. A: Coned-down view of the right upper lobe shows fine reticular opacities with poor definition of pulmonary arteries. B: HRCT shows cystic disease. Superimposition of the cyst walls results in the fine reticular pattern that is visible on chest radiographs.


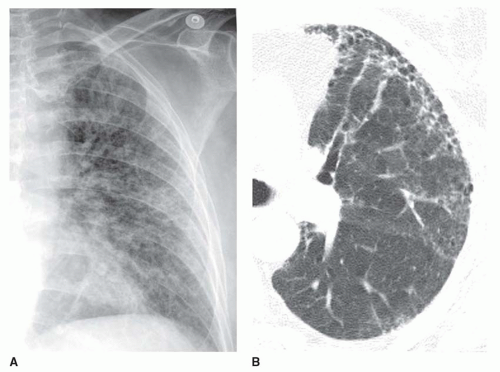
FIG. 10.5. Medium reticular pattern in rheumatoid lung disease. A: Chest radiograph shows irregular reticular opacities, best classified as a medium pattern. B: HRCT shows reticular opacities associated with honeycombing in the anterior lung.


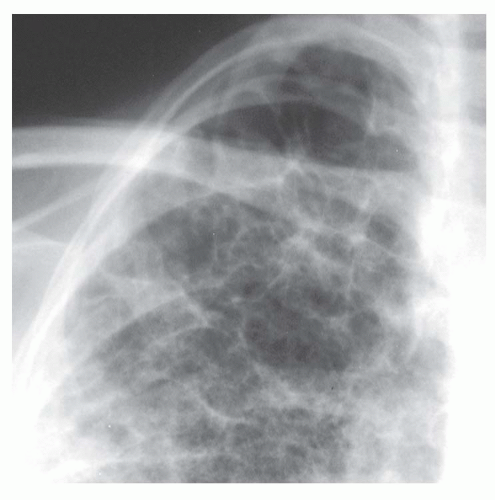
FIG. 10.6. Coarse reticular pattern in cystic lung disease. Coned-down view of the right apex shows reticular opacities outlining spaces exceeding 1 cm.

A fine reticular pattern may indicate fine lung fibrosis or lung infiltration by a variety of processes (see Fig. 10-4). This pattern is less common, more difficult to see, and less specific.


Nodular Pattern

Innumerable small nodules, ranging from a few millimeters to 1 cm in diameter, may indicate interstitial or air-space disease. The differential diagnosis of multiple larger nodules and masses is reviewed in Chapter 9.

Interstitial nodules usually are sharply marginated, despite being very small (Figs. 10-7 and 10-8). Air-space disease also may result in nodules (air-space or acinar nodules), typically 5 to 10 mm in diameter and poorly marginated. The term miliary pattern describes the presence of diffuse or widespread, well-defined nodules, 2 mm or less in diameter (see Figs. 10-7 and 10-8). Miliary nodules usually are interstitial.


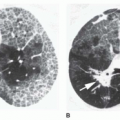
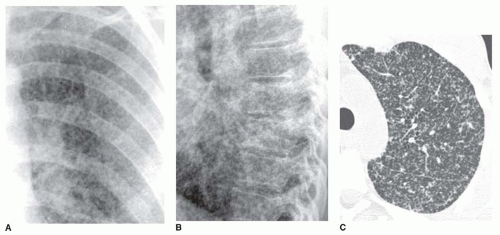
FIG. 10.7. Miliary nodules in hematogenous spread of coccidioidomycosis. Coned-down views from PA (A) and lateral (B) radiographs show innumerable nodules a few millimeters in diameter. C: HRCT shows innumerable, very small lung nodules.

Nearly all patients with nodules that are 5 mm or less in size, either well defined or ill defined, have a predominant interstitial abnormality; many will have metastases (Fig. 10-9) or a granulomatous disease (see Figs. 10-7 and 10-8; Table 10-3). Granulomatous diseases that may produce this appearance include infections (e.g., miliary
tuberculosis and fungus), noninfectious granulomatous diseases (e.g., sarcoid, histiocytosis, hypersensitivity pneumonitis), and some pneumoconioses (primarily silicosis and coal worker’s pneumoconiosis [CWP]). Metastases tend to have a basal predominance because of greater blood flow to the bases (see Fig. 10-9); the granulomatous diseases and pneumoconioses, for a variety of reasons, often have an upper lobe predominance.


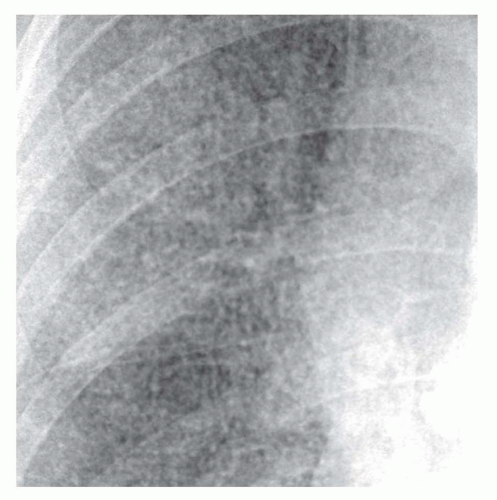
FIG. 10.8. Miliary tuberculosis. Coned-down view of the right upper lobe shows innumerable, discrete, very small nodules.


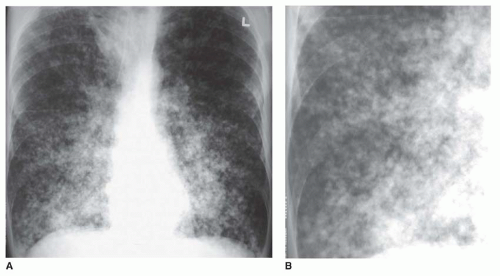
FIG. 10.9. Small nodules in metastatic melanoma. A: Numerous small nodules are visible, with a basal predominance. B: Detailed view of the right lower lobe shows small nodules.

Nodules measuring 5 to 10 mm in diameter may be seen in these same diseases but are more typical of infection, particularly endobronchial spread of infection or bronchopneumonia. Common causes include tuberculosis (Fig. 10-10) and other mycobacterial, bacterial, viral infections such as cytomegalovirus or varicella, and Pneumocystis infection in patients with AIDS. Other causes of air-space consolidation also may result in ill-defined nodules. Diffuse bronchioloalveolar carcinoma often results in this appearance.


Reticulonodular Pattern

The term reticulonodular, indicating a perceived combination of lines and dots, is used commonly by radiologists but is of limited value in diagnosis. Reticulonodular opacities observed on plain radiographs often are artifactual, resulting from the superimposition of mostly lines or mostly nodules. Thus, it is generally a good idea, if a reticulonodular pattern is detected on plain radiographs, to decide whether a reticular or nodular pattern predominates and use that finding for differential diagnosis. Cases actually characterized histologically by a combination of reticular and nodular opacities are relatively uncommon but include sarcoidosis, lymphangitic spread of tumor, and diffuse amyloidosis.


Ground-glass Opacity

Ground-glass opacity represents an increase in lung density without the presence of frank consolidation (Fig. 10-11A). A slight fuzziness of pulmonary vessels usually is visible,
but this abnormality can be quite subtle and difficult to diagnose with certainty. It is a nonspecific pattern (see the following section on HRCT) and can be seen in the presence of either air-space disease or interstitial disease. Because it is nonspecific, its differential diagnosis is very long. It may be seen with edema, hemorrhage, infections, and a wide variety of different DILDs. When visible on a chest film, it is best evaluated by assessment of the history and clinical presentation in patients with acute symptoms or by further imaging (e.g., HRCT) in patients with chronic symptoms (see Fig. 10-11B).


TABLE 10.3 Nodular Pattern: Differential Diagnosis


Metastases: diffuse or basal, well-defined


Diffuse bronchioloalveolar carcinoma (diffuse or patchy, ill defined)


Miliary tuberculosis (diffuse, well-defined, may be upperlobe)


Miliary fungus (diffuse, well-defined)


Sarcoidosis (upper lobe, may be asymmetric, adenopathy)


Silicosis and CWP (posterior, upper lobe predominance, symmetric, adenopathy with eggshell calcification)


Histiocytosis (upper lobe predominance, cysts)


Hypersensitivity pneumonitis (ill defined)


Endobronchial infection (diffuse or patchy, ill defined)


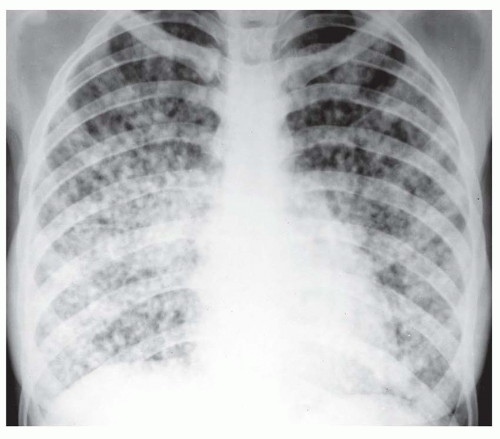
FIG. 10.10. Endobronchial spread of tuberculosis. Ill-defined nodules ranging from 5 to 10 mm in diameter are visible.


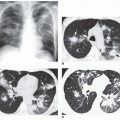
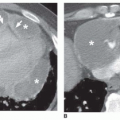
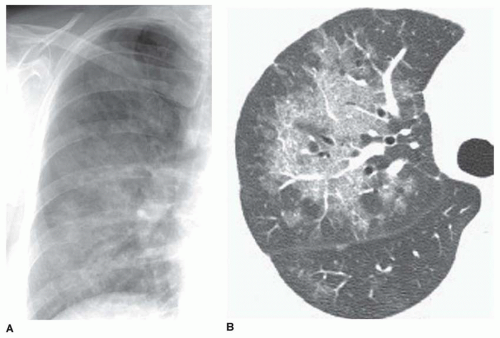
FIG. 10.11. Ground-glass opacity in exogenous lipoid pneumonia. A: Chest radiograph shows a subtle increase in lung opacity in the right parahilar region. Pulmonary vessels are poorly defined. B: HRCT coned down to the right lung shows patchy ground-glass opacity.


HRCT ASSESSMENT OF DIFFUSE INFILTRATIVE LUNG DISEASES

HRCT techniques optimize the radiographic demonstration of lung architecture and are invaluable in the assessment of patients with suspected DILD. The use of thin collimation
(1.5 mm or less) and a high-resolution algorithm for image reconstruction is essential.

HRCT may be obtained with volumetric imaging or with isolated spaced scans. Spaced axial images are usually sufficient for diagnosis of a diffuse lung disease and result in a significant reduction in radiation dose. Scanning at 1-cm intervals in the supine position is commonly employed.

Obtaining prone scans also is advisable. Some dependent (posterior) lung collapse often is seen on supine scans (Fig. 10-12A). Prone scans are valuable in distinguishing true posterior lung disease from dependent collapse; posterior lung collapse clears in the prone position (Fig. 10-12B). If spaced axial imaging is employed, scanning at 2-cm intervals in both the supine and the prone positions would be an appropriate protocol. In patients having volumetric HRCT, prone scans may be obtained volumetrically or at spaced intervals. Patients with normal or minimal chest film abnormalities benefit the most from prone scans.

Postexpiratory scans at selected levels can demonstrate air trapping and may be valuable in diagnosing airway disease in patients with normal inspiratory scans. Appropriate lung windows for viewing HRCT are mean -700 and width 1,000 HU or-600/1,500 HU.


NORMAL ANATOMY: THE SECONDARY PULMONARY LOBULE AND ACINUS

A secondary pulmonary lobule (also simply known as a pulmonary lobule) ranges from 1 to 2.5 cm in size and is marginated by connective tissue interlobular septa, which contain pulmonary veins and lymphatics (Figs. 10-13 and 10-14). Within the peripheral lung, interlobular septa are at the lower limit of HRCT resolution. On clinical HRCT in normal patients, a few interlobular septa often can be seen, but they tend to be inconspicuous.


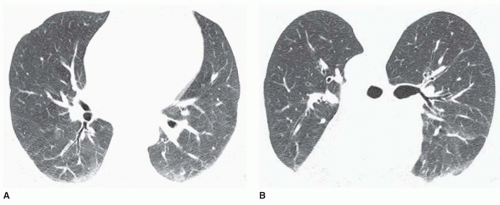
FIG. 10.12. Normal dependent lung collapse and the use of prone scans. A: Supine HRCT in a normal subject shows increased opacity in the posterior (dependent) lung. This appearance cannot be distinguished from lung disease. B: Prone scan shows that the posterior lung is normal.

The central portion of the secondary lobule, referred to as the centrilobular region, contains the pulmonary artery and bronchiolar branches that supply the lobule. The pulmonary artery supplying a secondary lobule measures somewhat less than 1 mm in diameter and can be seen in normal lungs as a dot or branching structure 5 to 10 mm from the pleural surface; the centrilobular bronchiole normally is invisible.

An acinus is the largest unit of lung structure in which all airways participate in gas exchange. Anatomically, it is located distal to a terminal bronchiole and is supplied by a first-order respiratory bronchiole (see Fig. 10-13). Acini average 7 to 8 mm in diameter. A pulmonary lobule usually consists of a dozen or fewer acini, although large lobules may contain twice that number. Acini are not visible on HRCT.


HRCT FINDINGS IN DIFFUSE INFILTRATIVE LUNG DISEASES

Chest films are normal in 10% to 15% of patients with interstitial lung disease. HRCT is more sensitive, specific, and accurate. HRCT characterizes morphologic abnormalities much more precisely and allows a more accurate diagnosis than do chest radiographs.

An approach to the HRCT diagnosis of DILD is fundamentally based on the recognition of specific abnormalities in lung anatomy, together with an assessment of their distribution. Generally speaking, HRCT findings of lung disease can be considered in four groups or categories, which reflect the types of histologic abnormalities present. These abnormalities include reticular opacities, nodular opacities, increased lung opacity, and decreased lung opacity or cystic lesions.


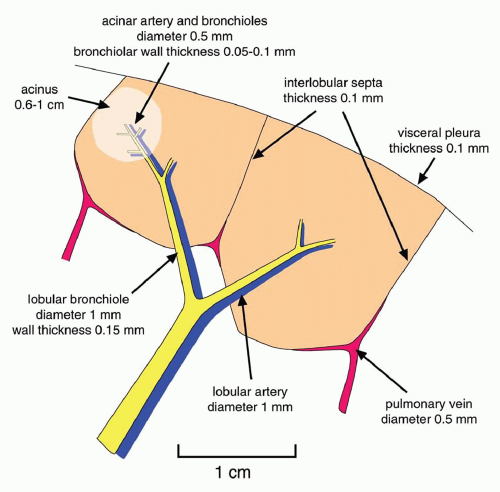
FIG. 10.13. Normal anatomy of the pulmonary lobule. Two lobules are shown.

Within each of these four categories, a relatively short list of findings may be recognized. Although some findings (e.g., “tree-in-bud” pattern, emphysema, mosaic perfusion, and air trapping) are features of airways and obstructive lung diseases rather than DILDs, they are discussed briefly in this chapter in order to describe an overall approach to HRCT.


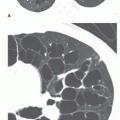
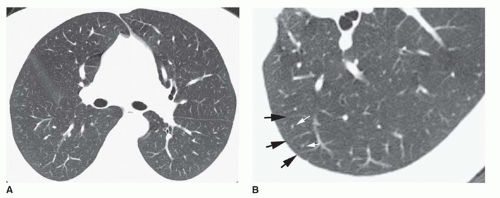
FIG. 10.14. Normal HRCT. A: The lung appears homogeneous in attenuation, with the posterior lung appearing slightly denser than the anterior lung. Fissures are smooth and uniform in thickness. Vessels are smooth in contour and sharply marginated. The most peripheral vessels visible are 5 to 10 mm from the pleural surface and represent centrilobular arteries or, sometimes, veins in interlobular septa. Centrilobular bronchioles and interlobular septa are not visible. B: Coned-down HRCT of the left lower lobe. Two pulmonary lobules are outlined by pulmonary veins within interlobular septa (black arrows). Centrilobular arteries are visible as dots (white arrows).


Reticular Opacities

Thickening of the interstitial fiber network of the lung by fluid or fibrous tissue, or because of cellular infiltration, results in an increase in reticular lung opacities.


Interlobular Septal Thickening

Thickened interlobular septa can be recognized because they outline the margins of pulmonary lobules, which have a characteristic size and shape. In the peripheral lung, thickened septa measure 1 to 2 cm in length and often are seen extending to the pleural surface; in the central lung, the thickened septa can outline lobules that are 1 to 2.5 cm in diameter and appear polygonal in shape (Figs. 10-15 and 10-16). Visible lobules commonly contain a central dotlike or branching centrilobular artery.

Only gold members can continue reading. Log In or Register to continue

Stay updated, free articles. Join our Telegram channel

Oct 10, 2016 | Posted by in CARDIOVASCULAR IMAGING | Comments Off on Plain Film and High-resolution Computed Tomographic Assessment of Diffuse Infiltrative Lung Disease

Full access? Get Clinical Tree

Get Clinical Tree app for offline access