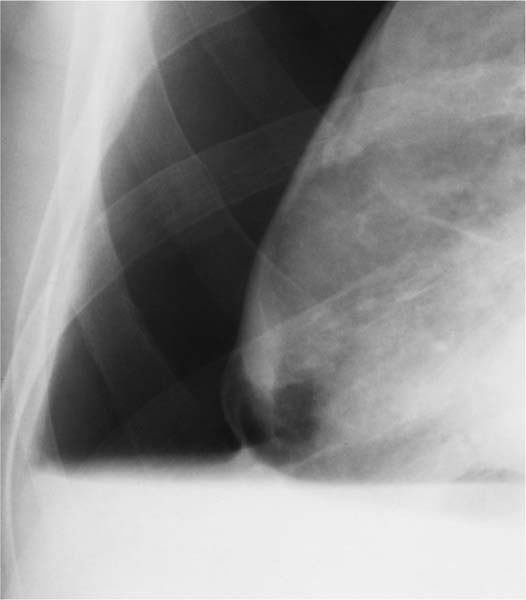
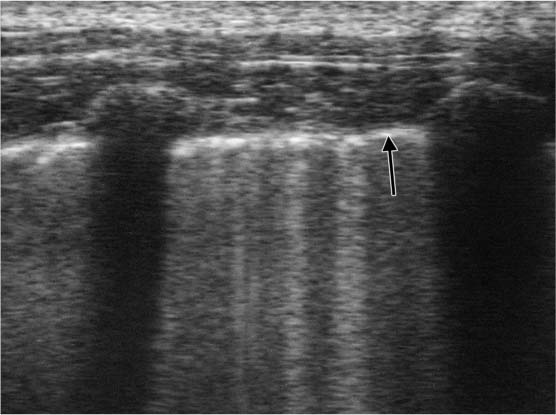
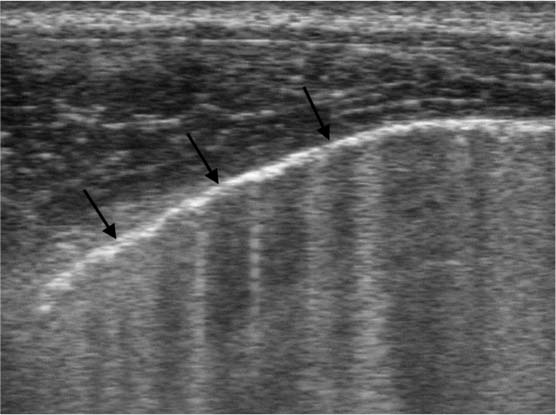
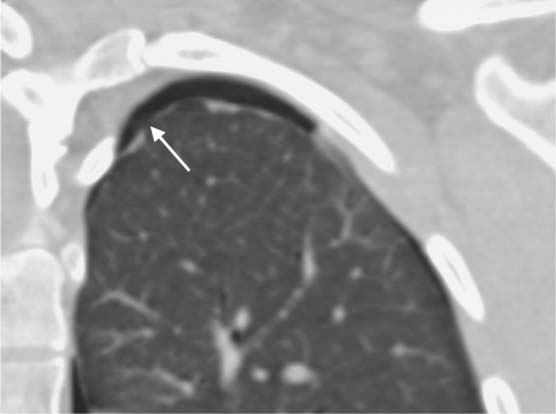
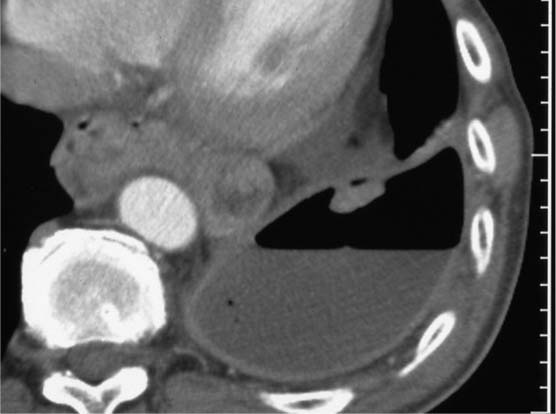
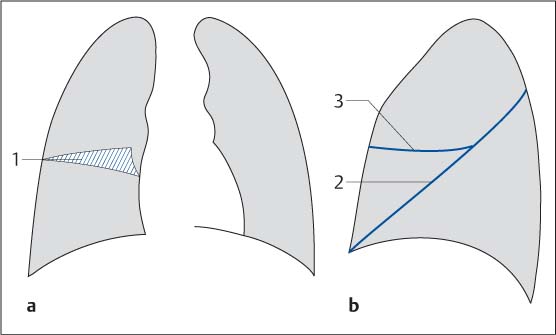
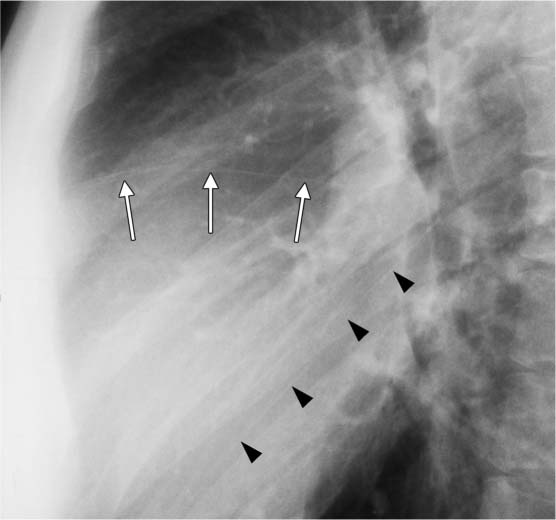
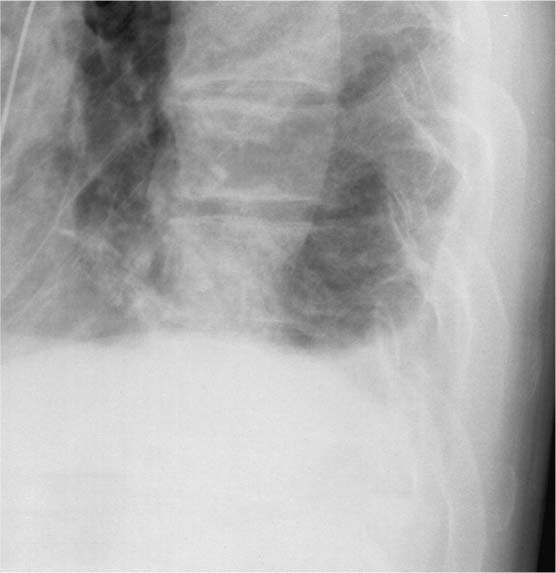
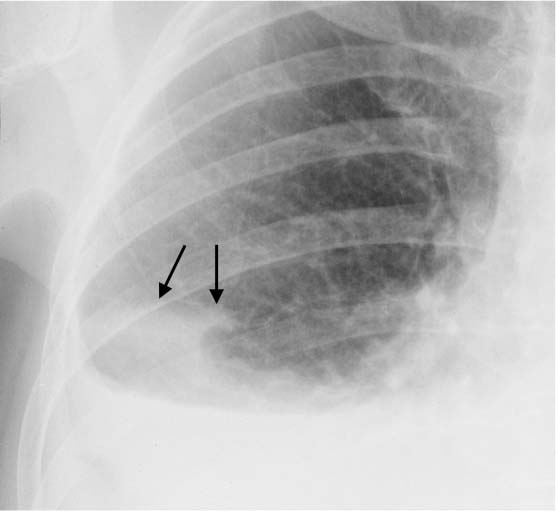
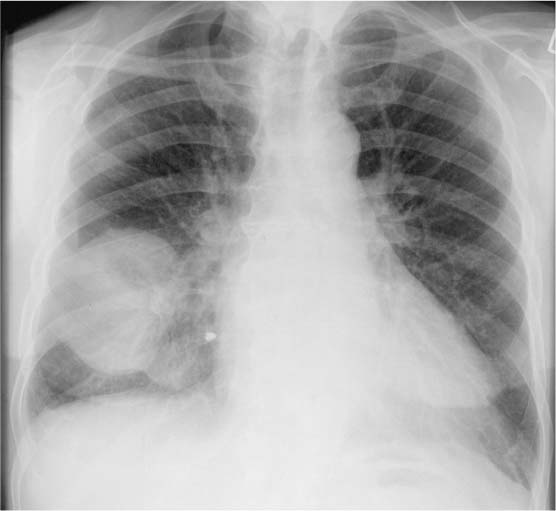
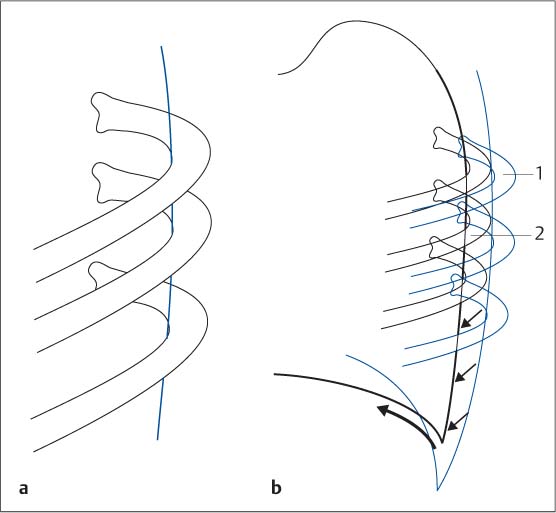
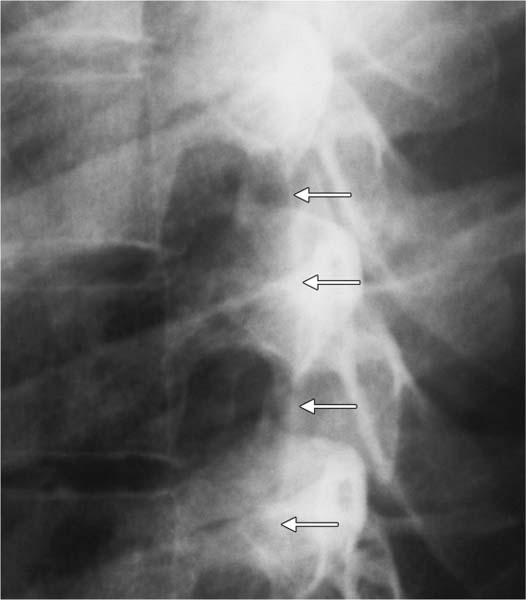
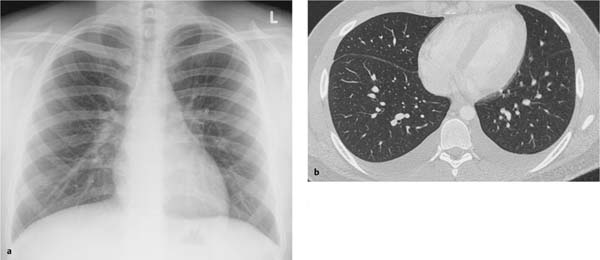
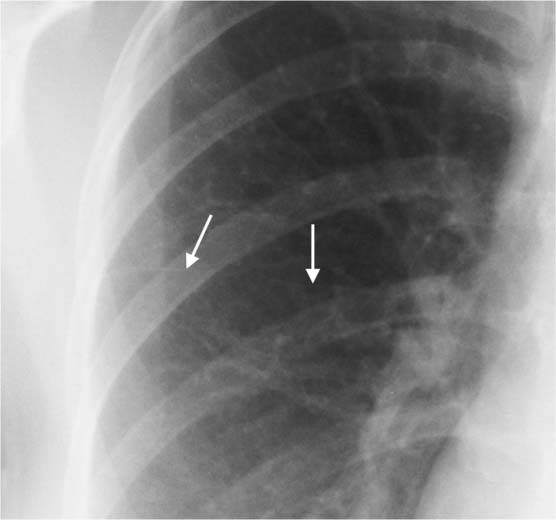
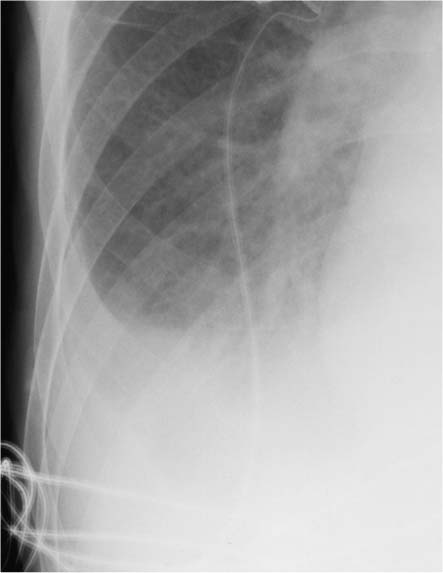
Pathologic pleural changes often accompany disorders of the thoracic organs. Such changes were described early in the study of pulmonary disorders and have long been used in diagnosing underlying changes in the deeper regions of the chest. Honors for the description of attenuation phenomena by means of percussion belong to Auenbrugger von Auenbrugg. His work paved the way for Laennec’s subsequent perfection of auscultation. The physiologic pleura is only 1–2 mm thick. It consists of two layers: The two layers are separated by a virtual space but normally lie in close contact with each other. The film of pleural fluid between them has a volume of a few milliliters (Fig. 6.1). The pleura is indirectly visualized on conventional radiographs as follows: The pleura can also be directly visualized where pathologic changes occur. These include: Fig. 6.1 Anatomic structure of the chest wall. Fig. 6.2 Tangentially imaged pleura (detail enlargement of the chest radiograph). The posterior margin of the lung is marked by the line of the pleura (white arrows) coursing between rib arches. Fig. 6.3 Direct visualization of the visceral pleura in pneumothorax. Complete collapse of the right lung in pneumothorax with fluid accumulation. The visceral pleura can be identified along the partially collapsed basal segments of the right lung. On ultrasound studies as well, the physiologic pleura is recognizable only because of an impedance mismatch between air-filled areas and the chest wall, which exhibits the acoustic impedance of soft tissue (Fig. 6.5, Fig. 6.6). Ultrasound can demonstrate the dynamics of the two separate layers of the pleura better than any other imaging modality. Computed tomography directly visualizes the pleura as a fine band (Fig. 6.7). In pneumothorax with or without fluid accumulation and empyema, CT can also distinguish the visceral and parietal pleura from each other (Fig. 6.8). Ultrasound and CT are clearly superior to conventional radiography in evaluating the pleural space. In the presence of clinical data (“But the patient has a pleural effusion on ultrasound”), one should be very careful with a plain chest radiograph that shows what appear to be normal findings (Fig. 6.4). Fig. 6.4a, b Subpulmonary effusion Fig. 6.5 Ultrasound image of the pleura. In the sagittal plane tangential to the ribs there is a streaky hyperechoic line along the impedance mismatch between the chest wall and the air-filled lung (black arrow). Fig. 6.6 Ultrasound image of the pleura. Unobstructed visualization of the pleural border (black arrows) in the intercostal plane. Fig. 6.7 CT image of the visceral pleura in pneumothorax. Discrete thickening of the visceral pleura in spontaneous apical pneumothorax. Tiny subpleural bullae (white arrow). Fig. 6.8 CT image of the thickened visceral and parietal pleura. Pleural empyema already treated by aspiration and drainage; the thickened layers of the pleura can be differentiated because of the air inclusion. The visible layers of the visceral pleura lying between the various pulmonary lobes are referred to as the interlobar fissures (Fig. 6.9). The following fissures are regularly identifiable: The interlobar fissures are also visible in the presence of various extra lobes: The pleura can also be visualized where an anterior pleural fold occurs (Fig. 6.10). This is present on the posteroanterior plain chest radiograph in ca. 20% of all patients examined (Fig. 6.13). The anterior pleural fold corresponds to the zone of direct contact between the two lungs anterior to the upper mediastinum. The anterior pleural fold is readily detectable on conventional radiographs and CT images, especially in an emphysematous barrel chest (Fig. 6.13b). A posterior pleural fold similar to the anterior fold has been postulated. This posterior fold is not a clearly defined line, rather a zone between the medial borders of the posterior portions of the right and left lungs, which can approximate each other to a varying degree posterior to the aortic arch. The visceral and parietal pleura are directly visualized on CT (see above). The horizontal fissure is occasionally difficult to identify. Note that there are fewer vascular structures in the pulmonary tissue adjacent to the horizontal fissure; this is comparable to the mismatch of vessels between the mantle of the lung and the central region of the lung. Fig. 6.9a, b Schematic diagram of the various pleural folds visualized on the plain chest radiograph. The posteroanterior film (a) usually shows only the right horizontal fissure (1), the pleural fissure between the upper and middle lobes. In contrast, on the lateral film (b) the oblique fissures (2) of both lungs and the horizontal fissure of the right lung (3) are usually visualized. Fig. 6.10 Schematic diagram of the anterior and posterior pleural folds. The radiographic silhouette of the cardiomediastinal shadow does not correspond to the actual margin of the lung. There is an anterior area of contact between the lungs, which produces the radiographic figure of the anterior pleural fold (long arrows). The lungs are also nearly in contact posterior to the mediastinal shadow (short arrow). Fig. 6.11 Appearance of the horizontal fissure of the right lung on the posteroanterior radiograph. This 28-year-old woman shows normal findings for her age group. The horizontal fissure appears as a hairline shadow (white arrows). Fig. 6.12 The oblique fissures and horizontal fissure of the right lung on the lateral radiograph. This 32-year-old man shows normal findings for his age group. The oblique fissures (black arrowheads) and horizontal fissure (white arrows) appear as hairline shadows. Fig. 6.13 a, b Anterior pleural fold The following forms of pleural effusion are distinguished on chest radiographs: Most often, and in the initial phases of the effusion, pleural fluid is observed in the posterior and lateral costophrenic angle (Fig. 6.15, Fig. 6.16). Radiographic signs of this isolated effusion in the costophrenic angle include: The detection threshold for pleural fluid in the lateral costophrenic angle on the plain posteroanterior chest radiograph is between 150 and 200 mL. However, volumes up to 500 mL can be concealed behind the diaphragmatic domes. Significant volumes of fluid can be masked even in subpulmonary effusions (see Fig. 6.4). Where they occur unilaterally, they can simulate a high-riding diaphragm because the lung “floats” on the effusion and the lateral ascending shadow of the costophrenic angle is absent. The lateral view can demonstrate even volumes of less than 100 mL in the posterior costophrenic angle in a free flowing effusion. In this context, it is significant that the right costophrenic angle can be differentiated from the left one on the lateral view alone (see p. 260). An interlobar effusion along the horizontal fissure often exhibits a lemon-shaped configuration; along the oblique fissures it tends to produce a spindle-shaped figure (Fig. 6.17). The encapsulated shape of the interlobar effusion (Fig. 6.18) can occasionally lead one to suspect a mass. However, this misdiagnosis is rare because of the effusion’s typical location and shape (“lemon with a streak”). Encapsulated effusions result from pleural adhesions. Differential diagnosis from a pleural tumor is not difficult on CT. Fig. 6.14 a–d Forms of interlobar effusion. Fig. 6.15 Meniscus sign. Classic findings of a lateral ascending effusion in cardiac decompensation and alveolar edema. Fig. 6.16 Effusion in the posterior costophrenic angle. Fig. 6.17 Interlobar effusion in the oblique fissure. In addition to a large, partially subpulmonary effusion, a crescentic interlobar excursion of the effusion extends cranially into the oblique fissure of the right lung (black arrows). Fig. 6.18 Interlobar effusion in the horizontal fissure of the right lung. The effusion exhibits a typical lemon-shaped configuration. Do not confuse this with a pulmonary mass. Pleural effusions concealed in the posterior costophrenic recess and visible only on lateral films and processes lying posterior to the pleura and not visualized on the posteroanterior film occasionally raise the question of which side the pathology involves, right or left. Remarkably, the lateral chest radiograph alone is sufficient in most of these cases to determine whether it is the right or left posterior costophrenic angle and pleura that is involved. Several diagnostic options are available to identify the side. For the sake of simplicity, all of the following specifications shall apply to the left lateral film: – larger and slightly more blurred (far from the film)? – smaller and more sharply defined (close to the film)? Where the stomach bubble is identifiable beneath a diaphragmatic crus (Fig. 6.20, Fig. 6.21), this crus should be regarded as the left one and traced posteriorly as far as the costophrenic angle. The left diaphragmatic crus can only be traced as far as the posterior cardiac margin, the right one as far as the anterior chest wall (Fig. 6.22). Note that all three of these criteria can rarely be evaluated simultaneously. However, one of them is almost invariably present. Fig. 6.19 a, b Schematic diagram of how to distinguish the right and left costophrenic angles on the lateral view. Using the ribs for orientation. The pleura passes through the apexes of the posterior rib arches (a). The respective ribs are analyzed as close to or far from the film (b
General
![]() Visceral pleura
Visceral pleura
 Parietal pleura
 Where pleural tissue lies between air-filled spaces in the lungs (interlobar fissures, see below)
 Because of a “Mach effect” due to the abrupt change in radiodensity between the lung and adjacent soft tissue
 As the imaginary line connecting two ribs where the intercostal space is imaged tangentially (Fig. 6.2)
 As the border of a pleural effusion along the adjacent lung
 Thickening or calcification
 Pneumothorax (Fig. 6.3)
 Leopold Auenbrugger von Auenbrugg (* 1722 Graz, † 1809 Vienna): Son of innkeeper, inventor of percussion, court physician to empress Maria Theresa. His book on sound attenuation laid the foundation for the physical examination of the chest organs.
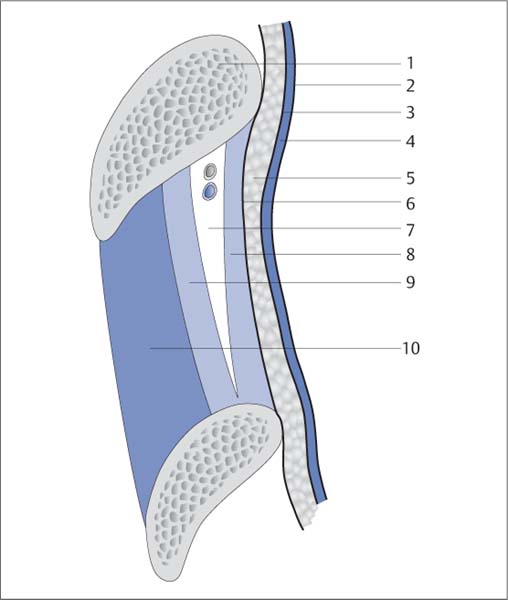
1 Rib
2 Visceral pleura
3 Parietal pleura
4 Pleural space
5 Extrapleural fat
6 Inner fascia of the chest wall
7 Intercostal space with fatty tissue and vascular structures
8 Internal intercostal muscle
9 Intermediate intercostal muscle
10 External intercostal muscle
a There is no evidence of the pleural effusion previously diagnosed on ultrasound.
b A CT scan performed the same day to exclude a pulmonary embolism confirmed the ultrasound findings.
 Posteroanterior view: horizontal fissure of the right lung (Fig. 6.11)
 “Lateral view: oblique and horizontal fissures (Fig. 6.12)
 Azygos lobe (see Review Case 5, Chapter 1)
 Cardiac lobe
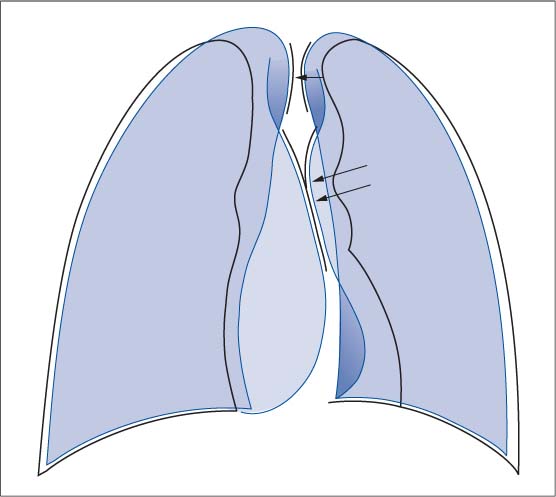
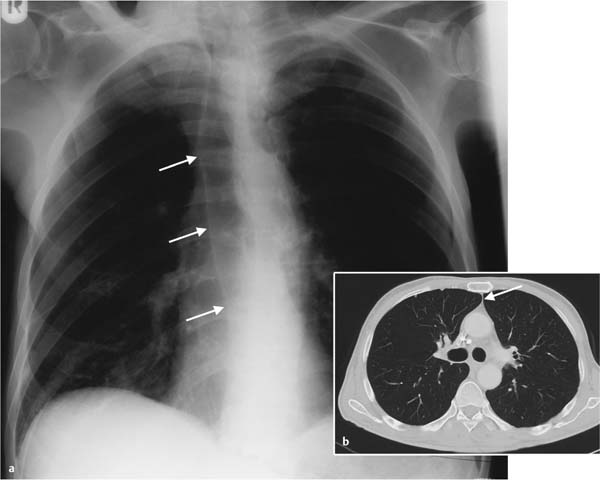
a Approximation of the pleura of the right and left lungs which extend into the mediastinum (white arrows) on the posteroanterior view.
b CT image of the extended anterior pleural fold between the right and left lungs (white arrow).
Pleural Effusion
 Effusion in the costophrenic angle
 Interlobar effusion (Fig. 6.14)
 Subpulmonary effusion
 Loculated (encysted, encapsulated) effusion
 Shadow in the costophrenic angle with an ascending lateral tip (meniscus sign)
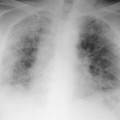
 Larger effusion characterized by shadowing in the adjacent areas of the lung and vascular engorgement
 The Golden Lemon Award goes to the radiologist who interprets an interlobar effusion as a pulmonary tumor.
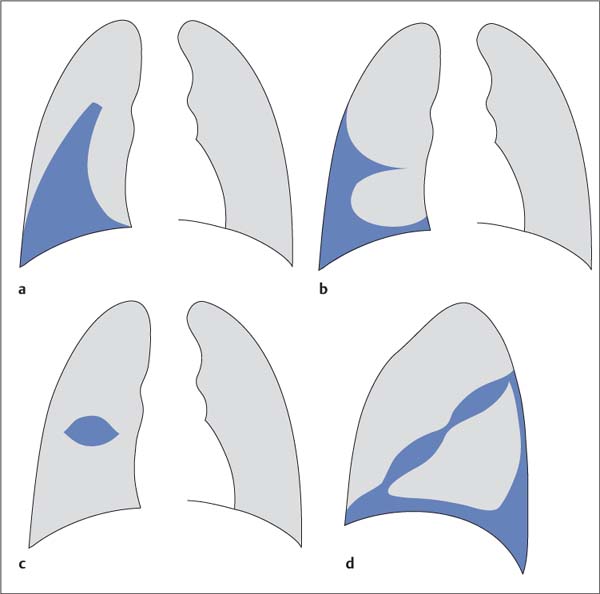
a Effusion in the costophrenic angle and interlobar effusion in the oblique fissure of the right lung.
b Effusion in the right costophrenic angle and in the horizontal fissure of the right lung.
c Encapsulated interlobar effusion in the horizontal fissure of the right lung.
d Effusion in the costophrenic angle and interlobar effusion in the oblique fissure.
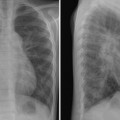
Excursus: Costophrenic Angle on the Lateral Film
Option 1: Using the Ribs for Orientation
 Identify the pleura corresponding to the respective ribs: The posterior line of the pleura passes through the apexes of the posterior rib arches (Fig. 6.19, Fig. 6.21).
 Answer the question: Are the ribs that belong to the respective pleural line
 Next, the pleural line identified as the left line (close to the film) or the right line (far from the film) is traced caudally as far as the respective costophrenic angle.
Option 2: Using the Stomach Bubble for Orientation
Option 3: Using the Silhouette Sign between the Heart and Diaphragm for Orientation
 The often quoted rule that “the right diaphragmatic crus is higher on the lateral film” is not correct.
![]()
Stay updated, free articles. Join our Telegram channel

Full access? Get Clinical Tree


