Abstract
Positron emission tomography (PET) is a radionuclide imaging technique that allows for noninvasive quantification of biochemical pathways in vivo. Utilizing positron emitting labelled compounds of interest, a myriad of biological processes can be visualized in the human heart. As such, PET has been proven invaluable to the noninvasive investigation of cardiovascular biology and physiology. Assessment of myocardial perfusion and substrate metabolism are of particular value in the evaluation of patients with (suspected) coronary artery disease (CAD) to detect ischemia and myocardial viability. This chapter will outline the fundamental principles of PET and technical considerations of cardiac PET imaging.
Keywords
Positron emission tomography, Ischemia, Viability
4.1
Introduction
Positron emission tomography (PET) is a radionuclide imaging technique that allows for noninvasive quantification of biochemical pathways in vivo . Utilizing positron emitting labeled compounds of interest, a myriad of biological processes can be visualized in the human heart. As such, PET has been proven invaluable to investigate cardiovascular biology and physiology noninvasively. Due to its limited availability, methodologic complexity, and high cost, cardiac PET has long been considered to be a research tool only. In recent years, however, PET technology has been fused with computed tomography (CT) as well as magnetic resonance imaging (MRI). In a short period of time, these hybrid devices have gained great popularity, predominantly driven by their success in clinical oncology, which has led to an exponential growth of the numbers of scanners installed worldwide. This growth in hardware has been paralleled by improvements in radiotracer availability and advances in postprocessing software. Consequently, cardiac PET has witnessed more widespread use and routine implementation in the clinical arena. Assessment of myocardial perfusion and substrate metabolism are of particular value in the evaluation of patients with (suspected) coronary artery disease (CAD) to detect ischemia and myocardial viability. Moreover, PET has the potential to probe a number of complex functions like myocardial innervation, energetics, inflammation, receptor mapping, and gene reporting, some of which may ultimately prove to be of clinical value.
This chapter will outline the fundamental principles of PET and technical considerations of cardiac PET imaging. Subsequently, the available tracers for myocardial perfusion imaging (MPI) will be highlighted with special emphasis on quantification of myocardial blood flow (MBF). Also, the added value of substrate metabolism will be discussed. Finally, future directions of molecular and hybrid imaging will be explored.
4.2
Principles of PET
4.2.1
Data acquisition
PET relies on the simultaneous detection of two annihilation photons, emitted when a positron, produced in the decay of neutron-deficient nuclides, is annihilated by colliding with an atomic electron. The most commonly used nuclides in (cardiac) PET are 18 F, 11 C, 13 N, 15 O, and 82 Rb ( Table 4.1 ). Since the average range traveled by positrons is small, in the order of mm, the decay can be considered to have occurred along the straight line described by the two annihilation photons. As shown schematically in Figures 4.1 and 4.2 , a PET scanner consists of a number of rings of detectors. These detectors consist of a scintillating material, typically bismuth germanate (BGO) or cerium-doped lutetium(-yttrium) oxyorthosilicate (LSO or LYSO), that converts the energy of the annihilation photons into light. This light is then converted into an electrical signal by a photomultiplier, with a pulse height proportional to the energy of the incoming photon. Two photons are considered to have been emitted simultaneously when they are detected within the coincidence-timing window of the scanner, around 6–12 ns. Hence, all that is known when two photons are detected simultaneously is that a decay event occurred somewhere along the line between two detectors, a so-called line of response (LOR). By detection of large numbers of these annihilation photon pairs, the distribution of the positron-emitting nuclides in the part of the patient positioned within the field-of-view of the PET scanner can be reconstructed. As can be seen in Figure 4.2 , acquisition can be performed either in 2D or 3D acquisition modes. To avoid confusion, the resulting images are always 3D volumes. The advantage of 2D acquisition mode, with the detector rings separated by collimating lead or tungsten septa and only accepting coincidences within a single ring or between adjacent rings, is that acquisition is done on a per-slice basis, as in CT. This reduces image reconstruction to a relatively simple 2D problem. In addition, septa reduce the fraction of random and scatter coincidences (see Section 4.2.3 ). 3D acquisition, accepting coincidences between all combinations of detector rings, typically result in a fivefold increase in sensitivity of several factors compared to 2D mode. This is obtained at the cost of increasing scatter and random fractions, much larger amounts of data, and more complex and computationally demanding reconstruction algorithms. Improvement in reconstruction methods and increased computer power ensure that the advantages of 3D acquisition nowadays outweigh its disadvantages, and the latest generation of scanners are no longer equipped with septa.
| Isotope | Half-life | Production | Labeled compound | Biological information |
|---|---|---|---|---|
| 82 Rb | 76 s | Generator | 82 Rubidium | Perfusion |
| 15 O | 123 s | Cyclotron | 15 O-water | Perfusion |
| 15 O-oxygen | Oxygen consumption | |||
| 15 O-carbonmonoxide | Blood volume | |||
| 13 N | 9.97 min | Cyclotron | 13 N-ammonia | Perfusion |
| 11 C | 20.4 min | Cyclotron | 11 C-palmitate | Fatty acid metabolism |
| 11 C-glucose | Glucose metabolism | |||
| 11 C-acetate | Oxygen consumption (Krebs cycle flux) | |||
| 11 C-hydroxyephedrine | Sympathetic neuronal catecholamine uptake | |||
| 11 C-epinephrine | Sympathetic neuronal catecholamine storage | |||
| 11 C-CGP12177 | beta-adrenergic receptor density | |||
| 11 C-GB67 | Alpha1-adrenergic receptor density | |||
| 11 C-PK11195 | Peripheral benzodiazepine receptor density (macrophage activity, inflammation) | |||
| 18 F | 110 min | Cyclotron | 18 F-FDG | Glucose metabolism |
| 18 F-flurpiridaz | Perfusion | |||
| 18 F-fluorodopamine | Sympathetic neuronal uptake and function | |||
| 18 F-sodium fluoride | Vascular calcification/plaque vulnerability |


The implementation of faster detector materials such as LSO and LYSO has recently resulted in the emergence of time-of-flight PET (TF-PET) where the detection times of the individual photons are measured as well. In the latest generation of PET systems equipped with TF, the time difference between the arrival of both annihilation photons can be measured with a time resolution of around 500 ps, corresponding to a path length of about 17 cm ( Figure 4.3 ). Use of TF information in image reconstruction results in a considerable improvement of signal to noise ratio, especially in large patients.

On all current PET/(-CT) scanners, image reconstruction is routinely performed using various implementations of 3D ordered subsets expectation maximization (OSEM) iterative reconstruction. Many studies have been devoted to the quantitative accuracy of OSEM reconstructions, showing results to be comparable to those obtained with analytical reconstruction methods (filtered back projection) [ ].
4.2.2
Attenuation
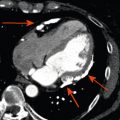
As in single-photon imaging, annihilation photons are attenuated on their way through the body, causing a reduction of the number of photons measured along a certain LOR ( Figure 4.4 ). While the signal measured in single-photon imaging (gamma scintigraphy) is depending on the depth at which the photons are emitted, the PET signal is only dependent on the total attenuation along the LOR, which can be measured directly using a positron-emitting source rotating around the patient ( Figure 4.5 ). This makes PET an inherently quantitative technique. As an alternative, the attenuation can be accurately estimated based on a co-registered CT image after conversion of Hounsfield units to 511 keV attenuation coefficients as implemented in all current PET–CT scanners. Especially in the thorax region, this poses a challenge compared to 511 keV transmission imaging. Since a 511 keV transmission scan typically takes several minutes to acquire, it is done during regular breathing, as is the emission PET scan itself. CT, however, provides a snapshot of the patient during a single phase of the respiratory (or cardiac) cycle. Neither 511 keV transmission scan nor CT are acquired simultaneously with the PET scan itself, which frequently results in attenuation correction misalignment artifacts in cardiac PET/CT scanning due to patient motion.


4.2.3
Corrections
In addition to attenuation correction as described in the previous section, a number of corrections have to be applied to PET data to ensure quantitatively accurate images. First, data have to be normalized, i.e., corrected for differences in detection efficiency for different LORs. This correction is usually based on a measurement with a uniform phantom that is performed on a regular basis, for example, every 3 months. Then, a correction has to be applied for dead time (the time after each event during which the system is not able to record another event), ensuring linearity of the scanner. In this respect, dynamic cardiac studies with H 2 15 O and 82 Rb, aimed at quantifying MBF, are the most challenging studies to be performed with PET. In these studies, count rates vary from extremely high (up to 50 million single photons per second) immediately after injection when all radioactivity is passing through the thorax, to very low after several minutes when the radioactivity has mostly decayed and has distributed throughout the body.
At high count rates, the major part of the measured coincidences can consist of random coincidences ( Figure 4.6a ), where two photons originating from different decays are detected within the coincidence-timing window of the scanner. The probability of random coincidences increases with the square of the single-photon count rate, and hence approximately with the square of the amount of radioactivity in the FOV of the scanner. Correction for random coincidences is based on the fact that their probability can be calculated for each LOR as the product of timing window width and the singles count rates of both detectors.

The mean attenuation length of 511 keV photons in water is about 7 cm. That implicates that after 7 cm, on average 50% of all annihilation photon pairs have undergone Compton scatter, and one of the photons has hence changed direction ( Figure 4.6b ). Many of these scattered photons are not detected, either because they leave the FOV of the scanner or, in 2D PET, because they do not reach the detectors due to the septa. Even if they reach the detector, Compton scatter has reduced their energy and the proportionality between photon energy and photomultiplier pulse height can be used to reject them, even though the limited energy resolution of 10–15% requires a large energy window of typically 400–600 keV. Still, depending on patient size, scatter coincidences can constitute more than 50% of the total amount of coincidences after random correction. Because of this, a lot of effort has been put into developing accurate corrections for scatter coincidences. Today, all commercial scanners utilize Monte-Carlo based correction methods, which have been extensively validated.
An additional challenge that arises with the use of 82 Rb is that this isotope emits gamma radiation simultaneously with positrons in about 10% of its decays. Coincidence detection of these, nonangularly correlated, photons together with one (or both) annihilation photons results in erroneous LORs, causing a quantitative bias in the resulting PET images ( Figure 4.6c ). This bias can be corrected for using a modification of the standard scatter correction method.
4.2.4
Image quality and accuracy
The spatial resolution of PET, that is, the minimum difference between two point sources that is needed to be able to distinguish them as separate sources in the reconstructed PET image, is mainly dependent on three factors: the size of the detector elements, the energy of the emitted positrons, and filtering applied during or post image reconstruction. The size of the detector elements is typically around 4 × 4 mm, which is the most important contribution in clinical scanners. The 2–3 cm thickness of the detectors, required to obtain a sufficient detection sensitivity, results in uncertainty on the depth of photon interaction and a corresponding degradation of the spatial resolution increasing with distance to the center of the FOV ( Figure 4.7 ). Typical spatial resolution in images acquired with clinical scanners is around 6–7 mm.

Since no collimation is required, the sensitivity of PET (the number of useful detected photons relative to the amount of radioactivity in the scanner) is several orders of magnitude higher than that of single-photon images. This high sensitivity allows for measurement of the radioactivity distribution not only with a high spatial resolution, but also with a temporal resolution in the order of seconds. Hence, not only the spatial distribution, but also the kinetics of molecules labeled with positron-emitting nuclides can be measured with PET.
4.3
Clinical applications
4.3.1
Myocardial perfusion
Of the available tracers, 82 Rb, 13 NH 3 , and H 2 15 O are the most commonly used for the assessment of myocardial perfusion [ ]. 18 F-flurpiridaz is an emerging perfusion tracer not yet available for clinical use, but holds great potential and is currently being tested in phase 3 trials [ ]. As will be described in this section, each of these tracers possesses unique characteristics with their individual pros and cons pertaining to (costs of) radionuclide production, physical half-life, image quality, radiation exposure, compatibility with exercise acquisition protocols, and tracer kinetics for quantification ( Table 4.2 ). None of the perfusion tracers excels on all of these features. Choice of tracer is therefore multifactorial and frequently depends on practical and logistical considerations, as well as specific requirements regarding the nature of cardiac PET program (e.g., for scientific or diagnostic purposes).
| H 2 15 O | 13 NH 3 | 82 Rb | 18 F-flurpiridaz | |
|---|---|---|---|---|
| Half-life | 123 s | 9.97 min | 76 s | 110 min |
| Production | Cyclotron | Cyclotron | Generator | Cyclotron |
| Kinetics | Freely diffusible, metabolically inert | Metabolically trapped in myocardium | Metabolically trapped in myocardium | Metabolically trapped in myocardium |
| Mean positron range in tissue | 1.1 mm | 0.4 mm | 2.8 mm | 0.2 mm |
| Scan duration Gating/LV function | 6 min − | 20 min + | 6 min + | 20 min + |
| Radiation dose (3D) | ~ 0.5 mSv | ~ 1 mSv | ~ 4 mSv | ~ 5 mSv |
| Exercise protocol compatible | − | − | − | + |
| Quantification | Excellent | Good | Moderate | Very good |
| Image quality | Good (parametric or digital subtraction images) | Very good | Good | Excellent |
4.3.2
Perfusion tracer characteristics
H 2 15 O is characterized by fundamentally different properties as compared with 82 Rb, 13 NH 3 , and 18 F-flurpiridaz [ ]. The latter tracers are transported across the cell membrane and effectively become metabolically trapped. 82 Rb is a potassium analogue that is rapidly and actively taken up by myocardial cells via the Na/K ATP transporter [ ], whereas 13 NH 3 is incorporated into the glutamine pool by active transport and passive diffusion processes [ ]. 18 F-flurpiridaz is a pyridazinone derivative that avidly binds to mitochondrial complex-1 [ ]. In contrast to these tracers, H 2 15 O is freely diffusible and metabolically inert. These properties have consequences for diagnostic quality of relative uptake images. Figure 4.8 displays the dynamic frame acquisition for an uptake tracer ( 82 Rb) and a freely diffusible one (H 2 15 O). After intravenous bolus injection, transit of tracer through the anatomical compartments is visualized. The initial images illustrate tracer activity in the right ventricular cavity. Subsequently, the tracer bolus is dispersed into the lungs, after which it reaches the left ventricular cavity. Both 82 Rb and H 2 15 O are then taken up by the myocardium. As can be appreciated from the images and the matching time-activity-curves for arterial blood and myocardium, however, 82 Rb stays confined to the myocardium while being cleared from the intravascular compartment. Being freely diffusible, H 2 15 O promptly reaches equilibrium between blood and tissue. Consequently, “late” static uptake images of metabolically trapped compounds ( 82 Rb, 13 NH 3 , and 18 F-flurpiridaz) have significantly higher tissue-to-background ratios as compared with H 2 15 O, yielding diagnostic images of superior quality for qualitative grading of relative perfusion distribution ( Figure 4.9 ).