Fig. 6.1
This diagram illustrates the basic idea behind the Doppler effect which describes the situation in which a source of waves (“S”) and a receiver (“R1,” “R2,” “R3,” or “R4”) are moving relative to one another at a velocity of “v” (red arrow). The frequency transmitted by the source and the frequency detected by the receivers are generally all different, depending on the direction of motion and positions of the source and receiver
The difference between the detected and transmitted frequencies is called the Doppler shift and is directly proportional to the velocity of the source as described by the Doppler equation :
 (Because of the pulse-echo nature of medical ultrasound, the Doppler equation programmed in ultrasound scanners includes a factor of “2” not reflected in the equation above, indicating that the Doppler shifts detected clinically are twice as large as those predicted by the above equation.) If the source frequency, Doppler angle , and speed of sound propagation in the medium are known, the source velocity can be computed from the measured Doppler shift . The Doppler angle is defined as the angle between the line connecting the source and receiver and the velocity vector (arrow showing the direction of motion). Receivers R1 and R2 have Doppler angles of 0° and 180°, respectively. They will have the greatest possible Doppler shifts but opposite signs, one positive and one negative. The R1 Doppler shift will be positive (since received frequency > transmitted frequency) corresponding to velocity toward the receiver, and the R2 and R3 Doppler shifts will be negative. R4 has a Doppler angle of 90° and a Doppler shift of zero as though no source motion is occurring. Although the Doppler effect can involve the motion of any biologic tissue or fluid, for example, a ureteral jet entering the urinary bladder, the vast majority of clinical radiology applications involve the detection and measurement of vascular flow.
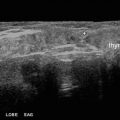
6.3 Duplex/Spectral Doppler Mode
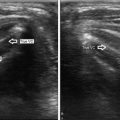
Initial use of the Doppler effect in medical ultrasound was aimed toward rapidly measuring the spectrum of all blood velocities present in a small measurement region or “sample volume.” This mode is referred to as spectral, duplex, or pulsed wave Doppler. It produces a real-time graphical scroll of velocity spectra versus time, with ~100 spectra measured each second. A sample measurement of blood velocity in the superior thyroid artery is shown in Fig. 6.2. The horizontal axis of the graph is “time” in units of seconds, and the vertical axis is “velocity” in units of centimeters per second (cm/s). The sample volume is defined by the short yellow lines in the two-dimensional (2D) color Doppler image above the spectral graph and is positioned by the sonographer at the desired measurement location in the 2D image. The ultrasound pulse direction (solid white line through the sample volume) and the blood flow direction indicator (dashed blue line traversing the sample volume) are both also adjusted by the sonographer and define the Doppler angle , displayed as 14° in this image (red arrow).

Fig. 6.2
This figure shows an example of a duplex Doppler image, with a spectrum obtained from the superior thyroid artery. The red arrow indicates the Doppler angle , here 14°. The dashed white line shows the estimated peak systolic velocity of ~20 cm/s
Each spectrum is acquired from ~100 pulse-echo cycles over a period of ~10 milliseconds (ms), with all pulses aimed through the sample volume along the indicated pulse direction. The detected echoes are typically processed using a fast Fourier transform (FFT ) algorithm to compute all components of the velocity spectrum. The entire cross section of the small artery in Fig. 6.2 is contained in the sample volume, resulting in a range of velocities between a peak value that depends on the heart cycle phase down to values near zero which are typically present near the vessel walls. Undesired low-velocity signals caused by slow, soft tissue motion can be removed from the spectrum using the wall filter control. This filter is helpful in eliminating nonvascular artifacts, for example , caused by slow, soft tissue motion around a vessel. However, signals from very slow blood flow can also be removed if the wall filter setting is too high. The brightness of the spectral display can be adjusted using the Doppler gain control. The sensitivity of the velocity axis of the spectral graph can be adjusted using the Doppler scale control (which also adjusts the pulse repetition frequency, PRF). The peak systolic value from the first full waveform cycle is estimated to be ~20 cm/s (horizontal dashed white line). Duplex Doppler is sometimes used in thyroid imaging to demonstrate arterial waveforms, although specific velocity measurements are not typically of interest. When the most accurate velocity measurements are needed, Doppler angles as far as possible from 90° are desirable, since they result in the largest measured Doppler shift signals and the smallest errors in calculated velocities. Doppler angles at or close to 90° will produce very small Doppler shifts and large errors in calculated velocity due to intrinsic spectral broadening effects. The disadvantage of angles near 90° for Doppler can be confusing for the sonographer, as it runs contrary to best practice for grayscale imaging, where incidence angles of 90° often result in the sharpest images. Figure 6.3 shows the Doppler spectral mirror artifact that can occur for Doppler angles near 90°. The spectrum is noisy and demonstrates low velocities replicated on either side of the zero-velocity baseline, as compared with the correctly acquired image in Fig. 6.2. Figure 6.4 illustrates the aliasing artifact which occurs when the highest measured velocity components exceed the upper bounds of the spectral graph (dashed yellow line) and wrap around to appear on the bottom of the graph (solid yellow line). This artifact can be distinguished from true flow away from the probe by noting that it is only an isolated peak that is displayed below the baseline and that this portion of the waveform would “fit” perfectly on the portion of the waveform above the baseline. This artifact may be corrected by adjusting the velocity scale to be less sensitive (which acts to increase the PRF) or shifting the velocity baseline down to fully accommodate the spectra in the upper part of the graph or both as shown in Fig. 6.2.


Fig. 6.3
The Doppler spectrum shown here illustrates the Doppler spectral mirror artifact
Fig. 6.4
The Doppler spectrum shown in this image illustrates the aliasing artifact. The dashed yellow line indicates the part of the velocity spectrum cut off due to the aliasing artifact, and the solid yellow line shows the actual location of these high-velocity signals in the wrong location in the spectral display
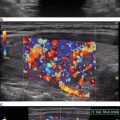
6.4 Overview of the Color Doppler Image
Figure 6.5 shows an example of a color Doppler image of a typical, normal right thyroid lobe. This is a thin slice, tomographic image typically obtained with a wide bandwidth, high-frequency linear array probe (in this case a 6–15 megaHertz [MHz] linear probe). Color Doppler images of the neck are typically obtained at ~5–15 frames per second (fps). Pixels inside the color box (yellow) are either rendered in color where flowing blood is detected or in grayscale for static soft tissues. Velocity is color-coded according to the color bar shown at the left side of the image (red arrow). The color scale control (which adjusts the PRF) determines the velocity measurement sensitivity, and the specific velocity values that correspond to the top and bottom of the color bar are 10 cm/s and −10 cm/s, respectively, in this example (red arrow). Pixel color indicates estimated mean blood velocity and direction of flow, with the upper portion of the color bar representing flow toward the probe (usually reds and yellows) and the bottom half representing flow away from the probe (usually blue). The color scale may be inverted by the user in some cases, but the upper part of the color bar will always represent flow toward the probe. Zero velocity is indicated by the black region in the center of the color scale. Shown at the ends of the color bar are maximum mean velocity values corresponding for each flow direction. It is important to recognize that these values are accurate only for flow directions directly toward or away from the probe, with a Doppler angle of 0 (or 180) degrees. As flow direction and thus Doppler angle are not specified by the user in color Doppler mode and velocity directions will typically vary across the image plane, color-coded mean velocity values in these images are not usually considered to be highly accurate. If accurate measurements of velocity are needed, duplex Doppler mode should be used. Pixels outside of the color box are all shown in grayscale regardless of the presence of flowing blood. Color and duplex Doppler modes are complementary: The color Doppler image shows less accurate velocity information from multiple locations across a large spatial region, while the duplex Doppler mode measures accurate velocity information in a single small spatial location.

 Ultrasound-Guided Laser Ablation
 Transcutaneous Laryngeal Ultrasonography: Clinical Variables
 Cytomorphology of Fine Needle Aspiration of Thyroid
 The Ultrasound Lexicon: Common Terminology for Thyroid and Parathyroid Sonography
 Feature Illustration: Vascularity
 Pattern Recognition: Diffuse Thyroid Disease


Related posts:
Ultrasound-Guided Laser Ablation
Transcutaneous Laryngeal Ultrasonography: Clinical Variables
Cytomorphology of Fine Needle Aspiration of Thyroid
The Ultrasound Lexicon: Common Terminology for Thyroid and Parathyroid Sonography
Feature Illustration: Vascularity
Pattern Recognition: Diffuse Thyroid Disease
Stay updated, free articles. Join our Telegram channel
Full access? Get Clinical Tree
