Anatomy, embryology, and pathophysiology
- ◼
The prostate is a cone-shaped exocrine gland located inferior to the bladder and anterior to the rectum. It surrounds the uppermost segment of the urethra and is enveloped by an incomplete fibromuscular capsule.
- ◼
The gland contains a base superiorly, a mid-gland, and an apex inferiorly.
- ◼
Important neurovascular structures lie within the pericapsular fat anterior to the apex (anterior periprostatic plexus) and posterolaterally (neurovascular bundles). The neurovascular bundles innervate the corpus cavernosum and are critical for normal erectile function.
- ◼
- ◼
The anatomic zonal architecture of the prostate gland is divided into three main regions: peripheral zone, central gland, and anterior fibromuscular stroma. The central gland is composed of the transition zone and central zone.
- ◼
The peripheral zone occupies the posterolateral compartment of the prostate. It comprises the majority of the prostate volume in young men, and is the origin of up to 70% of adenocarcinomas.
- ◼
The transition zone surrounds the prostatic urethra proximal to the verumontanum. It accounts for only 5% to 10% of prostate volume in young men but is responsible for prostatic enlargement in the setting of benign prostatic hyperplasia (BPH). Up to 25% of prostate cancers occur in the transition zone.
- ◼
The central zone surrounds the ejaculatory ducts and comprises about 25% of the prostate in young men. Only 1% to 5% of prostate cancers arise in the central zone.
- ◼
- ◼
From the mid-20s, the prostate begins to gradually enlarge. The central zone atrophies and the transition zone enlarges secondary to BPH, with subsequent compression of the urethra. Although large prostate glands are more likely to cause symptoms of BPH, obstructive symptoms correlate poorly with gland size.
Techniques
Multiparametric magnetic resonance imaging
The combination of anatomic and functional evaluation of the prostate constitutes the elements of multiparametric magnetic resonance imaging (mpMRI). Integration of T2-weighted imaging, diffusion-weighted imaging (DWI), and perfusion imaging has led to a rapid growth in the understanding of the morphology, composition, and enhancement characteristics of prostate cancer and its mimics.
T2-weighted imaging
- ◼
Workhorse of mpMRI because it demonstrates the zonal anatomy of the prostate while allowing identification and characterization of focal lesions.
- ◼
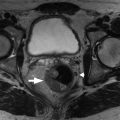
Multiplanar fast spin echo T2-weighted images of the prostate are obtained in small field-of-view (FOV) pulse sequences in axial, coronal, and sagittal planes. The axial and coronal sequences should be obtained in a plane oblique to the axis of the prostate to preserve the normal zonal architecture and prevent volume averaging ( Fig. 29.1 ).
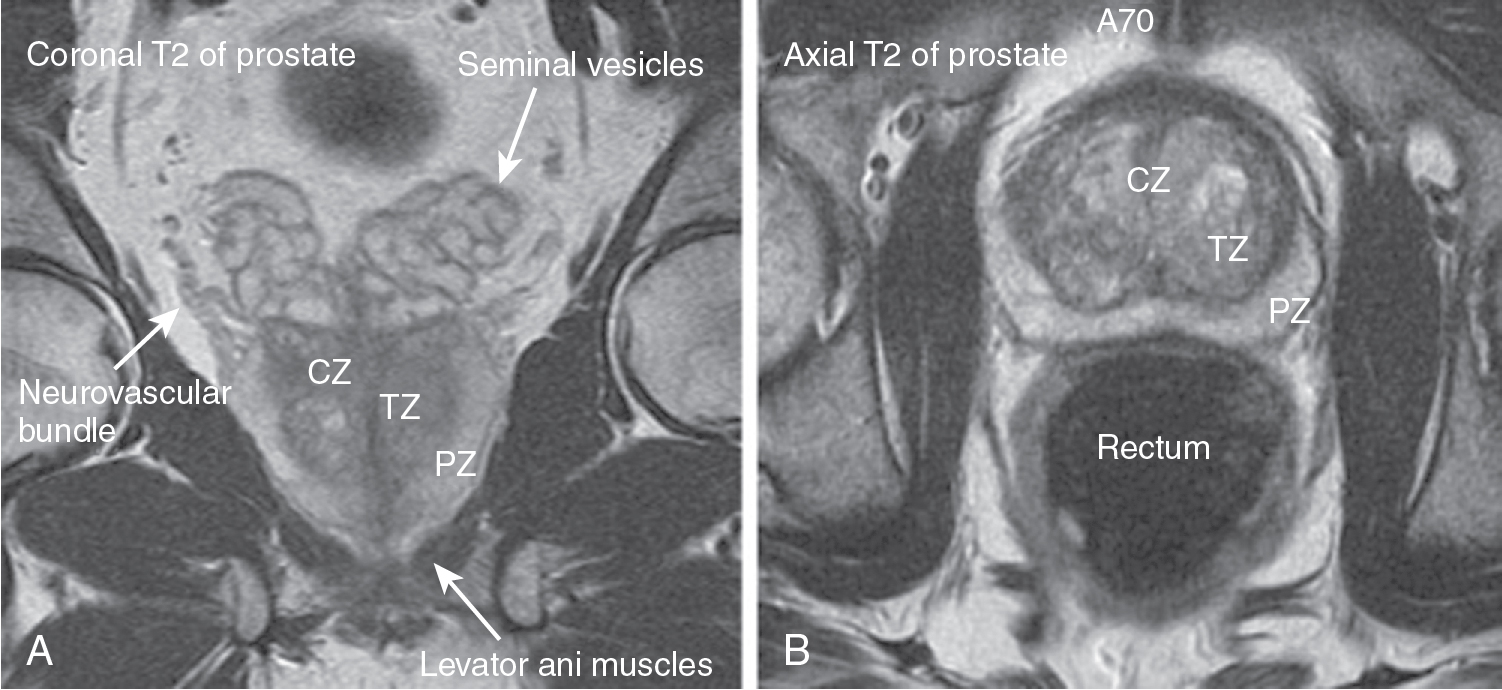
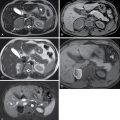
Fig. 29.1
Normal anatomy of the prostate on magnetic resonance imaging. A and B, Prostatic zonal anatomy is well seen on T2-weighted magnetic resonance imaging. The peripheral zone (PZ) is of intermediate to high signal intensity. This contrasts to the intermediate to low signal intensity of the transition zone (TZ) and central zone (CZ). The capsule is seen as having an outer band of low signal intensity, and the periprostatic venous plexus has high signal intensity.
- ◼
Large FOV axial (and possibly coronal) T2-weighted sequences are also obtained to the level of the aortic bifurcation to evaluate for nodal disease.
- ◼
T2-weighted sequences are also useful in detecting extracapsular extension and seminal vesicle invasion.
- ◼
T2-weighted sequences are also useful in the guidance for targeted fusion biopsy in combination with real-time ultrasound.
- ◼
Tumors have different T2 characteristics whether they occur in the peripheral zone or transition zone.
- ◼
Peripheral zone cancers typically manifest as a round or ill-defined T2 hypointense nodule. Because benign conditions, such as postbiopsy hemorrhage, prostatitis, scarring/inflammation, and posttreatment changes can mimic the T2 hypointensity of tumors in the peripheral zone, correlation with DWI is critical.
- ◼
In the transition zone, tumors are more difficult to differentiate from benign entities because of the various changes that occur in the setting of BPH. Transition zone tumors are typically poorly marginated T2 hypointense lesions that appear lenticular and ill defined.
- ◼
Diffusion-weighted imaging
- ◼
DWI represents a functional assessment of the prostate by differentiating tissues with free and restricted diffusion of water molecules. Tissues with restricted diffusion are hyperintense on DWI sequences and hypointense on corresponding apparent diffusion coefficient (ADC) maps. Neoplastic cells in prostate carcinoma contain high cell densities and abundance of intracellular and intercellular membranes, resulting in restricted diffusion.
- ◼
Restricted diffusion is best visualized on ADC sequences corresponding to DWI of high b-values (at least b1400 but up to b2000). Close inspection of ADC sequences serves as a useful screening method for identifying prostate carcinoma, particularly within the peripheral zone. Because of the overlap between malignant and benign focal lesions on T2-weighted imaging, the ADC sequence is usually considered the single most important sequence for characterizing peripheral zone tumor.
Dynamic contrast enhanced (or perfusion) imaging
- ◼
Dynamic contrast enhanced (DCE) imaging involves short rapid acquisitions of T1-weighted gradient echo images before, during, and after gadolinium administration.
- ◼
Although considered the least specific feature, DCE is an evolving technique that demonstrates the properties of angiogenesis and capillary leakiness in prostate tumors. Abnormal neoplastic tissues tend to show a rapid wash-in and washout of contrast whereas normal tissues take up but retain contrast over time. Positive DCE can upgrade a prostate imaging reporting and data system (PI-RADS) 3 lesion to PI-RADS 4.
- ◼
Quantitative measurement and mapping of dynamic enhancement patterns can be used to characterize the properties of benign and malignant prostate tissue. Commercial products, such as DynaCad (Philips, Gainesville, FL) allow generation of color maps that display the wash-in or forward flux of contrast (k trans ), washout or reverse flux of contrast (k ep ), and total volume of contrast delivered (iAUGC). Gadolinium time curves can also be processed from these color maps to depict the three classic enhancement curves: (1) type 1 curve—persistent, (2) type 2 curve—plateau, and (3) type 3 curve—washout. Type 1 and 2 curves are classically associated with normal or benign tissue whereas a Type 3 curve is suspicious for malignancy.
Protocols
Protocol considerations
- ◼
Protocols for optimal multiparametric evaluation of the prostate continue to evolve.
- ◼
The key is to obtain consistent image quality with an adequate signal-to-noise ratio (SNR) to allow for confident interpretation.
- ◼
At 1.5 T, insertion of an endorectal coil in addition to the use of a standard pelvic phased array RF coil is necessary to obtain adequate SNR in the prostate.
- ◼
However, the endorectal coil can also be associated with deformation of the prostate, increased cost and examination time, artifacts (specifically susceptibility), and patient discomfort (which may lead to reluctance to undergo prostate MRI).
- ◼
Many institutions now image exclusively at 3 T without the use on an endorectal coil. Individual centers should tailor their protocols to achieve optimal image quality as they deem appropriate.
Suggested mpMRI protocol
- ◼
Small FOV axial T2-weighted without fat suppression.
- ◼
Small FOV coronal T2-weighted without fat suppression.
- ◼
Small FOV sagittal T2-weighted without fat suppression.
- ◼
Small FOV axial T1-weighted with fat suppression.
- ◼
Small FOV axial DWI (i.e., b50, b500, b1000) with ADC map.
- ◼
Small FOV axial ultrahigh b-value (i.e., b2000).
- ◼
DCE imaging.
Specific disease processes
Benign prostatic hyperplasia
Computed tomography
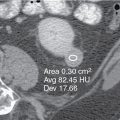
- ◼
CT demonstrates prostate enlargement and defines the gland’s relationship to other pelvic organs. However, it does not accurately define prostatic zonal anatomy ( Fig. 29.2 ).