Proton magnetic resonance spectroscopy ( 1 H-MRS) provides tissue metabolic information in vivo. This article reviews the role of MRS-determined metabolic alterations in lesions, normal-appearing white matter, gray matter, and spinal cord in advancing our knowledge of pathologic changes in multiple sclerosis (MS). In addition, the role of MRS in objectively evaluating therapeutic efficacy is reviewed. This potential metabolic information makes MRS a unique tool to follow MS disease evolution, understand its pathogenesis, evaluate the disease severity, establish a prognosis, and objectively evaluate the efficacy of therapeutic interventions.
Conventional magnetic resonance (cMR) imaging is exquisitely sensitive in visualizing multiple sclerosis (MS) lesions in brain and spinal cord, but has limited pathologic specificity. Also, cMR imaging is limited in the detection of subtle, disease-related changes in the normal-appearing white matter (NAWM). This limitation can be overcome to some extent by combining MR imaging with magnetic resonance spectroscopy (MRS), which allows detection of tissue biochemical changes for improved pathologic specificity. Because biochemical changes precede anatomic changes, MRS detects tissue pathologic changes even before the appearance of lesions on cMR imaging. The unique biochemical information provided by MRS also complements the information from advanced MR imaging techniques, such as magnetization transfer (MT) and diffusion tensor (DT) MR imaging, in providing a more detailed and specific pathologic information. This information in turn allows us to follow MS disease evolution, better understand its pathogenesis, evaluate the disease severity, establish a prognosis, and objectively evaluate the efficacy of therapeutic interventions.
This article is divided into three major sections: (1) brief introduction to MRS, (2) review of MRS and its application to MS lesions, NAWM, gray matter, and spinal cord, and (3) role of MRS in clinical trials. Because of the large number of publications on MRS in MS, wherever possible we have referenced more recent and relevant review articles.
Magnetic resonance spectroscopy
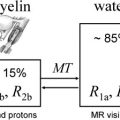
In contrast to MR imaging, which mainly relies on the proton ( 1 H), MRS can be performed using various nuclei. Of all these nuclei, 1 H and 31 P are most commonly used for MRS studies. For several reasons, including sensitivity and hardware considerations, proton MRS ( 1 H-MRS) is the common choice for investigating neurologic disorders. 1 H-MRS provides access to a large number of biomolecules or metabolites, such as N-acetylaspartate (NAA; some authors refer to it as NA to acknowledge that the NAA peak has contributions from N-acetylaspartate and other N-acetyl moieties, such as N-acetyl aspartyl glutamate [NAAG]. In this article NA and NAA are used interchangeably.), choline (Cho), creatine (Cr), myoinositol (mI), glutamate (Glu), and glutamine (Gln), macromolecules, lipids, and lactate (Lac). The positions of metabolite peaks in the spectrum, expressed as parts per million (ppm), are independent of the magnetic field strength. NAA is an amino acid derivative synthesized in neurons and transported down axons and its main resonance appears at 2.02 ppm. NAA is generally believed to be a specific marker of neurons, axons, and dendrites. On this basis, reduced NAA concentration is generally interpreted as neuronal/axonal dysfunction or loss. This interpretation has been confirmed by 1 H-MRS and histology studies on biopsied samples. In general, Glu and Gln are not resolved well even at 3.0 T and combination of resonances from these two is commonly referred to as Glx. The resonances from Glx appear between 2.1 and 2.4 ppm. Although some studies have focused on the evaluation of the total Glu and Gln levels under pathologic conditions, other studies have used spectral editing methods to resolve the Glu resonance. Recently Hurd and colleagues have used a modified conventional spectral localization technique in which data are collected over multiple echo times (TE). This method detects a single-line Glu resonance at 2.35 ppm. Srinivasan and colleagues have shown elevated Glu concentrations in acute lesions ( P = .02) and NAWM ( P = .03), with no significant elevation in chronic lesions ( P = .77) in patients who have MS compared with normal subjects. The primary resonance of Cr occurs at 3.0 ppm and has contributions from creatine and phosphocreatine. Elevated Cr levels may represent gliosis. Cho signals at 3.2 ppm have contributions from multiple molecules that include phosphorylcholine, glycerophosphorylcholine, and choline plasmalogen, and a minor contribution from acetylcholine and choline. Cho peak seems to reflect cell membrane metabolism. Also, elevated Cho concentration represents heightened cell membrane turnover as seen in demyelination, remyelination, inflammation, and gliosis in patients who have MS. mI exhibits two resonances at 3.5 ppm and 4.06 ppm. Because of its proximity to tissue water resonance, the amplitude of the 4.06-ppm peak is affected by the degree of water suppression and is not considered to be a reliable indicator of mI concentration. Brain osmolyte mI seems to be glia specific and it is not found in neurons. Also, mI is a precursor of phospholipid membrane constituents, and its concentration is affected by the formation and breakdown of myelin. Lac is generally seen as a doublet that resonates at 1.33 ppm. It is the end product of anaerobic glycolysis and is not commonly observed in normal brain. It is increased in acute MS lesions and is related to macrophage activation after membrane breakdown. Lipids along with macromolecules (referred to as lipids for brevity) appear as broad peaks and resonate between 0.8 and 1.5 ppm. In healthy tissues, there should be weak lipid peaks in the spectrum unless contaminated by subcutaneous fat from nonneural tissues. These peaks have been reported in MS and are believed to represent demyelination/remyelination. By measuring the concentration changes in brain metabolites, MRS has provided evidence of early pathology and myelin damage/repair in MS that is not evident on cMR imaging.
Acquisition
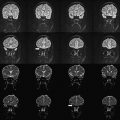
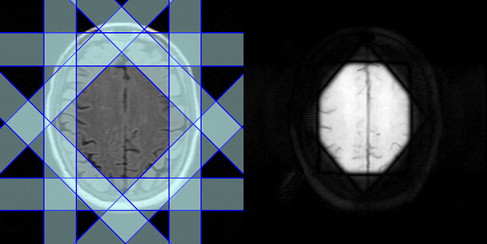
1 H-MRS can be acquired with spatial information preserved (localized 1 H-MRS), as is most commonly done, or obtained from the whole brain by sacrificing spatial information. Point resolved spectroscopy (PRESS) and stimulated echo acquisition mode (STEAM) are the two most commonly used localization techniques in 1 H-MRS. Spectral contamination from extrameningeal tissues is minimized by suppressing the signals from the outer volume. Fig. 1 demonstrates the placement of eight outer volume suppression bands. The PRESS localization provides better signal-to-noise ratio (SNR) compared with STEAM technique. STEAM allows shorter TE than PRESS, however.
Localized 1 H-MRS is acquired in either a single-voxel or multivoxel mode. In single-voxel MRS, spectral data are acquired from one location at a time. The volume of this region is typically 1 to 8 cm 3 . This approach involves shorter acquisition and processing times. High-quality spectrum is relatively easy to acquire in this mode. Multivoxel mode, also referred to as 1 H-MRS imaging or chemical shift imaging, allows simultaneous acquisition of 1 H-MRS data from multiple voxels and allows mapping regional distribution of metabolite concentrations and generating metabolic images. Multivoxel MRS can be acquired in two dimensions or three dimensions (3D) and generally offers superior spatial resolution (<1 cm 3 ) compared with single voxel. Generally, 1 H-MRS imaging is acquired from a volume that is prelocalized using either PRESS or STEAM. It is also possible to acquire 1 H-MRS imaging without any prior volume or slab localization (see, for example, Sharma and colleagues.) 1 H-MRS imaging involves relatively long acquisition times, which, however, can be considerably shortened by reduced k -space encoding. One way of accelerating 1 H-MRS imaging acquisition is to use fast spectral-spatial encoding by using echo-planar (EP)–based techniques. With multislice and multiecho sequences, it is possible to acquire spectra from whole brain within reasonable scan times. Combining EPI-based techniques with recent advances in parallel MR imaging, such as sensitivity encoding (SENSE) or generalized autocalibrating partially parallel acquisitions (GRAPPA) with radiofrequency (RF) coil arrays can further accelerate 1 H-MRS imaging data acquisition. The data acquired with these approaches generally suffer from reduced SNR, however. Determination of absolute metabolite concentration is also somewhat problematic with parallel acquisition schemes.
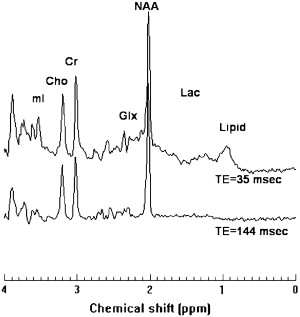
1 H-MRS can be acquired at either long or short TE. Long TE 1 H-MRS provides a well-defined baseline by suppressing peaks arising from short T2 metabolites, such as lipids and macromolecules, and makes spectral quantification simpler and more robust. Long TE 1 H-MRS may be preferable if the interest is in the detection of the three major resonances: NAA, Cr, and Cho. Because of their relatively short T2 relaxation times, signals from metabolites, such as Glx, lipids, macromolecules, and other myelin breakdown products, can be detected only at short TE. Even though the broad spectral baseline in short TE 1 H-MRS makes the spectral quantification more difficult, this approach has the potential to provide important information about altered tissue biochemistry that may not be available at long TE. There is an increasing interest in short TE 1 H-MRS imaging for visualizing short T2 metabolites, which should result in improved pathologic characterization of tissues. As an example, single voxel spectra acquired at 3 T with short and long TE, with signal mostly localized to white matter of normal brain, are shown in Fig. 2 .
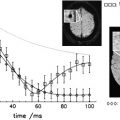
The macromolecular and lipid resonances exhibit significant overlap with the other metabolites. By nulling the metabolite resonances with an inversion recovery sequence, it is possible to improve the detection of these short TE resonances. This method was used by Mader and colleagues for separating lipids from other metabolites in acute MS lesions.
Although localized techniques can be used to acquire spectra from the volume of interest (VOI), nonlocalized sequence can provide MRS from the entire head. The strong broad lipid signals arising from non-brain tissues obscure the resonances from other metabolites. By subtracting the data acquired with and without NAA nulling (through an inversion recovery sequence), however, it is possible to remove/minimize strong lipid signals and visualize resonances from other metabolites. Because NAA is restricted to neurons/axons, it is implicitly localized to brain. The presence of other resonances in non-brain tissues compromises the quantification of metabolites such as Cr. This approach is thus reliable only when quantifying the whole-brain NAA (WBNAA) concentration. Because of severe magnetic field inhomogeneities present at air-tissue interfaces this technique captures about 90% of the NAA signal intensity in the brain. Although WBNAA measurements do not provide any information about the spatial distribution of metabolite concentrations, this approach eliminates image registration problems from scan to scan in serial studies. The reproducibility of WBNAA levels across institutions and MR scanners and field strengths has been shown to be satisfactory. WBNAA measurements can be used to quantify the global neuronal and axonal injury to monitor the effect of neuroprotective agents in MS.
Quantification
The inherently quantitative nature of MRS allows objective monitoring of disease state and response to therapeutic intervention. This monitoring requires accurate spectral quantification, however. Expressing the metabolite levels as a ratio relative to Cr is one of the most common and simplest ways of spectral quantification. The interpretation of the metabolite ratios becomes equivocal, however, if the concentration of Cr varies with pathology. In addition, representing brain metabolite concentrations as ratios does not provide complete information and could lead to significant errors. Absolute quantification of metabolite concentrations is therefore highly desirable for proper interpretation of the MRS data. Nevertheless the NAA/Cr ratio is commonly used in MS. Among the methods for estimating the absolute metabolite concentrations, use of internal water as a standard has been shown to provide acceptable accuracy and interlaboratory reproducibility. This method depends on knowledge of water distribution and relaxation times in different tissues, however. Absolute concentrations can also be measured using the LCModel. This method analyzes the in vivo spectrum as a linear combination of spectra from individual metabolites contained in a solution (model spectrum). The model spectrum is acquired using the same sequence as that used for in vivo spectra and provides the maximum prior knowledge for the spectral analysis. LCModel uses a nearly model-free constrained regularization method that automatically accounts for the fitted baseline and spectral lineshape to be consistent with the data.
Usually, the 1 H-MRS imaging quantification procedures involve extensive computational time, and in some cases, significant human intervention. Currently, the most commonly used quantification methods are based on line fitting using nonlinear least squares optimization, such as the Levenberg-Marquardt algorithm. The relatively long computational time becomes even more problematic when considering 3D 1 H-MRS imaging and scans from multicenter clinical trials wherein a large amount of data needs to be processed. For 1 H-MRS imaging to become a routine clinical tool, complete automation of quantification procedures and reduction of processing times close to real time are necessary. The processing time could be reduced by using a high-performance computing environment. This process is expensive, involves development of complicated algorithms, and is not an option in routine laboratory/clinical settings. Another approach is to develop fast methods, such as those based on artificial neural networks (ANN). ANN has been used to develop automated methods to quantify 1 H-MRS data. These techniques are limited to either single-voxel 1 H-MRS or magnitude spectral data acquired at long TE using lineshapes that may not be completely appropriate. Recently, Bhat and colleagues have used radial basis function neural networks to demonstrate the feasibility of quantifying short TE, phased 1 H-MRS imaging. This method is limited to ratios, however, and thus does not allow absolute concentrations to be measured.
Several excellent software packages, both free and commercial, are available for spectral quantification. The most commonly used analysis packages include LCModel, jMRUI, and MIDAS. Most of these packages involve minimal human intervention and are capable of providing absolute concentrations, but involve long processing times. Different analysis methods and their strengths and weaknesses in computing absolute brain metabolite concentrations were recently reviewed.
Because of relatively large spectroscopic voxels, spectra have contributions from different types of brain tissues, particularly cerebrospinal fluid (CSF). For accurate estimation of metabolite concentrations, it is important to determine the relative volumes of each tissue that contributes to a given spectroscopic voxel. This estimation requires combining the MRS imaging data with tissue segmentation, based on the high-resolution MR imaging data.
Application of magnetic resonance spectroscopy to multiple sclerosis
Lesions
There is a general consensus that chronic MS lesions exhibit reduced NAA levels, indicating neuronal/axonal loss. This observation is particularly true in those lesions that also appear hypointense on T1-weighted images (also commonly referred to as “black holes”). In one study, metabolite concentrations from chronic lesions of patients who had relapsing-remitting (RR)MS (n = 9), secondary progressive (SP)MS (n = 10), primary progressive (PP)MS (n = 6), and benign MS (BMS) (n = 5) were measured and compared with those from white matter of a normal control group (n = 9). A highly significant reduction in NA (the sum of NAA and NAAG) was found in patients who had RRMS, PPMS, and SPMS compared with controls. In patients who had BMS, however, there was no significant difference in NA compared with controls. A significant inverse correlation between NA from lesions in patients who had MS and disability was observed ( r = −0.364, .05> P >.02). Increased Cr and Cho levels were also observed in lesions, suggesting (1) ongoing gliosis and remyelination in isointense lesions on T1-weighted MR images, and (2) membrane turnover (de- and remyelination).
Acute MS lesions, as detected by gadolinium (Gd) enhancement, demonstrate a range of abnormalities on 1 H-MRS. These abnormalities include reduced NAA, increased Cho, and presence of lipids. Histopathology on biopsied brain tissues demonstrates reduced NAA levels even in the acute phase of the disease; this could be the result of axonal loss or reflect reversible axonal dysfunction attributable to functional impairment. Accordingly, serial MR imaging (with Gd administration) and 1 H-MRS imaging studies showed transient changes in NAA levels in some acute lesions, which recovered with time. Narayana and colleagues have observed that metabolite levels, including NAA, reach their minimum value when lesion volume reaches its maximum. This observation suggests that the observed decrease in metabolite concentrations, at least partially, can be attributed to presence of edema within the lesions and is not solely to compromised tissue metabolism. Cho levels are shown to increase in acute MS lesions, in addition to Lac and mI resonance intensities. The presence of lipids in some, but not all, lesions was reported in RRMS subjects by Narayana and colleagues, suggesting the presence of active demyelination/remyelination.
Normal-Appearing White Matter
It is now generally agreed, based on MRS, MT, and DTI studies, that the NAWM in patients who have MS is abnormal. By exploiting the large spatial coverage allowed by multivoxel 1 H-MRS, it has been demonstrated that metabolic abnormalities in patients who have MS are more diffuse and are not restricted to lesion sites alone. 1 H-MRS studies have clearly demonstrated reduced NAA levels in NAWM, suggesting axonal/neuronal loss/dysfunction as the underlying pathologic substrate. The reduced NAA levels on 1 H-MRS have been confirmed by histopathology as secondary to axonal loss. In serial 1 H-MRS studies, increased Cho and lipid levels were observed from NAWM regions that subsequently went on to develop MR imaging–visible lesions. These observations are consistent with MR imaging studies that showed alterations in MT ratio (MTR) values before appearance of macroscopic lesions on MR imaging. In addition, based on increased mI, Cr, and Cho levels, increased cellularity (gliosis, inflammation) was also postulated to occur in NAWM of patients who have MS.
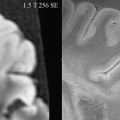
In a preliminary study, annual MRS imaging was acquired for 2 years from 20 patients and 10 healthy controls to characterize the metabolite changes in early RRMS. The concentrations of NAA, Cr, Cho, mI, and Glx were estimated in NAWM and cortical gray matter (cGM). At baseline, the concentration of NAA was 7% lower in NAWM of patients who had MS compared with the control group and 8.7% lower in cGM. Tissue metabolite profiles did not significantly change in subjects who had MS nor did they differ between subjects who had MS and healthy controls, with the exception of NAA concentrations that tended to recover from baseline. This study suggests that in the early phases of the disease the neuronal/axonal damage may be at least partially reversible. Leary and colleagues have performed single-voxel 1 H-MRS of NAWM in PPMS (n = 24) patients and in 16 age-matched controls. NAA/Cr was significantly lower in NAWM from patients than in the white matter from controls, suggesting that axonal loss occurs in NAWM in patients who have PPMS and may well be a factor associated with disease progression in this disease phenotype. No significant difference was observed in Cr concentration between patients and controls. A multicenter 1 H-MRS imaging study of 40 patients who had PPMS showed significantly lower NAA/Cr compared with healthy volunteers, but no significant difference between lesions and NAWM was observed. Twenty-four of these patients had evident lipid peaks in nonlesion brain tissue locations. Fig. 3 shows, as an example, the presence of strong lipid peaks in the spectra from normal appearing brain tissue of a patient who had PPMS. In another study, metabolite concentrations were obtained with 3D MRS and the VOI centered on the corpus callosum in 11 patients who had RRMS and 9 controls. In NAWM, the concentration of NAA was observed to be 9% lower in patients compared with controls. The same study showed an increase in Cr and Cho by 22% and 32%, respectively. These elevated Cho levels differentiated patients from controls with 100% specificity and greater than 90% sensitivity.
Suhy and colleagues compared metabolite levels in patients who had PPMS (n = 15) and RRMS (n = 13) with those of controls (n = 20). Cr in NAWM of patients who had PPMS was higher compared with controls ( P = .035) and patients who had RRMS ( P = .038). Also, Cr increased in focal lesions from PPMS compared with lesions from RRMS ( P = .044) and compared with control white matter ( P = .041). NAA was similarly reduced in NAWM from PPMS and RRMS compared with controls. The increased Cr in NAWM in PPMS relative to RRMS is consistent with the notion that the progressive disability in PPMS may be associated with gliosis and axonal loss, whereas disability in RRMS may be secondary to an increased burden of acute inflammatory lesions and axonal loss.
Data on NAWM in clinically isolated syndrome (CIS) are limited. In 14 of 42 patients who had a single acute episode of optic neuritis, Tourbah and colleagues reported decreased NAA, increased Cho, and the presence of lipids. In 96 patients who had CIS suggestive of MS, Fernando and colleagues reported increased concentration of mI relative to controls, a finding suggestive for the presence of gliosis. No significant difference in other metabolites was observed. In a prospective study on patients who had CIS suggestive of MS, Wattjes and colleagues studied 31 patients and 20 controls. These authors observed 8.1% decrease in NAA ( P = .012) in the NAWM of patients relative to controls. Changes in Cr, Cho, and mI were not observed.
Gray Matter
Cortical pathology in MS is well recognized. For several reasons GM lesions are difficult to visualize on MR imaging. Using advanced pulse sequences, such as double inversion recovery and phase-sensitive inversion recovery sequence, it is possible to visualize some, but not all, cortical lesions. Involvement of GM has been demonstrated by MTR, DTI, and 1 H-MRS studies.
1 H-MRS of cGM is technically challenging because of its proximity to CSF and partial volume averaging from white matter. In addition, many of the MRS studies that use outer volume suppression bands for minimizing contributions from nonneural tissues make it difficult to acquire MRS from the cGM that is close to the outer surface of the brain (see Fig. 1 ). Despite these limitations, MRS studies of cGM have been reported by a few groups. For example, Sharma and colleagues, by combining a double inversion recovery sequence in which both CSF and white matter were suppressed, demonstrated abnormalities in the cGM close to the midline fissure in patients who had MS using MRS imaging. By combining MRS imaging with image segmentation, this study has minimized contributions from WM and CSF to the VOI and showed in 52 patients who had RRMS marked lipid peaks arising from the normal-appearing GM, consistent with the presence of active demyelination/remyelination. No significant changes in major metabolite concentrations were observed compared with controls, however, suggesting no significant neuronal loss. The lack of significant changes of metabolites in cGM is consistent with another more recent report.
Using short TE MRS imaging in 16 patients who had RRMS with short disease duration (mean disease duration of 1.8 years; range 0.6–2.8 years), Kapellar and colleagues reported lower NAA ( P = .01) and mI ( P = .04) in cGM relative to controls. The reduced NAA in cGM suggested mild, but widespread, neuronal dysfunction or loss early on in the course of the disease. In another study from the same group of 24 clinically early (median Expanded Disability Status Scale [EDSS] 1.2; range 0.0–3.0) patients who had RRMS, Chard and colleagues reported significantly reduced NAA, Cho, and Glx. They also observed significant correlations between MS functional composite scores and the metabolite concentrations in cGM: Cr (r(s) = 0.524, P = .009), Glx (r(s) = 0.580, P = .003). No correlation was observed between clinical disability and the level of NAA, suggesting that reduced NAA reflects neuronal dysfunction, rather than neuronal loss, early on in RRMS.
GM NAA deficits were found in the progressive form of disease, which, however, did not significantly correlate with EDSS. In another study, absolute concentrations of NAA, Cr, and Cho were measured in the occipital-parietal cortex of patients who had RRMS (n = 15) and SPMS (n = 15) and healthy subjects (n = 8). Significantly lower values of NAA, Cr, and NAA/Cr ratio were detected in patients who had SPMS than in those who had RRMS and control subjects ( P <.01), suggesting that the pathologic process in MS extends into cGM, particularly in the progressive form of the disease. Similar observations were reported in a more recent study on a small MS cohort.
The levels of metabolites in the early stage of the disease seem to depend on lesion activity. In CIS suggestive of MS, Au Duong and colleagues reported that the metabolite levels in GM are associated with the presence of enhancing lesions: when absent, there was no statistically significant difference in the GM metabolite levels between patients and controls; when present, a relative decrease in NAA level and an increase in Cho level were observed. This finding suggests that metabolite alterations seen in the GM in the early phase of the disease may be secondary to the inflammatory process, rather than to primary neuronal dysfunction.
MS also affects deep GM structures. 1 H-MRS studies of the thalami were performed in patients who had RRMS (n = 14) and age-matched healthy controls (n = 14). Average NAA concentration in the thalami of patients who had RRMS was approximately 11% lower relative to controls ( P <.05). In addition, about 25% lower mean normalized thalamic volumes were observed in patients compared with controls ( P <.005). Decreases in thalamic NAA concentrations strongly correlated with thalamic volume loss. The reduction of NAA concentration and thalamic volume suggests a neurodegenerative component to MS that is increasingly recognized in the disease.
Application of magnetic resonance spectroscopy to multiple sclerosis
Lesions
There is a general consensus that chronic MS lesions exhibit reduced NAA levels, indicating neuronal/axonal loss. This observation is particularly true in those lesions that also appear hypointense on T1-weighted images (also commonly referred to as “black holes”). In one study, metabolite concentrations from chronic lesions of patients who had relapsing-remitting (RR)MS (n = 9), secondary progressive (SP)MS (n = 10), primary progressive (PP)MS (n = 6), and benign MS (BMS) (n = 5) were measured and compared with those from white matter of a normal control group (n = 9). A highly significant reduction in NA (the sum of NAA and NAAG) was found in patients who had RRMS, PPMS, and SPMS compared with controls. In patients who had BMS, however, there was no significant difference in NA compared with controls. A significant inverse correlation between NA from lesions in patients who had MS and disability was observed ( r = −0.364, .05> P >.02). Increased Cr and Cho levels were also observed in lesions, suggesting (1) ongoing gliosis and remyelination in isointense lesions on T1-weighted MR images, and (2) membrane turnover (de- and remyelination).
Acute MS lesions, as detected by gadolinium (Gd) enhancement, demonstrate a range of abnormalities on 1 H-MRS. These abnormalities include reduced NAA, increased Cho, and presence of lipids. Histopathology on biopsied brain tissues demonstrates reduced NAA levels even in the acute phase of the disease; this could be the result of axonal loss or reflect reversible axonal dysfunction attributable to functional impairment. Accordingly, serial MR imaging (with Gd administration) and 1 H-MRS imaging studies showed transient changes in NAA levels in some acute lesions, which recovered with time. Narayana and colleagues have observed that metabolite levels, including NAA, reach their minimum value when lesion volume reaches its maximum. This observation suggests that the observed decrease in metabolite concentrations, at least partially, can be attributed to presence of edema within the lesions and is not solely to compromised tissue metabolism. Cho levels are shown to increase in acute MS lesions, in addition to Lac and mI resonance intensities. The presence of lipids in some, but not all, lesions was reported in RRMS subjects by Narayana and colleagues, suggesting the presence of active demyelination/remyelination.
Normal-Appearing White Matter
It is now generally agreed, based on MRS, MT, and DTI studies, that the NAWM in patients who have MS is abnormal. By exploiting the large spatial coverage allowed by multivoxel 1 H-MRS, it has been demonstrated that metabolic abnormalities in patients who have MS are more diffuse and are not restricted to lesion sites alone. 1 H-MRS studies have clearly demonstrated reduced NAA levels in NAWM, suggesting axonal/neuronal loss/dysfunction as the underlying pathologic substrate. The reduced NAA levels on 1 H-MRS have been confirmed by histopathology as secondary to axonal loss. In serial 1 H-MRS studies, increased Cho and lipid levels were observed from NAWM regions that subsequently went on to develop MR imaging–visible lesions. These observations are consistent with MR imaging studies that showed alterations in MT ratio (MTR) values before appearance of macroscopic lesions on MR imaging. In addition, based on increased mI, Cr, and Cho levels, increased cellularity (gliosis, inflammation) was also postulated to occur in NAWM of patients who have MS.
In a preliminary study, annual MRS imaging was acquired for 2 years from 20 patients and 10 healthy controls to characterize the metabolite changes in early RRMS. The concentrations of NAA, Cr, Cho, mI, and Glx were estimated in NAWM and cortical gray matter (cGM). At baseline, the concentration of NAA was 7% lower in NAWM of patients who had MS compared with the control group and 8.7% lower in cGM. Tissue metabolite profiles did not significantly change in subjects who had MS nor did they differ between subjects who had MS and healthy controls, with the exception of NAA concentrations that tended to recover from baseline. This study suggests that in the early phases of the disease the neuronal/axonal damage may be at least partially reversible. Leary and colleagues have performed single-voxel 1 H-MRS of NAWM in PPMS (n = 24) patients and in 16 age-matched controls. NAA/Cr was significantly lower in NAWM from patients than in the white matter from controls, suggesting that axonal loss occurs in NAWM in patients who have PPMS and may well be a factor associated with disease progression in this disease phenotype. No significant difference was observed in Cr concentration between patients and controls. A multicenter 1 H-MRS imaging study of 40 patients who had PPMS showed significantly lower NAA/Cr compared with healthy volunteers, but no significant difference between lesions and NAWM was observed. Twenty-four of these patients had evident lipid peaks in nonlesion brain tissue locations. Fig. 3 shows, as an example, the presence of strong lipid peaks in the spectra from normal appearing brain tissue of a patient who had PPMS. In another study, metabolite concentrations were obtained with 3D MRS and the VOI centered on the corpus callosum in 11 patients who had RRMS and 9 controls. In NAWM, the concentration of NAA was observed to be 9% lower in patients compared with controls. The same study showed an increase in Cr and Cho by 22% and 32%, respectively. These elevated Cho levels differentiated patients from controls with 100% specificity and greater than 90% sensitivity.