Ieneke J.C. Hartmann, Cornelia M. Schaefer-Prokop
Pulmonary Circulation and Pulmonary Thromboembolism
Pulmonary Circulation
The pulmonary circulation is unique in many ways as its appearance reflects the patho-physiological unit of ventilation and perfusion, e.g. its response to hypoxia is arterial constriction as opposed to arterial dilatation in the systemic circulation. Secondly, the pulmonary vasculature is directly influenced by cardiac function and vice versa, as illustrated most prominently by venous congestion due to left heart failure or pulmonary hypertension causing right ventricular dysfunction or even failure. In addition it follows a dual flow model (both pulmonary and bronchial circulations supply the lung).
Appreciation of pulmonary anatomy and normal physiology enables a better understanding of abnormal conditions (and their relevant radiographic features).
Acute pulmonary embolism can be life threatening and has a high mortality if undiagnosed; chronic pulmonary embolism leads to pulmonary hypertension and right heart failure. Imaging plays a major role for diagnosing acute and chronic PE since clinical symptoms are frequently non-specific. The second half of this chapter is therefore devoted to demography, pathophysiology and imaging features of pulmonary thromboembolism.
Pulmonary Circulation Anatomy
Pulmonary Arteries
The pulmonary trunk originates from the right ventricle. In adults the main pulmonary artery measures approximately 5 cm in length and is entirely enveloped within the pericardium. At its base there is the pulmonary valve consisting of three cusps and preventing the blood flowing back at diastole. The pulmonary sinuses are situated between the cusps of the pulmonary valves and the dilation of the pulmonary arterial wall. These sinuses prevent the valves from sticking to the wall when they open.
At about the level of the fifth thoracic vertebra, it divides into the longer right and the shorter left pulmonary artery.
The left pulmonary artery runs superiorly over the left main bronchus to enter the left hilum. Within the hilum it may either continue directly into the left interlobar artery from which the segmental branches to the upper and lower lobe come off directly, or it may bifurcate into an ascending and descending branch. The ascending branch then divides almost immediately into the apico-posterior and anterior segmental branches which supply the left upper lobe. The descending branch gives a branch to the lingula which itself divides into two segmental arteries (superior and inferior lingular segmental artery). The next branch from the descending branch is the superior segmental artery, supplying the superior segment of the left lower lobe (segment 6). Subsequent branches supply the remaining 4 segments of the left lower lobe.
The right pulmonary artery runs under the aortic arch, posterior to the superior vena cava and anterior to the right main bronchus, and just before entering the hilum it divides into the ascending (truncus anterior) and the descending (interlobar) branch. The ascending branch divides into apical, anterior and posterior segmental branches. The posterior segmental branch may however also originate at the bifurcation of the right main pulmonary artery or the right descending trunk. The interlobar artery gives rise to the middle lobe artery (which further divides into the lateral and medial segmental branches) and the right lower lobe artery, which immediately gives off the artery to the superior segment of the right lower lobe. As on the left side, subsequent branches supply the remaining 4 segments of the right lower lobe.
The arterial branching follows and runs parallel to the divisions of the bronchial tree (and having the same name), supplying each bronchopulmonary segment. The branching pattern of the lobar and especially the segmental arteries shows a high variation, whereas for the more proximal arteries it is fairly constant. In addition, supernumerary (accessory) branches exist that are not accompanied by bronchial branches and give additional arterial supply to the lung parenchyma. These arteries are usually located in the periphery of the lung.
Normal sizes of the pulmonary arteries have been assessed with CT. There are some contradicting data on the correlation between pulmonary artery diameter and height, weight, BSI and age; in general, diameters tend to be slightly higher in men. According to the literature, in adults, the upper limit of normal for the diameter of the pulmonary trunk is 29–33 mm1–3 (for women 27 mm is suggested1), and for the right and left pulmonary artery 23 and 22 mm, respectively.3
The pulmonary artery-to-aorta ratio is used for the screening and evaluation of pulmonary hypertension: A PA-to-Ao ratio of >1 or 1.1 has been proposed as being suggestive of pulmonary hypertension, although data on the diagnostic accuracy of this ratio to PA pressures are contradicting.4 The PA-to-Ao ratio decreases with age because the ascending aortic diameter increases with age and body size, whereas the PA increases with body size only. In addition, the PA may enlarge in some diseases (e.g., pulmonary fibrosis) without a correlating increase in PA pressure.5 The pulmonary artery-to-bronchus ratio, which can be assessed on both plain chest film and CT, is especially helpful in the assessment of congestive heart failure and volume overload.6 It has been also suggested to be used for the assessment of pulmonary hypertension.
Pulmonary Veins
The pulmonary veins, classically two on each side, transport the oxygenated blood from the lung back to the left atrium of the heart. The veins run independently from the pulmonary arteries and bronchi towards the heart. The superior pulmonary veins drain the blood from the upper lobes, including the middle lobe on the right side; the inferior pulmonary veins drain the lower lobes. In addition, the veins from the visceral pleura drain into the pulmonary veins, whereas the veins of the parietal pleura drain into the systemic circulation via the veins of the thoracic wall. There is great interest in variations in pulmonary venous anatomy with regards to ablation of pacemaker centres,
Bronchial Arteries
Bronchial arteries supply various parts of the intrathoracic structures: they are responsible for the majority of oxygen supply to the bronchial tree from the central main bronchi to the respiratory bronchioles and lung parenchyma, the upper oesophagus, part of the pericardium, and the visceral pleura. The smallest, most peripheral branches anastomose with branches from the pulmonary arteries in the walls of the bronchioles and the visceral pleura. Systemic branches supplying the thoracic wall also supply the parietal pleura.
The place of origin as well as the number of the bronchial arteries is subject to considerable variation. In more than 70%, the bronchial arteries arise from the descending thoracic aorta, most commonly between the levels of T5 and T6. In most individuals there are 2 to 4 bronchial arteries present, arising either independently or from a common trunk.
The right bronchial artery usually (78%) arises within a common stem, with the first aortic intercostal (intercostobronchial artery) from the posteromedial aspect of the descending aorta. On the left side, there is generally a superior and an inferior branch, both arising from the anterior aspect of the descending thoracic aorta. The bronchial arteries run into the hilum, where they branch parallel and close to the bronchus to the peripheral airways. The diameter of these arteries is small, usually 1–1.5 mm at its origin within the mediastinum.
Anomalous bronchial arteries, defined as bronchial arteries that originate outside the levels of T5 and T6, are found in up to 21% of patients with haemoptysis.7 These anomalous arteries arise in the majority of cases from the aortic arch, less frequently from the lower part of the descending aorta or from major aortic branches such as the subclavian arteries, the thyrocervical trunk, brachiocephalic artery, or the internal mammary artery. Bronchial arteries can be distinguished from non-bronchial systemic arteries in that the first ones run into the pulmonary parenchyma parallel to the bronchi in contrast to the non-bronchial systemic collateral arteries. In the periphery, bronchial arteries arise form anastomoses with the pulmonary arteries.
Venous return occurs either via bronchial veins into the azygos vein (right side), accessory hemiazygos vein or left superior intercostal vein (left side), or via the bronchopulmonary arterial anastomoses into the pulmonary veins.
Pulmonary Circulation Physiology
The pulmonary circulation is, unlike the systemic circulation, a low-pressure system. There is only a relatively small pressure difference between the pulmonary arteries (mean pressure 12–20 mmHg) and the left atrium (7–12 mmHg). The pressure in the capillaries and the veins approximates the pressure in the left atrium. That is the reason why elevated pressure in the left ventricle / left atrium (e.g. mitral valve disease) leads via the capillary bed to an increased pulmonary artery pressure.
As with the airways, the cross-sectional area of the pulmonary vasculature increases towards the periphery of the lung. The resistance in the capillaries contributes considerably to the whole vascular resistance. At rest, only one-third of the capillaries are perfused; with increasing cardiac output under stress, the remaining capillaries will be recruited by increasing pressure in order to contribute to gas exchange.
The hydrostatic pressure within the pulmonary capillaries tends to force fluid into the interstitium of the lung. This is partly counteracted by the plasma oncotic (colloid osmotic) pressure, which attracts fluid back into the capillaries. Imbalance of these pressure ratios can lead to abnormal fluid shift and thus overflow of fluid into the lung parenchyma. The pulmonary interstitial space is usually kept dry by pulmonary lymphatic channels. They drain any excess fluid which enters the interstitium from the alveoli, and their capacity can increase by a factor of ten if needed (e.g. chronic cardiac insufficiency).8 However, if the rate of accumulation of fluid exceeds the capacity of lymphatic clearance, fluid will begin to accumulatewithin the interstitium. If this process continues, it leads to alveolar fluid accumulation when gas exchange may become compromised (gas exchange is not usually compromised by the presence of interstitial oedema alone).
An important difference between the pulmonary and systemic vasculature is the response to hypoxia. In the pulmonary system hypoxia results in local vasoconstriction, causing diversion of blood to regions of better ventilation.9
Although contrary to the vascular response in the rest of the body, this mechanism serves to protect the alveolar–arteriolar pO2 balance and thus to minimise ventilation–perfusion differences in cases of diffuse and regional disease; i.e. it supplies blood to regions of the lung that will most efficiently oxygenate it. This homeostatic mechanism (Euler–Liljestrand reflex) is responsible for ‘matched defects’ seen in cases of pneumonic consolidation on ventilation–perfusion imaging. This mechanism is also responsible for different vascular calibres in patients with lobular air trapping, as seen in ‘mosaic perfusion’ caused by pulmonary embolism.
The bronchial arteries primarily perfuse airways, pulmonary vessel walls, interstitium and pleura. While the more centrally localised bronchial veins drain into the right atrium, the peripherally located smaller bronchial veins drain into the left atrium. This explains why increased left atrial pressure during left heart failure causes bronchial wall thickening (cuffing).
The blood circulation is influenced by gravity and body position. In the upright position, most blood perfusion volume is in the basal part of the lung as illustrated by increased lung parenchyma density and larger vessel calibres. In the apical part of the lung (zone I) the intra-alveolar pressure is larger than the intravenous and intra-arterial pressure independent of ventilation and blood volume. In the basal part of the lung (zone III) intravenous and intra-arterial pressure exceed the intra-alveolar pressure. In the middle part (zone II) the intra-arterial pressure is higher than the intra-alveolar pressure followed by the intravenous pressure. In a lying position zone I is ventrally localised and zone III dorsally accompanied by an apico-basal gradient. In case of acute volume overload or left cardiac failure, especially the vessels in zone III are affected.10
Pulmonary Vascular Patterns
Pulmonary Venous Hypertension
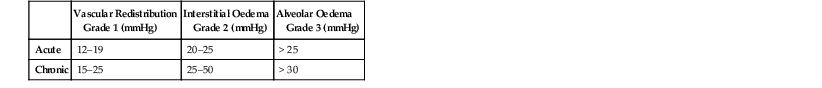
Pulmonary venous hypertension (PVH) is caused by increased resistance in the pulmonary veins and is defined by an elevation of the mean pressure > 12 mmHg. An increased venous pressure automatically leads to an increased capillary pressure. Increase of the mean PVH to 12–20 mmHg results in a redistribution of blood volume (grade 1), a PVH of 20–25 mmHg to an interstitial oedema (grade 2) and a PVH of > 25–30 mmHg to an alveolar oedema (grade 3).
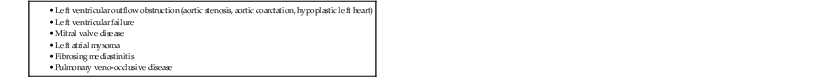
The most common reason, by far, is left-sided heart disease (Table 23-1) due to left ventricular failure, mitral valve disease, or aortic valve disease. The severity of mitral valve stenosis can be non-invasively gauged by assessing the degree of PVH. In cases of aortic valve disease, however, the degree of PVH is more indicative of myocardial failure than severity of stenosis. It has to be noted that an increased left ventricular pressure load does not immediately result in PVH. Only an elevated end-diastolic left ventricular pressure leads to elevation of the left atrial pressure and subsequently to PVH. The pulmonary venous pressure can be estimated from the pulmonary artery wedge pressure (PAWP) using a Swan-Ganz catheter and is usually < 12 mmHg.
The radiological findings can be thought of as a progressive series of changes that occur in response to the underlying changes in physiology.11,12
Three grades of severity of pulmonary congestion are differentiated (Table 23-2).
Vascular Redistribution (Grade 1)
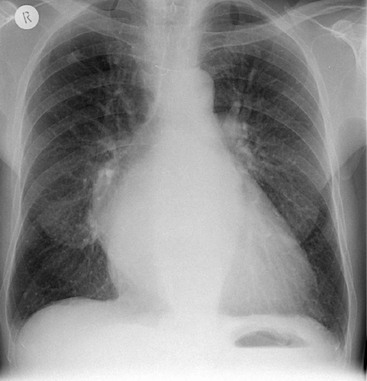
As pulmonary venous pressure rises, the upper lobe veins distend. They initially reach the size of, and eventually become larger than, the lower lobe vessels (thus reversing the normal ‘gravity-dependent’ pattern). This is described as ‘upper lobe venous diversion’ and is often the first recognised radiological sign of pulmonary venous hypertension (Fig. 23-1). The same vascular calibres of upper and lower lobe veins do not indicate increased PVH if seen in a bedside radiograph.
Patients suffering from their first episode of acute PVH elevation tend to immediately develop an interstitial or alveolar oedema. Only recurrent periods or chronically increased PVH result in distended veins.
Interstitial Oedema (Grade 2)
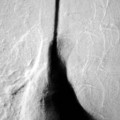
If the pulmonary venous pressure continues to rise and exceeds the plasma oncotic pressure, fluid will begin to accumulate in the lung interstitium. This is known as interstitial pulmonary oedema. Typical radiological signs of an interstitial oedema are interstitial (Kerley) lines (Fig. 23-2) caused by thickening of the interlobular septa as a result of fluid accumulation within the lung.
Kerley B lines are the most obvious ones and are short (1 cm or less) interlobular septal lines, found predominantly in the lower zones peripherally, and parallel to each other but at right angles to the pleural surface. Kerley A lines are deep septal lines (lymphatic channels), radiating from the periphery (not reaching the pleura) into the central portions of the lung and approximately 4 cm long. Their presence normally indicates a more acute or severe degree of oedema.
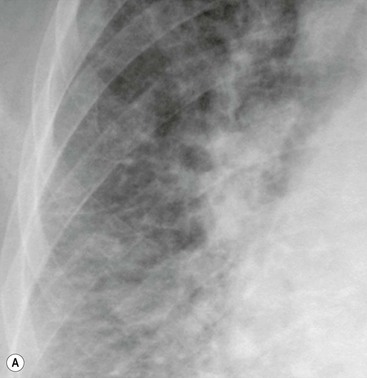
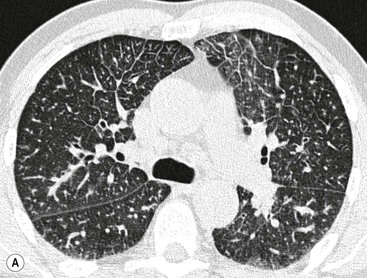
Septal lines can be differentiated from blood vessels as the latter are not visible in the outer 1 cm of the lung. In addition, deep septal lines do not branch uniformly (as is the case for blood vessels) and are seen with a greater clarity (as they represent a sheet of tissue) than a blood vessel of similar calibre (Fig. 23-3A).
Under normal circumstances septal lines caused by interstitial fluid overload would be expected to disappear after suitable reduction in pulmonary venous pressure. Exceptionally, however, they may persist, e.g. in long-standing PVH, where haemosiderin deposition or fibrosis has occurred. Other causes of persistent septal lines include idiopathic interstitial fibrosis, lymphangitis carcinomatosa and pneumoconiosis.
Other signs of interstitial fluid overload include perihilar haze (loss of visible clarity of the lower lobe and hilar vessels), peribronchial cuffing (apparent thickening of proximal bronchial walls as a result of interstitial fluid accumulating around their walls) and thickening of the interlobar fissure due to thickened subpleural interstitium (to differentiate from interlobar pleural effusion).
Alveolar Oedema (Grade 3)
As the pulmonary venous pressure continues to increase fluid begins to accumulate in the alveolar spaces. This is termed alveolar oedema. Kerley B lines, airspace nodules, bilateral symmetric consolidation in the mid and lower lung zones and pleural effusions may be seen.
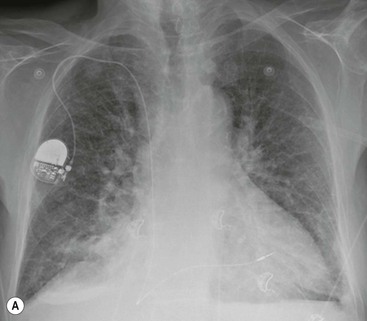
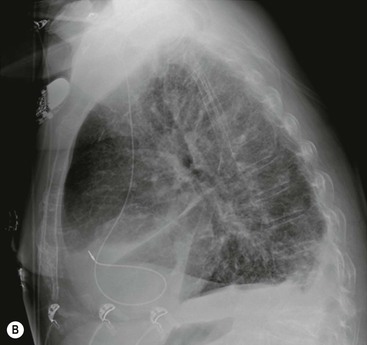
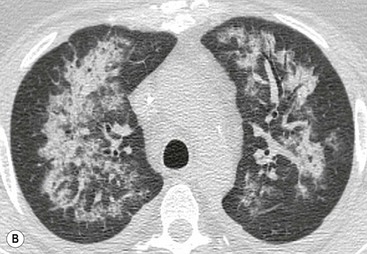
Depending on the amount of alveolar fluid overload, there are many variations of increased lung density, ranging from subtle haziness to dense consolidations with air bronchograms (Fig. 23-3B).
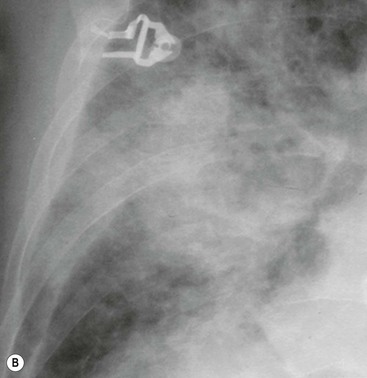
Certain patterns of opacification may suggest particular diagnoses.13 The often-cited ‘perihilar bat’s wing’ pattern of airspace consolidation is seen most commonly in left ventricular and renal failure, whereas alveolar oedema localised to the right upper zone is suggestive of severe mitral regurgitation (Fig. 23-4). The latter is thought to be a result of predominant regurgitant blood flow in the right upper lobe pulmonary vein, from the superiorly and posteriorly positioned mitral valve. A predominantly upper lobe oedema is seen in patients with a severe head trauma (neurogenic oedema). Alveolar fluid accumulation changes with patient position and gravity: asymmetric consolidations mimicking a pneumonia may be the result of left- or right-sided position of the patient.
Computed tomography (CT) findings of oedema are similar as the radiographic findings, although very atypical patterns are possible, causing differential diagnostic difficulties.14,15
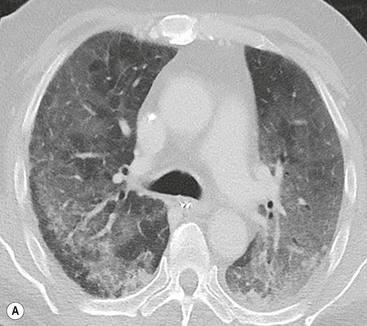
An interstitial oedema is characterised by (smoothly) thickened interlobular septa that do not follow the hydrostatic gradient (Fig. 23-5A). Also the peribronchovascular interstitium is thickened to be seen best in the perihilar area. Mostly, there is also at least subtle increased parenchymal density due to alveolar fluid overload.
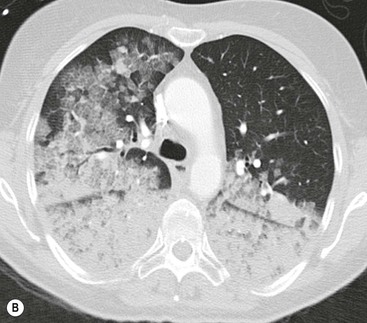
Alveolar oedema may initially be recognised as peribronchovascular airspace nodules progressing to diffuse ground-glass or dense airspace consolidation (Fig. 23-5B). Increased density may follow a ventrodorsal gradient but can also be localised predominantly perhilar or in a patchy distribution, the latter causing sometimes quite atypical patterns (Fig. 23-6).
In chronic pulmonary venous hypertension signs of pulmonary arterial hypertension may also develop. In addition, a fine nodular ‘interstitial’ pattern may appear throughout both lungs. These nodules represent haemosiderin deposition. This pattern was previously most commonly seen in patients with long-standing severe mitral stenosis.
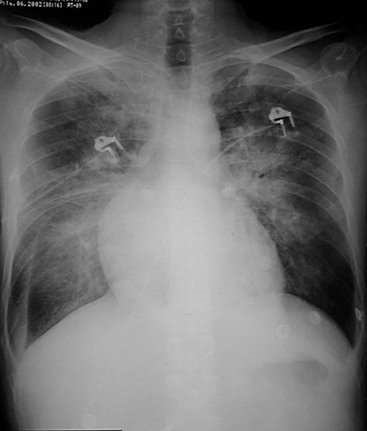
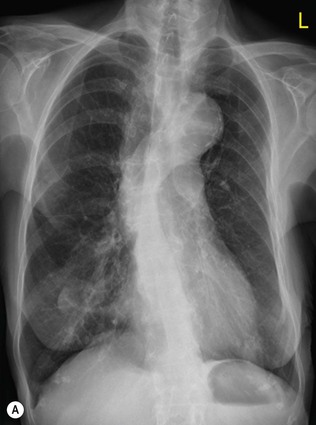
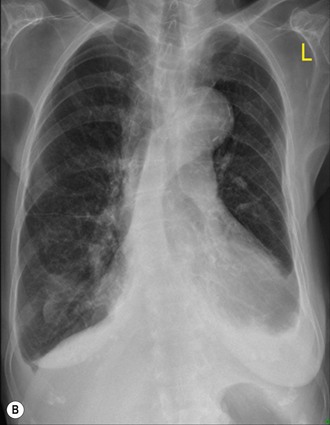
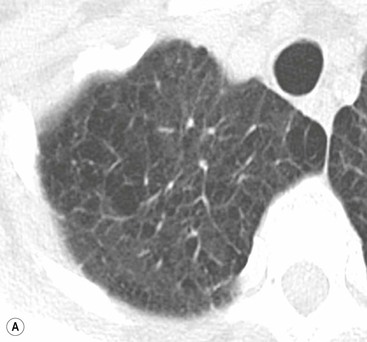
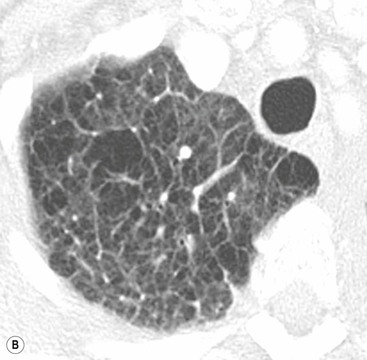
Pre-existing underlying lung disease influences the pattern and distribution of oedema, Patients with extensive emphysema do not develop homogeneous consolidation; even though degree of pulmonary venous pressure or fluid overload would otherwise lead to an alveolar oedema, the fluid remains within the interstitium, leading to thickened septa and a rather ‘interstitial’ fluid distribution, meaning that the radiographic appearance may lead to underestimation of the severity of oedema in these patients (Figs. 23-7 and 23-8).
Although most cases of PVH are associated with valvular and/or myocardial dysfunction leading to cardiomegaly, this is not always the case. An important example of this is in the early post-myocardial first 24–48 h post-infarction. This is due to an acute decrease in myocardial compliance, which essentially resolves in the first week post-infarction. Other situations where signs of pulmonary oedema may be seen associated with a normal heart size is in patients with non-cardiogenic pulmonary oedema, in patients with acute overhydration or drug-induced lung oedema (e.g. heroin, aspirin, nitrofurantoin).
Cardiogenic oedema has to be differentiated from other underlying diseases resulting in an imbalance of hydrostatic pressure, colloid osmotic pressure or capillary permeability, all of them resulting in pulmonary oedema (Table 23-3).
TABLE 23-3
Differential Diagnosis of Pulmonary Oedema
Pulmonary Arterial Hypertension
Pulmonary hypertension (PH) is a progressive disease leading to substantial morbidity and mortality. PH results from a number of diseases with different pathophysiologies, treatments and prognosis. Diagnosis is often delayed because of the non-specificity of clinical symptoms. Imaging (HRCT, CTPA and MRI) play a crucial role in the diagnostic work-up of pulmonary hypertension and are particularly important for identifying patients with recurrent or chronic pulmonary thromboembolism and for assessing the feasibility of pulmonary thrombendarterectomy.16
PH is a clinical and haemodynamic syndrome that results in increased vascular resistance in the pulmonary circulation, usually involving a combination of vasoconstriction and remodelling of the small vessels. Haemodynamically it is defined as a systolic pulmonary artery pressure of > 35 mmHg or a mean pulmonary artery pressure of > 25 mmHg at rest or > 30 mmHg with exertion. An increase in pulmonary vascular resistance and subsequent compensatory right ventricular (RV) hypertrophy lead to elevated pulmonary pressure, which often results in increased RV afterload and failure. The disorder is progressive, leading to right heart failure and death within a medium of 2.8 years after diagnosis.17,18
PH can be found in multiple clinical conditions. The current classification of PH (Table 23-4) was developed at the 4th World Symposium on Pulmonary Hypertension in Dana Point, CA, in 2008 and represents a modification of the previous Venice classification. The goal of the new classification is to group together different manifestations of disease sharing similarities in pathophysiological mechanisms, clinical presentation and therapeutic approaches.19
TABLE 23-4
Classification of Pulmonary Hypertension According to the 4th World Symposium in Dana Point, CA in 2008
Group 1 describes the group of patients with pulmonary arterial hypertension (PAH) characterised by the presence of pre-capillary PH in the absence of other causes of PH due to lung diseases (groups 3 and 5), chronic PE (group 4) or other rare diseases (group 5). Group 1 PAH have a mean pulmonary artery pressure > 25 mmHg and a pulmonary capillary wedge pressure < 15 mmHg, and comprises idiopathic and heritable PH, PH in association with connective tissue diseases, HIV infection, portal hypertension or rare diseases such as pulmonary veno-occlusive disease and/or pulmonary capillary haemangiomatosis.
Group 2 comprises patients with PH due to left heart disease, causing an increased pulmonary artery pressure and an elevated pulmonary capillary wedge pressure > 15 mmHg (Table 23-5).20
TABLE 23-5
Haemodynmic Definitions of Pulmonary Hypertension (PH)
| Definition | Haemodynamic Characteristics | Clinical Groups (see Table 23-3) |
| PH | P – PA > 25 mmHg | All |
| Pre-capillary PH | P – PA > 25 mmHg P – PCW < 15 mmHg CO: normal or reduced | 1—PAH 3—PH due to lung diseases 4—CTEPH 5—PH with unclear/multifactorial mechanisms |
| Post-capillary PH | P – PA > 25 mm HG P – PCW > 15 mmHg CO: normal or reduced | 2—PH due to left heart disease |
P – PA = mean pulmonary artery pressure; P – PCW = pulmonary capillary wedge pressure; CO = cardiac output.
The diagnostic work-up of patients with PH includes a medical history, physical examination, echocardiogram, cardiac catheterisation and advanced imaging such as CT, MR and scintigraphy.
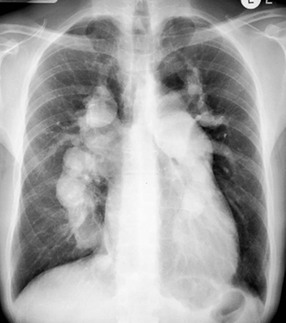
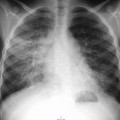
Radiographically, cardiac enlargement (right atrial and ventricular enlargement), enlargement of the central pulmonary arteries (main pulmonary artery and its branches down to the segmental level) (Fig. 23-9) and tapering of peripheral arterial branches (vessels beyond segmental level)—termed ‘peripheral pruning’—are seen. In long-standing cases the central pulmonary arteries may develop calcification due to atheroma, which is a feature not seen in non-hypertensive pulmonary arteries. Central arterial enlargement may mimic enlarged hilar lymph nodes. However, careful scrutiny usually allows differentiation, as lymphadenopathy characteristically has a lobulated border whereas arterial enlargement has a smoother outline. A recognised method of assessing pulmonary arterial size is by measuring the size of the right descending pulmonary artery. Enlargement may be diagnosed if the transverse diameter of the artery at its midpoint is greater than 17 mm. Although it is not known at what exact stage PH causes visible changes on a CXR, it is likely that they become apparent only in severe stages of PH. Overall, although relatively specific, the sensitivity of chest radiography for the diagnosis of (mild) PAH is therefore low.
Related posts:
Stay updated, free articles. Join our Telegram channel

Full access? Get Clinical Tree


