GOALS OF DASHBOARDS
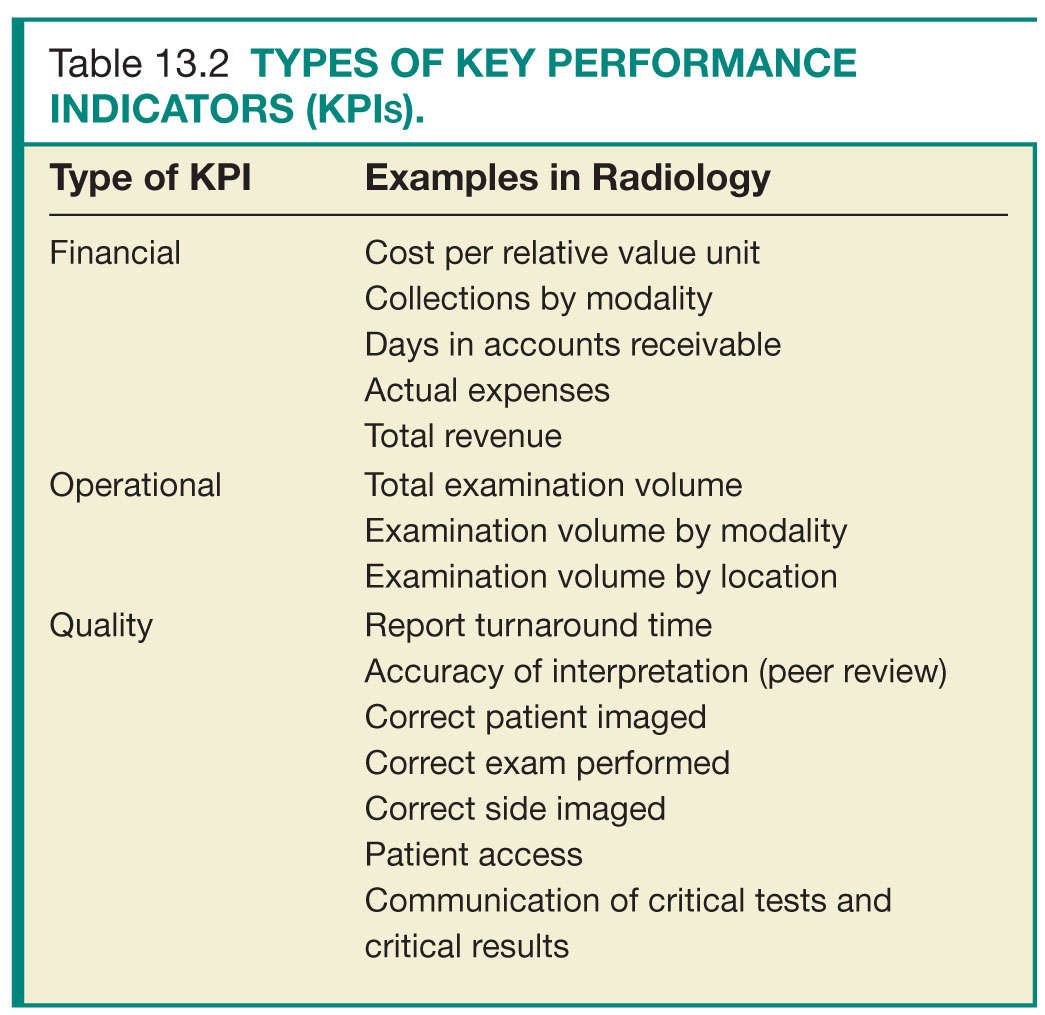
The primary reason for developing a dashboard should be focused and defined upfront. Limiting objectives can allow managers to quickly identify critical issues and allocate appropriate resources to key issues. Objectives usually fall into one of three categories: financial, operational, and quality (Table 13.2).7,8 Common financial KPIs include cost per relative value unit (RVU), collections by modality, days in accounts receivable, actual expenses, and total revenue. Operational KPIs include total examination volume, examination volume per modality, and examination volume per location. Quality KPIs include TAT, accuracy of interpretation (peer review), correct exam, patient access, and prompt communication of critical tests and critical results.6,9
DESIGNING A DASHBOARD
For a dashboard to be useful, it must contain meaningful information that can be acted upon promptly. Thus, a clear mission must be in place when designing a dashboard (Fig. 13.1). First, a team of major stakeholders should be assembled, consisting of key leaders including physicians, nurses, technologists, and information technology (IT), financial, and operations managers.10 Having representation from all aspects of a practice can ensure that common goals are set and are aligned with the goals of the overarching organization, that appropriate KPIs are included, and that functionality can meet expectations. Furthermore, investing in the initial planning stage can reduce both dashboard development time and need for redesign.11,12
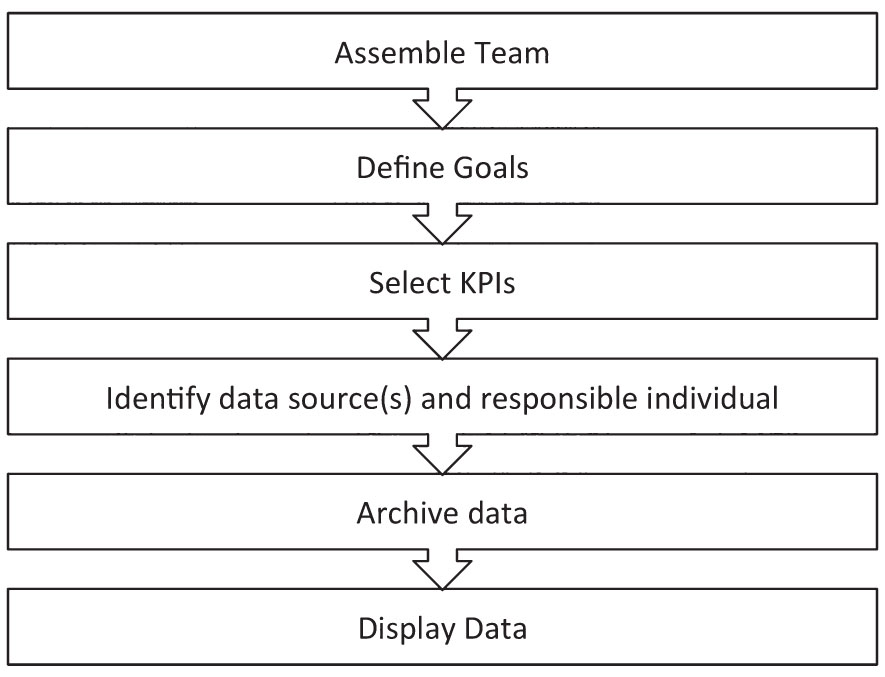
FIG. 13.1 ● Process of creating a quality dashboard. KPI, key performance indicator.
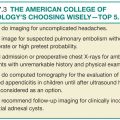
After assembling the dashboard design team and defining the goals of the dashboard, specific KPIs need to be selected to include on the dashboard. Chosen KPIs should be aligned to the goals of the dashboard, relevant to the specific practice, and draw from data that can be readily obtained.13–15 KPIs that are part of regulatory requirements, such as those needed for accreditation and credentialing, should be flagged and included on the dashboard so that these can be actively monitored and reported on (Fig. 13.2).3,13 Having too few KPIs can lead to a dashboard with little utility, whereas selecting too many KPIs can result in a dashboard that is too “busy” to be useful for review at a glance. A dashboard consisting of 15 to 25 KPIs is optimal.7
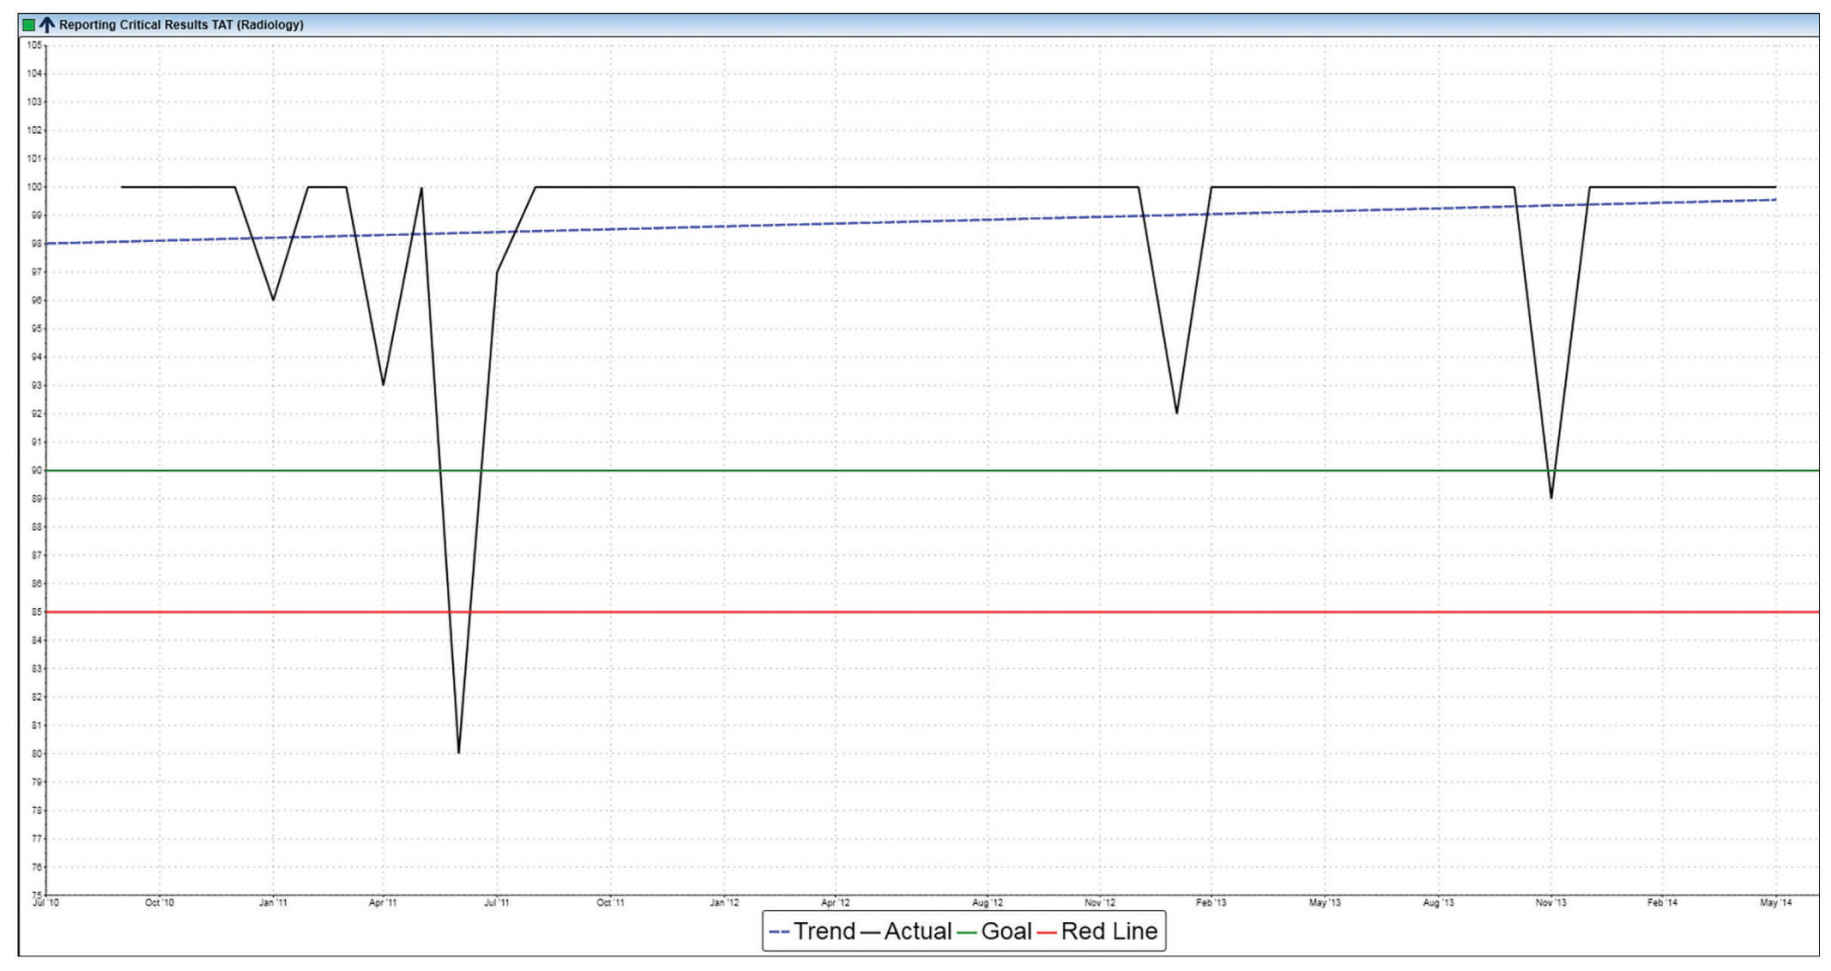
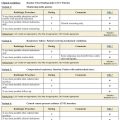
FIG. 13.2 ● Example display of critical result reporting, a regulatory requirement put forth by The Joint Commission.
Once KPIs have been selected, data need to be readily accessible and accurate. Dashboard data are frequently pooled from various sources, including the radiology information system (RIS), hospital information system (HIS), picture archiving and communications system (PACS), and billing and other financial software. External data, such as patient satisfaction data, may also be incorporated into a dashboard. Definitions of selected KPIs should follow accepted standards and definitions across the industry so that KPIs can be compared to local, regional, and national benchmark data.16 Identifying the data source for each KPI and the individual responsible for each KPI should be established up front.10
Data should be archived in standard formats (such as a structured query language [SQL] database or comma-separated values [CSV]) so that they can be easily shared, manipulated, and integrated into the dashboard. Security of dashboard data should be maintained on the basis of institutional IT security policies, and Health Insurance Portability and Accountability Act (HIPAA) standards should be followed at all times to safeguard patient privacy.17
To facilitate viewing of a dashboard, data should ideally be organized into sections. A radiology department’s dashboard could be organized into three sections: user-level data, sectional- or divisional-level data, and departmental- or health-care system–level data.18 Alternatively, the dashboard could be aligned with major institutional goals (Fig. 13.3). Using the example of report TAT, individual radiologists could use a dashboard to view their own mean report TAT and compare it with the practice as a whole. Section chiefs could view individual and composite TAT for their respective group and compare with other sections (Fig. 13.4). Department vice chairs or chairs could view report TAT performance for all sections and the department as a whole (Fig. 13.5).
Related posts:


Stay updated, free articles. Join our Telegram channel

Full access? Get Clinical Tree


