(4.1)
where A(t) is the arterial activity as a function of measurement time (t), τ is time, k u is the unidirectional influx rate, and V n is the initial distribution volume for the tracer which is the space of the exchangeable region plus the plasma space. Dividing Eq. 4.1 by A(t) yields
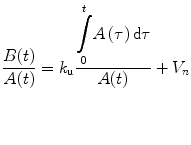
(4.2)
The graphical approach by plotting B(t)/A(t) versus ∫ 0 t A(τ)/A(t) from each group of data gives an unidirectional influx rate of k u as a slope of a straight line and V n as the ordinate intercept of this line. This graphical Patlak-Gjedde analysis (Patlak et al. 1983; Patlak and Blasberg 1985) does not require the determination of a specific compartment model.
4.2.2 Brain Perfusion Index (BPI)
In this method, the passage through the thoracic aorta to the brain is monitored after bolus injection of a 99mTc-labeled tracer into the right brachial vein using a large-field gamma camera. Following the injection, a sequence of 100 frames at 1-s intervals is started in a 128 × 128 format, with the patient lying in the supine position, facing the detector (Fig. 4.1).
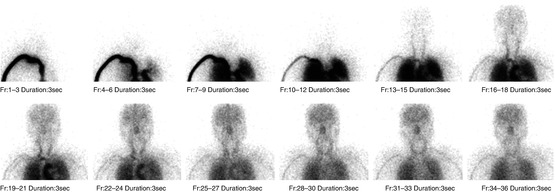

Fig. 4.1
Radionuclide angiography of 99mTc-ECD. The passage through the thoracic aorta to the brain is monitored using a large-field gamma camera. A sequence of 100 frames at 1 s intervals is acquired. Each sequential image of merged three frames is shown
Regions of interest (ROI) are hand-drawn over the aortic arch (ROIaorta) and bilateral brain hemispheres (ROIbrain). The size of the ROIs is approximately 55 pixels and 300 pixels for ROIaorta and ROIbrain, respectively. The activity of the aortic arch is monitored instead of the arterial activity to minimize the invasiveness of the procedure without the need for arterial blood sampling. Time-activity curves for these ROIs are processed with a five-point smoothing technique. Then, the time delay of the brain activity to the aortic arch activity is corrected by shifting the brain activity curve to the left to match the peak times or ascending parts of both curves.
In this graphical approach, a linear phase is discernible during an 8- to 12-s period within the first 30 s after tracer injection, indicating the presence of unidirectional tracer uptake (Fig. 4.2). Thereafter the tracer transfer into the brain is less than expected if transport into the brain tissue continues to be unidirectional. The divergence of expected and measured activities reflects both the loss of radioactivity from the brain to blood and the rapid decrease of the lipophilic content of the tracer in the blood.
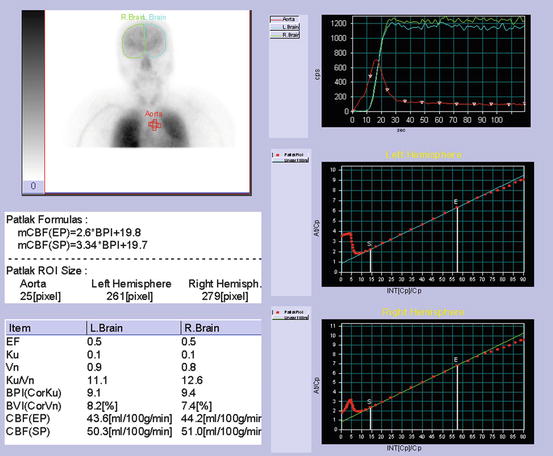

Fig. 4.2
Determination of brain perfusion index. Regions of interest (ROI) are hand-drawn over the aortic arch and bilateral brain hemispheres. Patlak-Gjedde graphical analysis of time-activity curves for the aorta and brain provides a linear phase during an 8–12 s period within the first 30 s after tracer injection. Brain perfusion index is calculated from graphically obtained slope (ku) after correction of size of ROIs for brain hemisphere and aortic arch
Graphically obtained slope (k u) according to Eq. 4.2 depends on the size ratio of ROIbrain to ROIaorta. To eliminate this dependence a brain perfusion index (BPI) is developed as follows, where the size ratio of ROIbrain to ROIaorta is set to 10 for standardization. This standardization makes it possible to compare BPI among subjects.


(4.3)
Direct comparison of BPI for 99mTc-HMPAO with that for 99mTc-ECD in the same individuals demonstrated a highly significant correlation between these two tracers but approximately 7 % lower BPI values for 99mTc-ECD than those for 99mTc-HMPAO (Matsuda et al. 1995). This lower BPI might be due to low first-pass brain extraction for 99mTc-ECD as compared with that for 99mTc-HMPAO. Friberg et al. (1994) reported an average first-pass extraction ratio of 0.60 for 99mTc-ECD when CBF was 46 ml/100 g/min, while Andersen et al. (1988) reported a higher average first-pass brain extraction ratio of 0.72 for 99mTc-HMPAO when CBF was 59 ml/100 g/min. BPI represents the unidirectional influx rate from the blood to the brain, which is proportional to a product of CBF and the first-pass extraction ratio. Thus, BPI depends on the first-pass extraction ratio for the used tracer under constant CBF. However, differences between 99mTc-ECD BPI and 99mTc-HMPAO BPI were smaller than were expected from the difference in the first-pass extraction ratios, possibly attributable to a difference in radiochemical purity between the two tracers. The radiochemical purity of 99mTc-HMPAO is somewhat lower than that of 99mTc-ECD. The lower the radiochemical purity, the smaller BPI becomes.
Reproducibility for calculation of BPI was evaluated. To determine the influence of ROI selection and curve shift for correction of time delay of brain and aortic arch curves, independent observers conducted a repeat analysis of the same radionuclide angiograms. Intra-observer coefficients of variation ranged from 4.0 % (Matsuda et al. 1992) to 5.3, 5.6, and 7.9 % (Van Laere et al. 1999). Interobserver coefficient of variation was reported to be 4.8 % (Zaknun et al. 2008). Automated setting of ROIaorta can improve both intra- and interobserver reproducibility particularly for naive observers (Groiselle et al. 2000).
Attention must be paid to dead time count loss by gamma camera during radionuclide angiography. The brain activity curve is inevitably delayed in relation to the aortic arch activity curve. The total count rate is higher during estimation of activity in the aortic arch than during estimation of cerebral activity. Most of the injected tracer is present in the field soon after the injection, and thus counting efficiency is lower during the estimation of aortic arch activity. Arterial input appears to be underestimated due to excessive count loss, resulting in overestimation of BPI by over 3 % when injecting 370 MBq of 99mTc-labeled tracers (Inoue et al. 1997).
4.2.3 Comparison of BPI and CBF Values Measured by Other Invasive Methods
Hemispheric BPI values for 99mTc-HMPAO and CBF values obtained from dynamic SPECT measurements by the 133Xe inhalation method were compared in 38 hemispheres of 19 same individuals (Matsuda et al. 1992). BPI values showed a highly significant positive correlation (correlation coefficient = 0.926) with global CBF (gCBF) obtained from the early picture method in a 133Xe-SPECT study. The regression line equation is global CBF = 2.75*BPI + 17.7.
In comparison with CBF values measured using123I-IMP SPECT with continuous arterial blood sampling (Murase et al. 1999), BPI showed significant correlation coefficients of 0.629 and 0.856 for 99mTc-HMPAO and 99mTc-ECD, respectively.
In comparison with CBF values measured using H2 15O PET with continuous arterial blood sampling (Takasawa et al. 2004), BPI for 99mTc-HMPAO showed a significant correlation coefficient of 0.831.
4.2.4 Alternative Approach to Estimation of BPI
Murase et al. (1999, 2001) proposed spectral analysis for the estimation of BPI using radionuclide angiography for 99mTc-labeled tracers. This analysis has been mostly applied to dynamic positron emission tomography measurements. This analysis has been introduced as a non-compartmental tracer kinetic modeling technique, which can be used to characterize the reversible and irreversible components of acyclic, connected systems and to estimate the minimum number of compartments. This technique is applicable to systems in which the measured data can be expressed as a positively weighted sum of convolution integrals of the input function with an exponential function that has real-valued nonpositive decay constants. BPI measured using graphical analysis and spectral analysis showed highly significant correlations (Murase et al. 1999; Van Laere et al. 2001) with equal interobserver reproducibility (Takasawa et al. 2003). Since BPI measured using spectral analysis appears to be proportional to CBF because of independence from the first-pass brain extraction ratio, it is larger by over 20 % and more highly correlated to CBF values obtained from 123I-IMP SPECT with continuous arterial blood sampling than BPI measured using graphical analysis (Murase et al. 1999). These results suggest that spectral analysis provides a more reliable BPI than graphical analysis particularly in acetazolamide challenge (Takasawa et al. 2002). However, this spectral analysis has not been prevailed to users because of unavailability of an automated program.
4.2.5 Calculation of Regional CBF from BPI
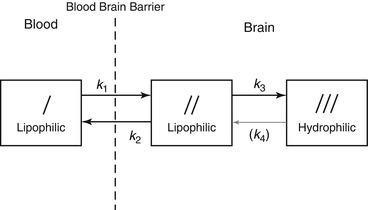
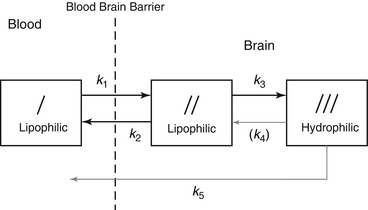
To calculate regional CBF (rCBF) and to correct for incomplete retention of 99mTc-labeled tracers in the brain, Lassen et al. (1988) proposed the following linearization algorithm of a curve-linear relationship between the brain activity and CBF. This algorithm is based on kinetic models for 99mTc-HMPAO (Fig. 4.3) and 99mTc-ECD (Fig. 4.4):
![$$ {F}_i=\frac{F_r\cdot \alpha \cdot \left({C}_i/{C}_r\right)}{\left[1+\alpha -\left({C}_i/{C}_r\right)\right]} $$](/wp-content/uploads/2016/09/A308863_1_En_4_Chapter_Equ4.gif)
where F i and F r represent rCBF values for a region i and a reference region, respectively, and C i and C r are the SPECT counts for the region i and the reference region, respectively. Acquisition of SPECT data usually starts at 10 min after tracer injection. Global brain is used as the reference region in this method. α is a correction factor for the linearization. The optimum value of the correction factor α is estimated from the following equations:


where k 3 is the conversion rate constant from lipophilic to hydrophilic tracer in the brain, k 2r is the rate of the back diffusion from a reference region in the brain to the blood, and K 1r is the influx rate constant from the blood to a reference region in the brain. λ is the brain-blood partition coefficient of the lipophilic tracer, and E describes the first-pass brain extraction of the lipophilic tracer across the blood-brain barrier. Average values for these rate constants and λ have been reported (Table 4.1). Lassen’s correction algorithm assumes that k 3 and λ are the same in all regions. k 3 and λ were set to the reported mean values of 0.80 and 0.67 for 99mTc-HMPAO and 0.57 and 1.33 for 99mTc-ECD, respectively. An almost threefold smaller k2r value for 99mTc-ECD than that for 99mTc-HMPAO results in the higher default α value of 2.6 in the linearization algorithm for 99mTc-ECD than the default α value of 1.5 in that for 99mTc-HMPAO. When CBF in the reference region ranged from 20 to 60 ml/100 g/min, optimum α values estimated using Eqs. 4.5 and 4.6 ranged from 3.2 to 1.2 for 99mTc-HMPAO and from 6.3 to 2.1 for 99mTc-ECD. The use of the fixed α value in the linearization algorithm gives rise to deviation of the obtained rCBF values from true rCBF values when using optimized α values that vary with CBF in a reference region. However, less deviation of obtained rCBF values from true values may be expected in the presence of a higher α value.

Fig. 4.3
Three-compartment unit-membrane model of solute exchange of lipophilic 99mTc-HMPAO. The first compartment is the freely diffusible lipophilic tracer in the blood pool outside the brain. The second compartment is the freely diffusible lipophilic tracer inside the brain. The third compartment is the hydrophilic form retained in the brain. K 1 is the influx constant, k 2 is the back diffusion rate constant, k 3 is the lipophilic to hydrophilic conversion constant, and k 4 is the hypothetical reverse conversion constant. Experimentally, it has been shown that no such reverse conversion takes place; therefore k4 ≒0

Fig. 4.4
Three-compartment unit-membrane model of solute exchange of lipophilic 99mTc-ECD. A slow loss of hydrophilic tracer or metabolites is present and not subject to detectable reuptake in tissue. k 5 represents a pathway from compartment III to blood
![$$ {F}_i=\frac{F_r\cdot \alpha \cdot \left({C}_i/{C}_r\right)}{\left[1+\alpha -\left({C}_i/{C}_r\right)\right]} $$](/wp-content/uploads/2016/09/A308863_1_En_4_Chapter_Equ4.gif)
(4.4)

(4.5)

(4.6)
Table 4.1
Average values of transfer constants, brain-to-blood partition coefficient (λ), and α ratios for 99mTc-HMPAO and 99mTc-ECD
99mTc-HMPAO | 99mTc-ECD | |
|---|---|---|
k 2 (min−1) | 0.69 | 0.22 |
k 3 (min−1) | 0.8 | 0.57 |
k 4 (min−1) | 0 | 0 |
k 5 (min−1) | 0 | 0.0038 |
λ (ml/g) | 0.67 | 1.33 |
α | 1.18 | 2.59 |
A flow chart of the rCBF measurement procedure comprising radionuclide angiography to estimate gCBF and SPECT to estimate rCBF using 99mTc-labeled tracers is demonstrated in Fig. 4.5. Global mean SPECT counts are calculated from threshold at 40–50 % of maximum SPECT counts. Thus, original SPECT images (Fig. 4.6a) are converted to rCBF SPECT images without any blood sampling (Fig. 4.6b).
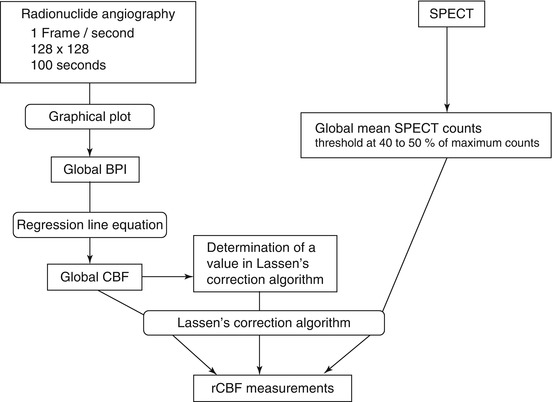
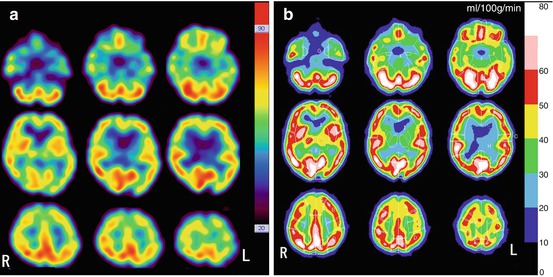

Fig. 4.5
Flow chart of the rCBF measurement procedure comprising radionuclide angiography and SPECT using 99mTc-labeled tracers. The gCBF converted from BPI using a regression line equation between BPI and gCBF measured using 133Xe-SPECT, the linearization correction factor α, and the global mean SPECT counts obtained from the threshold at 40–50 % of maximum counts are substituted into Lassen’s algorithm for the linearization correction (Eq. 4.4) to estimate rCBF. The default value of α is 1.5 for 99mTc-HMPAO and 2.6 for 99mTc-ECD

Fig. 4.6
Conversion of original 99mTc-ECD SPECT to rCBF SPECT images. (a) Original SPECT images (b) rCBF SPECT images
4.2.6 Consecutive rCBF Measurements at Baseline and Acetazolamide Challenge
Takeuchi et al. (1997) applied these noninvasive rCBF measurements using 99mTc-ECD to a split dose protocol (Fig. 4.7) for the consecutive evaluation of baseline rCBF and cerebral perfusion reserve with acetazolamide challenge. Radionuclide angiography after bolus injection of 99mTc-ECD is performed for 100 s to obtain gCBF at baseline using graphical analysis. Ten minutes after the first injection of 99mTc-ECD, first SPECT at baseline is started. Then 10 min before the second injection of 99mTc-ECD, 1,000 mg acetazolamide is intravenously injected during acquisition of projection data for the first SPECT. Acetazolamide does not modify the tracer distribution of the brain during this acquisition of the first SPECT since tracer distribution has been already determined during radionuclide angiography. Immediately after the completion of the first SPECT, an additional dose of 99mTc-ECD is injected, and 10 min later the second SPECT is started. Total time span required for this procedure is less than 50 min.
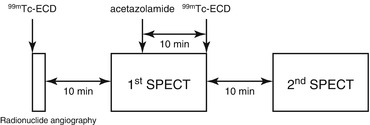

Fig. 4.7
Study protocol for the consecutive evaluation of baseline rCBF and cerebral perfusion reserve with acetazolamide challenge. Radionuclide angiography after bolus injection of 99mTc-ECD is performed for 100 s to obtain gCBF at baseline using graphical analysis. Ten minutes after the first injection of 99mTc-ECD, first SPECT at baseline is started. Then 10 min before the second injection of 99mTc-ECD, acetazolamide is intravenously injected during acquisition of projection data for the first SPECT. Immediately after the completion of the first SPECT, an additional dose of 99mTc-ECD is injected, and 10 min later the second SPECT is started
To extract SPECT data for the acetazolamide challenge, the first SPECT data were subtracted from the second SPECT data after decay correction of 99mTc. Post-acetazolamide gCBF is estimated from the baseline gCBF, baseline global mean SPECT count, and post-acetazolamide global mean SPECT count as follows:


