Osteoarthritis is characterized by a decrease in the proteoglycan content and disruption of the highly organized collagen fiber network of articular cartilage. Various quantitative magnetic resonance imaging techniques have been developed for noninvasive assessment of the proteoglycan and collagen components of cartilage. These techniques have been extensively used in clinical practice to detect early cartilage degeneration and in osteoarthritis research studies to monitor disease-related and treatment-related changes in cartilage over time. This article reviews the role of quantitative magnetic resonance imaging in evaluating the composition and ultrastructure of the articular cartilage of the knee joint.
Key points
- •
Quantitative magnetic resonance imaging can be used to noninvasively assess the composition and ultrastructure of articular cartilage.
- •
Quantitative magnetic resonance imaging can be used in clinical practice to detect early cartilage degeneration.
- •
Quantitative magnetic resonance imaging can be used in osteoarthritis research studies to monitor disease-related and treatment-related changes in articular cartilage over time.
Introduction
Osteoarthritis is one of the most common chronic medical conditions and is second only to cardiovascular disease as the leading cause of disability in the United States. Osteoarthritis may be caused by idiopathic or posttraumatic degeneration of articular cartilage. Characteristic changes in articular cartilage occur during the disease process including a decrease in the proteoglycan content and disruption of the highly organized collagen fiber network. Identifying the sequence of events that occur during cartilage degeneration is essential for better understanding of the pathogenesis of osteoarthritis and developing improved treatment options. Quantitative magnetic resonance (MR) imaging provides a noninvasive method to assess cartilage composition and ultrastructure. This article reviews the role of quantitative MR imaging for evaluating the articular cartilage of the knee joint, which is one of the joints most commonly affected by osteoarthritis.
Cartilage composition and function
Articular cartilage is composed of chondrocytes, which compose approximately 4% of the net weight of the tissue, and an abundant extracellular matrix. The extracellular matrix of cartilage consists primarily of water, composing between 65% and 85% of its net weight, and lower concentrations of proteoglycan and type II collagen. Proteoglycan composes 3% to 10% of the net weight of cartilage and allows the tissue to withstand high compressive forces during joint loading. Collagen composes 15% to 20% of the net weight of cartilage and is responsible for the tensile strength of the tissue. Articular cartilage is devoid of lymphatics, blood vessels, and nerves, limiting its potential for healing and repair. Thus, preservation of the cartilage macromolecular matrix is vital to joint health.
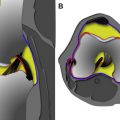
The macromolecular matrix of articular cartilage is composed of type II collagen organized in a complex 3-dimensional orientation, which provides tensile strength and determines tissue anisotropy. The articular surface is covered by the lamina splendins; dense bundles of collagen fibers lubricated by a proteoglycan called lubricin; and synovial fluid, which allows for low friction load transmission across the joint. The superficial zone of cartilage is composed of collagen fibers and elongated chondrocytes orientated parallel to the articular surface, whereas the middle zone is characterized by a random orientation of collagen fibers intermixed with round chondrocytes. The deep zone of cartilage consists of thick bundles of collagen fibers and elongated chondrocytes oriented perpendicular to the bone-cartilage interface. The radially oriented collagen fibers in the deeper layer of cartilage pass through the calcified zone to attach to subchondral bone ( Fig. 1 ).

The major proteoglycan constituent of articular cartilage is aggrecan, which is composed of a core protein with alternating domains of the negatively charged sulfated glycosaminoglycan side chains keratan sulfate and chondroitin sulfate. Aggrecans are assembled into a macromolecular structure of monomers, which are bound to a hyaluronan backbone through a link protein. The core protein of aggrecan consists of 3 globular domains (G1, G2, and G3) and 3 interglobular domains. The G1 domain resides on the N-terminus and interacts with the link protein to attach aggrecan to the hyaluronan backbone, whereas the G3 domain is located at the C-terminus of the glycoprotein. Located between the G2 and G3 domains are the attachment domains, which link the keratan sulfate and chondroitin sulfate side chains to the core protein ( Fig. 2 ).

The negative charge of the densely packed glycosaminoglycan chains of aggrecan become fixed to the extracellular matrix, called a fixed charge ; the concentration of this fixed charge is termed the fixed charge density of articular cartilage . The fixed charge density attracts water and positively charged ions from the synovial fluid. This produces a swelling pressure built up by the electrostatic repulsion between the glycosaminoglycan side chains in the cartilage extracellular matrix, which provides the underlying viscoelastic properties necessary for load distribution. However, the swelling pressure is constrained by the collagen fiber network, which provides the tensile force opposing the expansion of cartilage. Thus, the complex structure of the cartilage extracellular matrix requires a delicate balance between the compressive forces of aggrecan and the tensile strength of the collagen fiber network for normal function.
Sodium imaging
Sodium imaging can be used to assess the fixed charge density of articular cartilage. Sodium-23 atoms are associated with the negatively charged glycosaminoglycan side chains of proteoglycan macromolecules within cartilage. Decreased proteoglycan concentration within cartilage reduces the fixed charge density, which results in a decreased concentration of sodium ions. Thus, measurement of the sodium signal within cartilage can provide sensitive and specific information regarding the proteoglycan concentration of the tissue. Previous studies have reported strong correlations between the sodium concentration within cartilage measured using sodium imaging and nuclear MR spectroscopy. Furthermore, the concentration of sodium within both native and trypsin degraded ex vivo cartilage samples measured using sodium imaging has been shown to correlate strongly with proteoglycan concentration.
Sodium imaging is a promising method for evaluating articular cartilage but is technically challenging. The signal from sodium-23 atoms within cartilage is very low because of its low natural abundance and its reduced gyromagnetic ratio. These factors along with the very short T2 relaxation time of sodium-23 atoms make measuring sodium concentration within cartilage extremely difficult. Two-dimensional and 3-dimensional Cartesian-based sequences have been used for sodium imaging, but scan times are very long even when using high-field-strength 7.0-T scanners. Three-dimensional non–Cartesian-based techniques using radial, cone, and twisted projection k-space trajectories have more recently been used to improve the signal-to-noise ratio (SNR) and reduce the scan time for sodium imaging.
Additional limitation of sodium imaging is the need for specialized transmit and receive coils tuned to the resonance frequency of sodium-23 atoms and the difficulty in differentiating the sodium signal arising from articular cartilage and adjacent tissues, such as synovial fluid. Various techniques have been developed to suppress the sodium signal from synovial fluid, including the use of inversion recovery pulses and T1-weighted sequences with short repetition times. With the use of more SNR-efficient 3-dimensional non–Cartesian-based imaging techniques and improved methods for suppressing synovial fluid signal, sodium concentration within articular cartilage can be measured with high repeatability and with reasonable scan times. Sodium imaging has been used in multiple studies to detect differences in proteoglycan concentration between asymptomatic volunteers and patients with osteoarthritis and to monitor changes in the proteoglycan concentration of cartilage repair tissue over time ( Figs. 3 and 4 ).


Delayed gadolinium-enhanced imaging
Delayed gadolinium-enhanced imaging (DGEMRIC) measures the T1 relaxation time of articular cartilage in the presence of gadolinium contrast. DGEMRIC can be used to indirectly assess the fixed charge density of cartilage, as the distribution of negatively charged gadolinium contrast within cartilage is in theory indirectly proportional to the concentration of negatively charged glycosaminoglycan side chains of proteoglycan macromolecules. Decreased proteoglycan concentration within cartilage allows accumulation of more gadolinium contrast, which results in more rapid T1 relaxation of adjacent water protons within cartilage.
There is strong evidence to suggest that DGEMRIC can provide a sensitive and specific measure of the proteoglycan concentration of articular cartilage. The T1 relaxation time of both native and enzymatically degraded ex vivo cartilage samples in the presence of gadolinium contrast has been shown to strongly correlate with the proteoglycan concentration of cartilage. DGEMRIC measurements have also been found to correlate strongly with the compressive stiffness of cartilage, which is primarily determined by the proteoglycan concentration within the macromolecular matrix. Multiple studies have also shown that the T1 relaxation time of cartilage in the presence of gadolinium contrast is higher in the deep than in the superficial layers of cartilage and on the weight-bearing than non–weight-bearing surfaces of the knee joint, which corresponds to the spatial distribution of proteoglycan within cartilage.
DGEMRIC requires the administration of a double dose of gadolinium contrast followed by a 10-minute exercise period and then a 60- to 120-minute waiting period before T1 relaxation time measurements can be performed. The administration of a triple dose of gadolinium contrast has been found to improve the sensitivity of the technique for detecting early cartilage degeneration. The disadvantages of DGEMRIC include the long waiting time between contrast administration and MR imaging and the small risk of allergic reactions and even smaller risk of nephrogenic systemic sclerosis with use of ionic gadolinium contrast. Initially, T1 relaxation time measurements were performed both before and following the administration of gadolinium contrast; the change in T1 relaxation time was used to assess cartilage composition. However, the current DGEMRIC protocols typically measure T1 relaxation time only following gadolinium contrast administration to reduce the scan time, as this measurement has been shown to correlate strongly with both the change in T1 relaxation time and the concentration of proteoglycan within cartilage.
T1 relaxation time measurements of articular cartilage in DGEMRIC protocols were originally performed using 2-dimensional inversion recovery fast spin-echo and 3-dimensional inversion recovery spoiled gradient echo sequences with long scan times. More rapid 3-dimensional techniques for T1 relaxation time measurements including look-locker and variable flip-angle methods with complementary flip-angle correction have recently been developed. With the use of these new techniques, the T1 relaxation time measurement of articular cartilage following gadolinium contrast administration can be performed with high repeatability and in relatively short scan times. However, DGEMRIC measurements within articular cartilage can be influenced by the degree of cartilage loading. Furthermore, the presence of gadolinium can have deleterious effects on the accuracy of both the T2 relaxation time and the thickness measurements of articular cartilage.
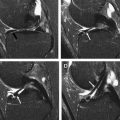
DGEMRIC has been used in multiple studies to detect changes in the proteoglycan concentration of articular cartilage. Animal models of osteoarthritis have shown a decreased T1 relaxation time of cartilage following gadolinium contrast administration, which corresponds to areas of proteoglycan loss on histologic analysis. DGEMRIC has been shown to have high sensitivity for detecting surgically and histologically confirmed early cartilage degeneration in human subjects. Studies have also found lower T1 relaxation times of cartilage following gadolinium contrast administration in patients with higher radiographic grades of knee osteoarthritis indicating greater proteoglycan loss in individuals with more severe joint degeneration. Decreased T1 relaxation time of articular cartilage after gadolinium contrast administration has been reported in patients following an anterior cruciate ligament tear and meniscetomy indicating that DGEMRIC can detect early posttraumatic cartilage degeneration within the knee joint ( Fig. 5 ). DGEMRIC has also been used to monitor changes in the proteoglycan concentration of cartilage following cartilage repair procedures.

T1-rho mapping
T1-rho mapping uses a long-duration and low-power radiofrequency pulse applied to magnetization in the transverse plane which effectively spin-locks the magnetization around the B1 field and prevents T2 relaxation. T1-rho relaxation time is the time constant of the exponential decay of magnetization during application of the spin-lock pulse. T1-rho relaxation time is influenced by low-frequency molecular interactions between water molecules and their local macromolecular environment, with water protons in close proximity to macromolecules having a greater dissipation of energy during the spin-lock pulse than free water protons. T1-rho relaxation time is always longer than T2 relaxation time, as the B1 field attenuates the effects of bipolar interactions, chemical exchange, and static dipolar coupling on signal decay.
Initial applications of T1-rho mapping consisted of single-slice acquisitions through articular cartilage. Multi-slice T1-rho sequences were later developed based on multi-echo fast spin-echo and spiral imaging methods, but scan times remained long. Various 3-dimensional T1-rho techniques are now available that combine a spin-lock pulse to create T1-rho contrast with gradient-echo acquisition methods that use parallel imaging to reduced scan time. The currently used 3-dimensional techniques can measure the T1-rho relaxation time of articular cartilage with high repeatability and in relatively short scan times. However, a disadvantage of T1-rho imaging is the relatively large radiofrequency power applied during the spin-lock preparation pulse, which creates problems with the specific absorption rate and tissue heating, especially when using high-field-strength scanners.
T-rho relaxation time is influenced by low-frequency molecular interactions between water molecules and the cartilage macromolecular matrix. The exchange of protons between water molecules and the hydroxyl and amine groups on the glycosaminoglycan side chains of proteoglycan macromolecules is thought to be the primary mechanism for T1-rho dispersion within cartilage. A strong correlation has been found between the T1-rho relaxation time of cartilage and the fixed charge density measured using sodium imaging. Multiple studies have also shown that the T1-rho relaxation time of both native and enzymatically degraded ex vivo cartilage samples is strongly correlated with the proteoglycan concentration of cartilage. However, T1-rho relaxation time is not a specific measure of the proteoglycan concentration of cartilage and is also influenced by other biological changes, which occur during cartilage degeneration, the orientation of cartilage relative to the main magnetic field, and the degree of cartilage loading.
T1-rho mapping has been used in multiple studies to detect changes in the macromolecular matrix of articular cartilage in patients with osteoarthritis. The T1-rho relaxation time of cartilage has been found to increase with age and early cartilage degeneration ( Fig. 6 ). Studies have shown that T1-rho relaxation time is more sensitive than T2 relaxation time for detecting early cartilage degeneration in both ex vivo specimens and human subjects. Texture analysis of the spatial distribution of T1-rho within cartilage has been found to provide even better identification of early cartilage degeneration than global T1-rho relaxation time measurements. Elevated T1-rho within cartilage in patients with osteoarthritis has also been shown to predict the progression of cartilage degeneration over time.
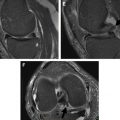
T1-rho mapping also has been used to evaluate posttraumatic and postsurgical changes in articular cartilage. Increased T1-rho relaxation times in areas of acute cartilage injury have been reported in patients with anterior cruciate ligament tears and have been shown to persist at the 1-year follow-up despite the resolution of underlying bone marrow edema. Studies have also found significantly higher T1-rho relaxation time within the articular cartilage of the medial compartment of the knee joint in patients with anterior cruciate ligament injury when compared with asymptomatic volunteers at both 1-year and 2-year follow-up periods indicating the presence of early posttraumatic cartilage degeneration ( Fig. 7 ). T1-rho mapping has also been used to monitor changes in the macromolecular matrix of articular cartilage following cartilage repair procedures ( Fig. 8 ).
T2 mapping
T2 mapping measures the spin-spin relaxation time of articular cartilage. When dipoles are aligned in a static magnetic field and a 90° radiofrequency pulse is applied, the dipoles absorb energy. This absorption of energy makes them unstable, and they start to relax back to equilibrium by dispersing energy within the spin system itself or transferring it out of the spin system to the lattice. The T2 relaxation time reflects the time it takes the dipoles to disperse energy following excitation. The T2 relaxation time of cartilage is a complex measurement that is influenced by multiple factors, including water and macromolecular concentration, organization of the collagen fiber network, cartilage loading, and orientation of cartilage relative to the main magnetic field. Thus, changes in the T2 relaxation time of cartilage may be difficult to interpret because of the multiple competing biological and mechanical factors that influence the measurement.
The highly organized macromolecular matrix of articular cartilage restricts the motion of water molecules and enhances dipole-dipole interactions, which shorten the T2 relaxation time of cartilage. These dipole-dipole interactions are dictated by the geometric factor 3cos 2 θ-1 of the z-component of the electromagnetic field. Consequently, when θ = 54.7°, the interactions go to zero, and an increase in T2 relaxation time is observed, which is referred to as the magic angle effect . The magic angle effect in cartilage is thought to be caused by the orientation-dependent effect on the T2 relaxation time of water bound to collagen. Thus, the T2 relaxation time of cartilage may provide information regarding collagen fiber orientation and the integrity of the collagen fiber network. However, water bound to collagen has an extremely short T2 relaxation time of approximately 2.2 milliseconds, which cannot be directly measured using most T2 relaxation time techniques. Therefore, the magic angle effect is likely influenced by interactions between collagen-bound water and the other measurable water components, either through water exchange or the influence of collagen fiber orientation on the orientation of other cartilage constituents.
The exact relationship between the T2 relaxation time and chemical composition of articular cartilage remains unknown with conflicting reports in the literature. Some enzymatic degradation studies have shown that proteoglycan depletion of ex vivo cartilage samples using trypsin results in increased T2 relaxation time, whereas other studies have found no such change in T2 relaxation time with proteoglycan depletion. Collagenase degradation of ex vivo cartilage samples has been shown to increase T2 relaxation time in one study suggesting that collagen content may also influence the T2 relaxation time of cartilage. Studies comparing the T2 relaxation time of articular cartilage with biochemical measurements of water, proteoglycan, and collagen content have also reported inconsistent findings. Some studies using human cartilage specimen obtained during total knee arthroplasty have found an inverse correlation between the T2 relaxation time and the proteoglycan content of cartilage, whereas other studies using similar methodology have found no such relationship. Although increased hydration of articular cartilage should theoretically lead to an increase in T2 relaxation time, not all studies have shown a direct correlation between the T2 relaxation time and the water content of ex vivo cartilage samples.
T2 mapping techniques can measures the T2 relaxation time of articular cartilage on a pixel-by-pixel basis by acquiring images at multiple echo times and fitting the signal decay using a nonlinear least squares algorithm. Originally, T2 mapping was performed using single-slice 2-dimensional spin-echo sequences with extremely long scan times. The introduction of fast spin-echo methods have greatly improved the speed of T2 mapping, but the drawback of these techniques is that slice-selective refocusing pulses can lead to stimulated echo signal from the presence of nonrectangular slice select profiles caused by an inhomogeneous B1 field. Three-dimensional spoiled gradient-echo techniques have more recently been developed for T2 mapping, which provide thin continuous slices through articular cartilage and eliminate the need for slice-selective refocusing pulses, which reduce the risk of excess signal in and between slices caused by simulated echoes. Currently used techniques can measure the T2 relaxation time of articular cartilage with high repeatability and in relatively short scan times. However, the T2 relaxation time of cartilage is influenced by multiple factors, including the type of sequence, imaging parameters, and radiofrequency coil used to obtain the measurement, which is important to consider when performing longitudinal or multi-center studies.
T2 mapping has been extensively used to evaluate the composition and ultrastructure of articular cartilage in patients with osteoarthritis. The T2 relaxation time of cartilage has been shown to increase with age, especially in the superficial layer where senescent changes tend to occur. T2 relaxation time has been shown to have high sensitivity for detecting early cartilage degeneration in ex vivo specimens and human subjects ( Fig. 9 ). Higher T2 relaxation time of cartilage has also been reported in patients with increasing radiographic grades of osteoarthritis. In addition, higher and more heterogeneous cartilage T2 relaxation time has been noted in subjects with risk factors for osteoarthritis when compared with asymptomatic volunteers despite both groups of individuals having normal radiographs. Associations between higher cartilage T2 relaxation time and the presence of cartilage lesions, meniscus tears, bone marrow edema lesions, and knee pain have been reported. Higher T2 relaxation time of articular cartilage has also been shown to predict the progression of focal cartilage lesions within the knee joint in longitudinal studies.
T2 mapping has also been used to evaluate posttraumatic and postsurgical changes in articular cartilage. Studies have found elevated T2 relaxation time within the posterior lateral tibial plateau in areas of acute cartilage injury during the early phase after anterior cruciate ligament tear, which persisted at both the 1-year and 2-year follow-up despite resolution of adjacent bone marrow lesions. Longitudinal follow-up in the same group of patients has demonstrated increased T2 relaxation time within the central medial femoral condyle 2 years after injury with higher T2 values in individuals with associated meniscus tears. Another cross-sectional study using the healthy contralateral knee as a reference to the injured knee has shown elevated cartilage T2 relaxation time within the medial femoral condyle 6 months following anterior cruciate ligament reconstruction surgery. In addition, increased T2 relaxation time within the articular cartilage of the tibial plateau has been reported in patients with meniscus tears. T2 mapping has also been used to monitor changes in the macromolecular matrix of articular cartilage following cartilage repair procedures. Restoration of the normal zonal stratification of T2 relaxation time with increasing values from the deep to the superficial layers has been shown to correspond to maturation of the cartilage repair tissue over time ( Fig. 10 ).
Ultrashort echo time imaging
Ultrashort echo time (UTE) imaging can be used to investigate the short T2 components of articular cartilage. Spin-echo and gradient-echo techniques typically used for cartilage imaging have minimum echo times ranging between 2 milliseconds and 10 milliseconds and, thus, cannot detect signal from water protons in the deep and calcified zones of cartilage where highly organized collagen fibers contribute to very short T2 relaxation times. UTE imaging uses echo times as short as 0.08 milliseconds, which can capture signal from the short T2 components of cartilage. However, UTE imaging assesses effective T2 relaxation time (T2*), which is influenced by tissue susceptibility and magnetic field inhomogeneity along with the T2 relaxation characteristics of cartilage.
Various UTE techniques have been used for evaluating articular cartilage. Most 2-dimensional UTE sequences use a radial k-space trajectory with a half excitation pulse followed by another half excitation pulse with the polarity of the slice selection gradient reversed. Three-dimensional UTE sequences typically use a short hard pulse excitation followed by 3-dimensional ramp sampling. Conspicuity of the short T2 components on UTE images can be enhanced by suppressing signal from fat and long T2 components through the use of saturation or inversion nulling techniques. Quantitative assessment of articular cartilage using UTE T2* mapping can be performed by acquiring images with multiple echo times, with the lowest being 0.5 milliseconds or less, and fitting the signal decay using a single-component or bicomponent model.
UTE imaging has identified distinct linear signal intensity at the bone-cartilage interface, which has been shown to correspond to the deepest layer of cartilage and the calcified zone of cartilage on histologic analysis ( Fig. 11 ). These deep regions within cartilage, which have a T2* relaxation time of 1.3 milliseconds, may play a role in the pathogenesis and progression of osteoarthritis. UTE T2* relaxation time has been shown to decrease with cartilage degeneration. It has been speculated that the lower UTE T2* relaxation time in degenerative cartilage is caused by loss of water trapped between collagen fibers secondary to collagen denaturation, which results in a greater fraction of short T2 components that contribute to an overall decreased T2* value of cartilage. UTE T2* relaxation time has also been found to have higher sensitivity than T2 relaxation time for distinguishing between healthy and degenerative cartilage because of its ability to assess the short T2 components within the deepest layers of the tissue where cartilage degeneration may occur.
Bicomponent UTE T2* mapping has identified 2 distinct T2* components within articular cartilage, a short component with a T2* relaxation time between 1 millisecond and 6 milliseconds, which corresponds to macromolecular-bound water and a long component with a T2* relaxation time of approximately 22 milliseconds, which corresponds to bulk water. Whether the short T2* component corresponds exclusively to collagen-bound water or to water bound to both collagen and proteoglycan remains unknown. Enzymatic degradation of cartilage has been shown to cause a decrease in the short T2* relaxation time with no change in the long T2* relaxation time. However, another study comparing UTE T2* parameters with histology and polarized light microscopy has found that cartilage degeneration has no influence on the short T2* relaxation time but increases the long T2* relaxation time. This study has also shown that the fraction of the short T2 component has the strongest correlation with the degree of cartilage degeneration and disruption of the collagen fiber network. It has been speculated that the higher fraction of the short T2 component in degenerative cartilage is caused by disruption of the collagen fiber network, which results in increased surface area on the collagen fiber for water binding. However, further studies are needed to better understand the mechanisms responsible for changes in UTE T2* parameters at various stages of cartilage degeneration.
Magnetization transfer imaging
Magnetization transfer (MT) imaging can be used to assess the macromolecular matrix of articular cartilage by measuring the magnetization exchange between free water and macromolecular-bound protons. Protons bound to the cartilage macromolecules matrix have a much broader absorption line shapes than free water protons and can be preferentially saturated using an off-resonance radiofrequency pulse. The saturated macromolecular-bound protons undergo magnetization exchange with free water protons through chemical exchange or dipole-dipole interactions, which reduces the longitudinal magnetization of the free water protons available to generate signal during MR imaging.
MT ratio (MTR) measures the change in signal intensity of articular cartilage on MR images acquired with and without an off-resonance radiofrequency pulse. MTR is primarily influenced by the content and molecular structure of collagen within cartilage. However, MTR is not a specific measure of collagen within cartilage and is also influenced by other factors, including the T1 relaxation time and proteoglycan content of the tissue. MTR measurements also depend highly on experimental parameters and vary across scanners, transceiver, and scanned objects even when using the same imaging protocol. Studies have shown that MTR is relatively insensitive for detecting early cartilage degeneration in human subjects. However, the technique has been found useful for monitoring changes in the macromolecular matrix of articular cartilage following cartilage repair procedures.
Chemical exchange saturation transfer (CEST) imaging is another technique that investigates the exchange of magnetization between free water and macromolecular-bound protons within articular cartilage. In CEST imaging, the exchangeable proton spins on the hydroxyl groups on the glycosaminoglycan side chains of proteoglycan are selectively saturated with an off-resonance pulse, and the saturation effect is transferred to free water protons through magnetization exchange. The change in the signal measured in the free water pool is directly proportionate to the number of macromolecular-bound protons being saturated and, hence, the concentration of proteoglycan within cartilage. A strong correlation between CEST and sodium values within both healthy cartilage and cartilage repair tissue has been reported, which suggests that CEST imaging can be used to assess the fixed charge density of cartilage.
CEST imaging has been performed at 3.0 T and 7.0 T in reasonable scan times using 3-dimensional gradient-echo sequences. The disadvantages of CEST imaging include the need to achieve high-magnetic-field homogeneity and the inadvertent suppression of water signal with the off-resonance pulse, which is especially problematic when using lower-strength 3.0-T scanners. The clinical applications of CEST imaging for evaluating articular cartilage remain largely unknown. One study has reported a decrease in CEST values of cartilage repair tissue when compared with healthy cartilage ( Fig. 12 ). However, little additional work has been performed to correlate CEST measurements with the concentration of proteoglycan within cartilage or to determine the feasibility of using the technique to investigate cartilage degeneration and acute cartilage injury in human patients.