Radiation Safety
The physical radiation dose D (energy absorbed per unit mass) is expressed in Gray (Gy), used for any type of radiation and also in the radiation therapy of malignant tumors. It has to be distinguished from the equivalence dose H expressed in Sievert (Sv), which represents the physical radiation dose multiplied by a proportionality factor that considers the unique radiation sensitivity of a particular tissue: Epithelium, mucosa of the respiratory and gastrointestinal tract and other tissues with a high rate of cell division (e.g., blood forming cells of the bone marrow) are more sensitive to ionizing radiation than tissue with dormant cell division.
An even better comparison of the biologic effect can be achieved with the effective dose E, which is the sum of the doses delivered to the individual organ. This effective dose, which weighs the relative inherent sensitivities, is also expressed in Sievert (Sv) or Millisievert (mSv). Furthermore, the patient’s age at the time of radiation exposure must be included in a rational assessment of the radiation risk since the latency period of a radiation-induced tumor can be rather long (decades). Table 174.1 lists the risk coefficients of different organs following a low-dose exposure to the entire body.
This implies that the risk of radiation-induced malignancies markedly decreases with increasing age at the time of exposure. But not only the patient’s age, but also the amount of the individual dose and the length of the time intervals play a decisive role. As a rule of thumb, the lower the individual dose and the longer the intervals between several radiation exposures, the lower the risk of a subsequently induced neoplasm. Among other factors, this depends on the capability of the cellular nuclei to repair DNA breaks with the help of repair enzymes as long as the reparative capacity is not exceeded by high individual doses. Evidence even exists that protective effects predominate in the low-dose range through activation of protective cell factors (DNA reparase and others). For a better assessment of the risk associated with the medical application of ionizing radiation, it is revealing to consider the daily exposure from natural background radiation: The major component of the natural radiation exposure comes from radon, a noble gas, which gets into the air through the building materials of houses and apartments. Using a strictly theoretical calculation, radon and its decay products may induce 5 to 10% of all bronchial carcinomas. In contrast, medical application of ionizing radiation “only” induces less than 1.5% of all malignancies.
The average annual radiation exposure of about 2.4 mSv has to be put in perspective with the manmade radiation exposure of 1.8 mSv (Table 174.2).
In general, “hard” X-rays used for conventional radiography of the chest are scattered and absorbed less in human tissue than “soft” X-rays used for mammography. The scatter radiation also contributes to the absorption and consequently to the risk associated with a particular examination. Because of the tissue-dependent variability of the risk factors and the different characteristics of the various modalities used in diagnostic radiology, the organ doses are quite diverse.
Together with arteriography and fluoroscopy, CT is responsible for a rather high radiation exposure in diagnostic radiology. Multiplying the individual values with the number of the different examinations performed annually reveals that CT is responsible for about a third of the collective total dose. The different CT examinations deliver the following average radiation doses (Table 175.2). All scan protocols should be used with automatic dose- and kV modulation and with iterative recon with a mean strenght, if possible.
A comparison with air travel is often used in public health discussions: On a long, high altitude transatlantic flight, cosmic rays cause a not irrelevant additional exposure. On a flight from Europe to the West Coast of the U.S.A., this can easily be in the range of certain CT examinations. Other calculations of the cancer risk compare conventional chest radiography with cigarette smoking: A single chest radiograph is believed to have the same cancer risk as smoking seven cigarettes. It should be kept in mind, however, that all mathematical models include several aspects and cofactors that are elusive to exact statistic calculations.
While these comparisons put into perspective an excessive concern of the potential risk of medical radiographic examinations, they should not be misused to belittle the radiation risk. To avoid unnecessary risks to the general population, it has become established policy to avoid dispensable radiation exposure in conventional radiology and CT, and to take advantage of any possible reduction of radiation exposure to patients.
It is for the same reason that pulsed fluoroscopy has replaced continuous fluoroscopy for upper GI series, enteroclysis and barium enema: The examiner selects between several pulse sequences with 1, 2, 4, and 8 images per second. The resultant dosereduction is considerable. The next pages describe solutions suitable for dose reduction that are especially applicable for CT.
Automatic Bolus Tracking (BT)
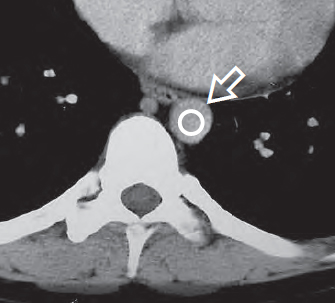
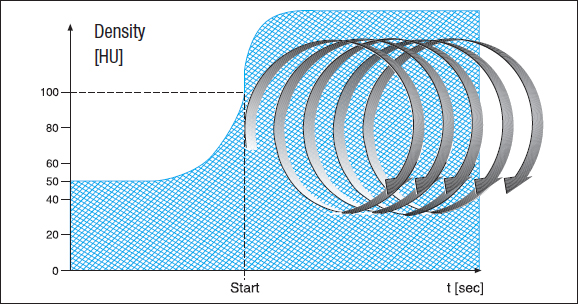
For CT, several techniques are available for reducing the radiation dose to the patient. Especially CT requiring optimal contrast enhancement in the vessels, e.g., above all CT angiography, should be performed with automatic bolus tracking to avoid unnecessary duplications because of inadequate intravascular contrast enhancement. This software solution offers the examiner the possibility to place a region of interest (ROI) () just before or at the beginning of the target region, e.g., the lumen of the descending aorta ( Fig. 176.1a ). After selecting a certain threshold value for the density of the aorta, e.g., 100 HU, the unit measures the density automatically at the preselected site every second after the beginning of the intravenous injection of contrast medium, usually through the cubital vein.
Data acquisition (the actual scanning process) begins as soon as the density in the aortic lumen exceeds the threshold value, i.e., exactly when the bolus of the contrast medium has reached the selected target region after passage through the pulmonary circulation ( Fig. 176.1b ).
In addition, the amount of contrast medium needed to achieve the same contrast enhancement can be reduced: sterile physiologic NaCl solution is injected from a second syringe of the injection pump (see front cover flap) at the same flow rate immediately following the injection of contrast medium in order to push the contrast medium faster and at a higher concentration through the brachial veins toward the heart and through the pulmonary circulation.
Stay updated, free articles. Join our Telegram channel

Full access? Get Clinical Tree


