Radiologic Imaging Modalities
RADIOGRAPHY AND DIGITAL RADIOGRAPHY (DR)
Among the variety of available imaging techniques, the most important modality for the evaluation of arthritis is conventional radiography. It is clearly the procedure of choice for the initial examination because of its effectiveness in evaluating the bone and joint changes associated with arthritic disorders, including diminution of the radiographic joint space, osteopenia, sclerosis, subchondral cysts, erosions, osteophytosis, periosteal reaction, and soft tissue calcifications. Characteristic radiographic features, when pathognomonic, may suggest a diagnosis or at least a differential diagnosis. The radiographs may provide objective evidence for the presence and extent of abnormalities, and serial studies may be utilized for recording progress or its lack during the course of a therapy and thus may influence the choice of treatment. In addition, correlation of the radiographic findings with clinical impressions may be useful in determining prognosis. Standard radiographic techniques with minor technical adjustments provide indirect and direct information regarding almost all the tissues within and surrounding the joint. Detailed features of osseous structures along with less well-defined visualization of soft tissues can be demonstrated. Although articular cartilage is not visible, its thickness can be gauged by determining the width of radiographic joint space, with thinning of the cartilage reflected by diminution of visible joint space.
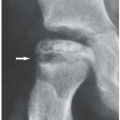
Standard radiographs of the involved joint should be obtained in at least two projections at 90 degrees to each other. Special projections may at times be required to demonstrate destructive changes in the joint to better advantage. In the shoulder, the special posterior oblique view, known as the Grashey projection, permits the glenoid to be seen in profile. This variant of the anteroposterior (AP) projection in shoulder imaging is obtained by placing the patient in a 40-degree posterior oblique position and directing the center beam toward the glenohumeral joint. This projection shows the glenoid in true profile and clearly visualizes the glenohumeral joint space, which is obscure in the standard AP projection (Fig. 2.1). The Grashey view has been found to be particularly effective in demonstrating subtle shoulder joint erosions in inflammatory arthritides. A superoinferior view, known as the axillary projection, is helpful to determine the exact relationship of the humeral head and the glenoid (Fig. 2.2A,B) and is effective in demonstrating the degenerative and inflammatory abnormalities of the glenohumeral joint (Fig. 2.2C). This view, however, may at times be difficult to obtain, particularly if the patient is unable to abduct the arm, in which case a variant of the axillary projection known as the West Point view may be similarly effective (Fig. 2.3). Another useful variant of the axillary projection is the Lawrence view. The importance of this projection lies in the fact that it does not require full abduction of the arm because it can be compensated for by angulation of the radiographic tube (Fig. 2.4). Abnormalities of the acromioclavicular joint are best seen on the special view of this structure obtained with 15 degrees cephalad tilt of the radiographic tube (Fig. 2.5A,B). The key to this other variant of the AP view of the shoulder is a special low-kilovoltage technique in which the radiographic factors are reduced to ˜ 33% to 50% of those used in the standard technique for the AP view. The excellent visualization of the acromial end of the clavicle, the acromion, and the acromioclavicular joint afforded by this projection can be helpful in demonstrating early resorptive changes of the distal end of the clavicle seen in rheumatoid arthritis (Fig. 2.5C) and hyperparathyroid arthropathy. In the elbow, the radial head-capitellum view, by eliminating overlap of the radial head and coronoid
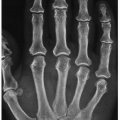
process and by more clearly demonstrating the humeroradial and humeroulnar joints, shows the inflammatory changes in the elbow joint to better advantage (Fig. 2.6). This projection has proved to be particularly useful in evaluating the capitellum, radial head, and coronoid process. The semisupinated oblique view of the hand and wrist (the so-called ball-catcher view), introduced by Nørgaard in 1965, effectively demonstrates the radial aspects of the
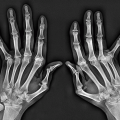
metacarpal heads and of the base of the proximal phalanges in the hand and the triquetrum-pisiform joint in the wrist (Fig. 2.7). Because the earliest erosive changes of some inflammatory arthritides begin in these areas, the Nørgaard view may provide important information at the early stages of arthritides. It may also demonstrate subtle subluxations in metacarpophalangeal joints frequently seen in systemic lupus erythematosus (SLE). In the hip, demonstration of the anatomic structures of the proximal femur including the greater and lesser trochanters is facilitated by the frog-leg lateral projection (Fig. 2.8). Demonstration of the sacroiliac joints requires either a posteroanterior projection, which is obtained to greater advantage with 25 to 30 degrees caudal angulation of the radiographic tube, or an AP view with 30 to 35 degrees cephalad angulation, known as the Ferguson view (Fig. 2.9). In the knee, a weight-bearing view may be of value, particularly for a dynamic evaluation of any decrement in the joint space under the weight of the body (Fig. 2.10). On the Merchant projection (Fig. 2.11), the patellofemoral disorders are better evaluated than on the standard sunrise view (Fig. 2.12). This projection is especially effective in demonstrating the articular facets of the patella and femur and can be helpful in detecting subtle subluxations of the patella. In the ankle, the Harris-Beath view is effective in demonstrating the posterior and medial facets of the subtalar joint (Fig. 2.13), whereas Broden’s view, in addition to clear visualization of the posterior facet of the subtalar joint, provides a good image of the sustentaculum tali, talofibular joint, and talofibular syndesmosis (Fig. 2.14). In the cervical spine, an open-mouth view provides effective visualization of the structures of the first two cervical vertebrae. The body of C2 is clearly imaged, as well as the atlantoaxial joints, the odontoid process, and the articular pillars of C1 (Fig. 2.15). If the open-mouth view is difficult to obtain, or the odontoid process is not clearly visualized, the Fuchs
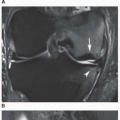
view may be helpful (Fig. 2.16). Flexion-extension views in the lateral projections are needed to evaluate stability of C1-C2 articulation and predental space and are particularly effective in demonstrating the abnormalities of these structures in the patients with rheumatoid arthritis affecting the cervical spine (Fig. 2.17). Oblique view is critical for evaluation of cervical neural foramina (Fig. 2.18). Because the visualization of C7 and T1 vertebrae is often obscured on the standard projections owing to overlap of the clavicle and soft tissues of the shoulder girdle, the swimmer’s view provides the solution to this problem (Fig. 2.19). In the thoracic spine, to clearly demonstrate the vertebral bodies and disk spaces on the lateral projection, the special technique known as autotomography is used, which requires shallow breathing by the patient to blur the structures involved in respiratory motion and gives a clear view of the thoracic vertebral column (Fig. 2.20).
process and by more clearly demonstrating the humeroradial and humeroulnar joints, shows the inflammatory changes in the elbow joint to better advantage (Fig. 2.6). This projection has proved to be particularly useful in evaluating the capitellum, radial head, and coronoid process. The semisupinated oblique view of the hand and wrist (the so-called ball-catcher view), introduced by Nørgaard in 1965, effectively demonstrates the radial aspects of the
metacarpal heads and of the base of the proximal phalanges in the hand and the triquetrum-pisiform joint in the wrist (Fig. 2.7). Because the earliest erosive changes of some inflammatory arthritides begin in these areas, the Nørgaard view may provide important information at the early stages of arthritides. It may also demonstrate subtle subluxations in metacarpophalangeal joints frequently seen in systemic lupus erythematosus (SLE). In the hip, demonstration of the anatomic structures of the proximal femur including the greater and lesser trochanters is facilitated by the frog-leg lateral projection (Fig. 2.8). Demonstration of the sacroiliac joints requires either a posteroanterior projection, which is obtained to greater advantage with 25 to 30 degrees caudal angulation of the radiographic tube, or an AP view with 30 to 35 degrees cephalad angulation, known as the Ferguson view (Fig. 2.9). In the knee, a weight-bearing view may be of value, particularly for a dynamic evaluation of any decrement in the joint space under the weight of the body (Fig. 2.10). On the Merchant projection (Fig. 2.11), the patellofemoral disorders are better evaluated than on the standard sunrise view (Fig. 2.12). This projection is especially effective in demonstrating the articular facets of the patella and femur and can be helpful in detecting subtle subluxations of the patella. In the ankle, the Harris-Beath view is effective in demonstrating the posterior and medial facets of the subtalar joint (Fig. 2.13), whereas Broden’s view, in addition to clear visualization of the posterior facet of the subtalar joint, provides a good image of the sustentaculum tali, talofibular joint, and talofibular syndesmosis (Fig. 2.14). In the cervical spine, an open-mouth view provides effective visualization of the structures of the first two cervical vertebrae. The body of C2 is clearly imaged, as well as the atlantoaxial joints, the odontoid process, and the articular pillars of C1 (Fig. 2.15). If the open-mouth view is difficult to obtain, or the odontoid process is not clearly visualized, the Fuchs
view may be helpful (Fig. 2.16). Flexion-extension views in the lateral projections are needed to evaluate stability of C1-C2 articulation and predental space and are particularly effective in demonstrating the abnormalities of these structures in the patients with rheumatoid arthritis affecting the cervical spine (Fig. 2.17). Oblique view is critical for evaluation of cervical neural foramina (Fig. 2.18). Because the visualization of C7 and T1 vertebrae is often obscured on the standard projections owing to overlap of the clavicle and soft tissues of the shoulder girdle, the swimmer’s view provides the solution to this problem (Fig. 2.19). In the thoracic spine, to clearly demonstrate the vertebral bodies and disk spaces on the lateral projection, the special technique known as autotomography is used, which requires shallow breathing by the patient to blur the structures involved in respiratory motion and gives a clear view of the thoracic vertebral column (Fig. 2.20).
 Figure 2.1 ▪ Grashey view. A: For the AP view of the shoulder that demonstrates the glenoid in profile (Grashey projection), the patient may be either erect (as shown here) or supine. He or she is rotated ˜ 40 degrees and the central beam is directed toward the glenohumeral joint. B: The radiograph in this projection (posterior oblique view) shows clearly the glenohumeral joint space. C: Narrowing of the joint space and subchondral sclerosis associated with formation of osteophytes are present in acromioclavicular and glenohumeral joints, reflecting osteoarthritis. Significant narrowing of the subacromial space is due to a chronic rotator cuff tear. |
 Figure 2.2 ▪ Axillary view. A: For the axillary view of the shoulder, the patient is seated at the side of the radiographic table, with the arm abducted so that axilla is positioned over the film cassette. The radiographic tube is angled ˜ 5 to 10 degrees toward the elbow, and the central beam is directed through the shoulder joint. B: The radiograph in this projection demonstrates the exact relationship of the humeral head and glenoid, and the glenohumeral joint space is clearly demonstrated. C: Advanced osteoarthritis is affecting the glenohumeral joint. |
 Figure 2.3 ▪ West Point view. A: For the West Point view of the shoulder, the patient lies prone on the radiographic table, with a pillow placed under the examined shoulder to raise it ˜ 8 cm. The film cassette is positioned against the superior aspect of the shoulder. The radiographic tube is angled toward the axilla at 25 degrees to the patient’s midline and 25 degrees to the table’s surface. B: On the radiograph in this projection, the relationship of humeral head and the glenoid can be sufficiently evaluated as on the axillary view, but the anteroinferior glenoid rim, which is seen tangentially, is better visualized. |
 Figure 2.4 ▪ Lawrence view. For the Lawrence variant of the axillary projection of the shoulder, the patient lies supine on the radiographic table with the examined arm abducted up to 90 degrees. The film cassette is positioned against the superior aspect of the shoulder with the medial end against the neck, which places the midportion of the cassette at the level of the surgical neck of the humerus. The radiographic tube is at the level of the ipsilateral hip and is angled medially toward axilla. The amount of angulation depends on the degree of abduction of the arm: less abduction requires increased medial angulation. The central beam is directed horizontally slightly superior to the midportion of the axilla. This view demonstrates the same structures as the standard axillary view. |
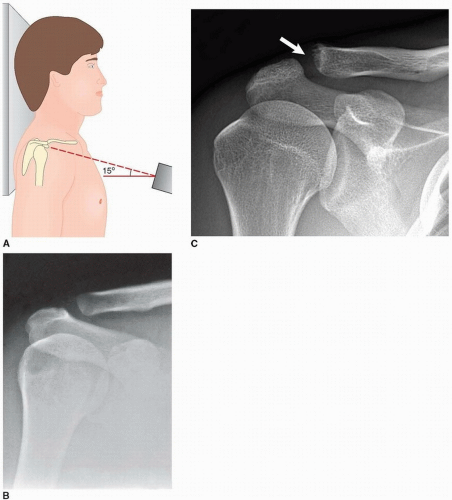 Figure 2.5 ▪ Acromioclavicular view. A: To properly evaluate the acromioclavicular (AC) articulation, the patient is erect, with the arm in neutral position. The central beam is directed 15 degrees cephalad toward the clavicle. As overexposure of the film will make it difficult to evaluate the AC joint, the radiographic factors should be reduced to ˜ 33% to 50% of those used to obtain standard AP view of the shoulder. B: The radiograph obtained in this projection shows clearly the AC joint. C: In a patient with clinically documented rheumatoid arthritis, there is early osteolysis of the acromial end of the clavicle (arrow). |
 Figure 2.6 ▪ Radial head-capitellum view. A: For the radial head-capitellum projection of the elbow, the patient is seated at the side of the radiographic table, with the forearm resting on its ulnar side, the elbow joint flexed 90 degrees, and the thumb pointing upward. The central beam is directed toward the radial head at a 45-degree angle to the forearm. B: The radiograph obtained in this projection shows the radial head projected ventrad, free of overlap by the coronoid process, which is also well demonstrated. This view is also effective in evaluating the capitellum and the humeroradial and humeroulnar articulations. C: In a patient with advanced rheumatoid arthritis, this projection effectively demonstrates the erosions of the humeroradial and humeroulnar joints. |
 Figure 2.7 ▪ Nørgaard view. A: For the ball-catcher view of the hands and wrists, the patient’s arms are fully extended and resting on their ulnar sides, and the fingers are extended. The hands are in slight pronation, as when catching a ball. The central beam is directed toward the metacarpal heads. B: On the radiograph in this projection, the radial aspects of the base of the proximal phalanges, triquetrum, and pisiform bones, as well as triquetropisiform joints are well demonstrated. C: In a patient with rheumatoid arthritis, observe the periarticular osteoporosis, erosions of the metacarpophalangeal and proximal interphalangeal joints, and erosions of the triquetral bones. D: In another patient, this projection shows coexistence of gull wing-type erosive changes affecting the proximal and distal interphalangeal joints, typical for erosive osteoarthritis, with narrowing of the metacarpophalangeal joints together with chondrocalcinosis (particularly well demonstrated in the right triquetropisiform joint), characteristic for calcium pyrophosphate dihydrate (CPPD) crystal deposition disease. |
 Figure 2.8 ▪ Frog-leg lateral view. A: For the frog-leg lateral projection of the proximal femur and hip, the patient is supine with knee flexed, the soles of the feet together, and the thigh maximally abducted. For simultaneous imaging of both hips, the central beam is directed vertically or with 10 to 15 degrees cephalad angulation to a point slightly above the pubic symphysis (inset). For selective examination of one hip, the central beam is directed toward the affected hip joint. B: The radiograph obtained in this projection demonstrates the lateral aspect of the femoral head and both trochanters. |
 Figure 2.9 ▪ Ferguson view. A: For the angled AP (Fergusson) view of the sacroiliac joints, the patient is in the same position as for the standard AP projection of the hips. The radiographic tube, however, is angled ˜ 30 to 35 degrees cephalad and the central beam is directed toward the midportion of the pelvis. B: The radiograph in this projection provides a tangential view of the sacroiliac joints and the sacral bone. C: This view clearly shows bilateral sacroiliitis in a patient with Crohn disease. |
 Figure 2.10 ▪ Weight-bearing view of the knee. A: AP non-weight bearing radiograph of the left knee of the patient with osteoarthritis shows narrowing of the medial femorotibial joint compartment, subchondral sclerosis, and marginal osteophytes. B: With weight bearing, there is collapse of the medial compartment under the weight of the body that resulted in varus deformity of the knee. |
 Figure 2.11 ▪ Merchant view. A: For the Merchant axial projection of the patella, the patient is supine on the table with the knee flexed ˜ 45 degrees at the table’s edge. A device keeping the knee at this angle also holds the film cassette. The central beam is directed caudally through the patella at a 60-degree angle from the vertical. B: On the radiograph obtained in this projection, the articular facets of the patella are well demonstrated. C: Merchant view of both patellae shows chondrocalcinosis in a patient with CPPD crystal deposition disease. D: Sulcus and congruence angles can also be evaluated on this projection. |
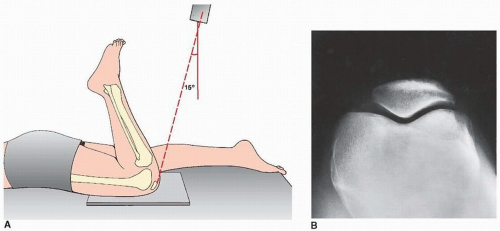 Figure 2.12 ▪ Sunrise view. A: For an axial (sunrise, skyline) view of the patella, the patient is prone, with the knee flexed 115 degrees. The central beam is directed toward the patella with ˜ 15-degree cephalad angulation. B: The radiograph in this projection demonstrates a tangential (axial) view of the patella. Note, however, the deep position of this structure within the intercondylar fossa, although the femoropatellar joint compartment is still well demonstrated. |
 Figure 2.13 ▪ Harris-Beath view. A: For the posterior tangential (Harris-Beath) view of the foot, the patient is erect, with sole of the foot flat on the film cassette. The central beam is usually angled 45 degrees toward the midline of the heel, but 35 or 55 degrees of angulation may also be used. B: On the radiograph in this projection, the middle facet of the subtalar joint is seen horizontally oriented, and the sustentaculum tali projects medially. The posterior facet projects laterally and is parallel to the middle facet. The body of the calcaneus is also well demonstrated. C: Tarsal (talocalcaneal) coalition at the middle facet of the subtalar joint is well demonstrated (arrows). |
 Figure 2.14 ▪ Broden’s view. A: For Broden’s view of the foot, the patient is supine, with the knee slightly flexed and supported by a small sandbag. The foot rests on the film cassette, dorsiflexed to 90 degrees, and, together with the leg, is rotated medially ˜ 45 degrees (inset). The central beam is directed toward the lateral malleolus. Radiographs may be obtained at 10, 20, 30, and 40 degrees of cephalad angulation of the tube. B: The radiograph obtained at 30-degree cephalad angulation demonstrates the posterior facet of the subtalar joint. Note also the good demonstration of the sustentaculum tali and the excellent visualization of the talofibular joint and the tibiofibular syndesmosis. |
 Figure 2.15 ▪ Open-mouth view. For the open-mouth view, the patient is either erect or supine; the head is straight and in the neutral position. With the patient’s mouth open as widely as possible, the central beam is directed perpendicular to the midpoint of the open mouth. During the exposure, the patient should softly phonate “ah” to affix the tongue to the floor of the mouth so its shadow is not projected over C1 and C2. On the radiograph obtained in this projection, the odontoid process, the body of C2, and the lateral masses of the atlas are well demonstrated; the atlantoaxial joints are seen to best advantage. |
 Figure 2.16 ▪ Fuchs view. A: For the Fuchs view of the odontoid process, the patient is supine on the table, with the neck hyperextended. The central beam is directed vertically to the neck just below the tip of the chin. B: On the radiograph obtained in this projection, the odontoid, especially its upper half, is clearly visualized. |
 Figure 2.17 ▪ Flexion-extension view of the cervical spine. Flexion (A) and extension (B) lateral radiographs of the cervical spine demonstrate subluxation of C2 (widening of the atlanto-odontoid distance with flexion) in a 66-year-old woman with rheumatoid arthritis. |
Digital (computed) radiography (DR or CR) is the name given to the process of digital image acquisition using an x-ray detector comprising a photostimulable phosphor imaging plate and image reader-writer that processes the latent image information for subsequent brightness scaling
and laser printing on film (Fig. 2.21). The system works on the principle of photostimulated luminescence. When the screen absorbs x-rays, the x-ray energy is converted to light energy by the process of fluorescence, with the intensity of light being proportional to the energy absorbed by the phosphor. The stimulated light is used to create a digital image (a computed radiograph). A major advantage of DR/CR over conventional film-screen radiography is that once acquired, the digital image data are readily manipulated to produce alternative renderings. Moreover, advantages of digitalization include contrast and brightness optimization by the manipulation of window width and level settings as well as a variety of image processing capabilities, quantization of image information, and facilitation of examination storage and retrieval. Digital imaging has vastly replaced conventional radiography, and images are mostly viewed in a PACS (picture archive and communication system) workstation, allowing one to change contrast and orientation, choose magnification, and obtain measurements of linear distances and angles, among many other customizations.
and laser printing on film (Fig. 2.21). The system works on the principle of photostimulated luminescence. When the screen absorbs x-rays, the x-ray energy is converted to light energy by the process of fluorescence, with the intensity of light being proportional to the energy absorbed by the phosphor. The stimulated light is used to create a digital image (a computed radiograph). A major advantage of DR/CR over conventional film-screen radiography is that once acquired, the digital image data are readily manipulated to produce alternative renderings. Moreover, advantages of digitalization include contrast and brightness optimization by the manipulation of window width and level settings as well as a variety of image processing capabilities, quantization of image information, and facilitation of examination storage and retrieval. Digital imaging has vastly replaced conventional radiography, and images are mostly viewed in a PACS (picture archive and communication system) workstation, allowing one to change contrast and orientation, choose magnification, and obtain measurements of linear distances and angles, among many other customizations.
 Figure 2.18 ▪ Oblique view of the cervical spine. A, B: An oblique view of the cervical spine may be obtained in the anteroposterior (as shown here) or posteroanterior projection. The patient may be erect or recumbent, but the erect position (seated or standing) is more comfortable. The patient is rotated 45 degrees to one side—to the left, as shown here, to demonstrate the right-sided neural foramina and to the right to demonstrate the left-sided neural foramina. The central beam is directed to the C4 vertebra with 15- to 20-degree cephalad angulation. B: The radiograph obtained in this projection is effective primarily for demonstrating the intervertebral neural foramina. C: Oblique radiograph of the cervical spine in a 72-year-old woman who reported neck pain radiating to both shoulders reveals multiple posterior osteophytes encroaching on numerous neural foramina (arrows). |
 Figure 2.19 ▪ Swimmer’s view. A: For the swimmer’s projection of the cervical spine, the patient is placed prone on the table with the left arm abducted 180 degrees and the right arm by the side, as if swimming the crawl. The central beam is directed horizontally toward the left axilla. The radiographic cassette is placed against the right side of the neck. B: The radiograph obtained in this projection provides adequate visualization of CT, T1, and occasionally T2 vertebrae, which would otherwise be obscured by the shoulders. |
TOMOGRAPHY AND COMPUTED TOMOGRAPHY
Among the ancillary imaging techniques, conventional tomography was used in the past, its major purpose being to demonstrate to better advantage the degree of joint destruction. Currently it has been replaced by computed tomography (CT).
CT is a radiologic modality containing an x-ray source, detectors, and a computer data processing system. The essential components of CT system include a circular scanning gantry, which houses the x-ray tube and image sensors; a table for the patient; an x-ray generator; and a computerized data processing unit. The patient lies on the table and is placed inside the gantry. The x-ray tube is rotated 360 degrees around the patient while the computer collects the data and formulates an axial image, or “slice.” Each cross-sectional slice represents a thickness between 0.1 cm and 1.5 cm of body tissue. The newest CT scanners use a rotating fan of x-ray beams, a fixed ring of detectors, and predetector
collimator. A highly collimated x-ray beam is transmitted through the area being imaged. The tissues absorb the x-ray beam to various degrees depending on the atomic number and density of the specific tissue. The remaining, unabsorbed (unattenuated) beam passes through the tissues and is detected and processed by the computer. The CT computer software converts the x-ray beam attenuations of the tissue into a CT number (Hounsfield units) by comparing them with the attenuation of water. The attenuation of water is designed as 0 (zero) H; that of air is designated as -400 to -1,000 H, fat as -60 to -100 H, body fluid as +20 to +30 H, muscle as +40 to +80 H, trabecular bone as +100 toa300 H, and normal cortical bone as +1,000 H. Routinely, axial sections are obtained; however, computer-reformatted images taken in multiple planes or reconstructed with three-dimensional (3D) techniques may be generated if desired.
collimator. A highly collimated x-ray beam is transmitted through the area being imaged. The tissues absorb the x-ray beam to various degrees depending on the atomic number and density of the specific tissue. The remaining, unabsorbed (unattenuated) beam passes through the tissues and is detected and processed by the computer. The CT computer software converts the x-ray beam attenuations of the tissue into a CT number (Hounsfield units) by comparing them with the attenuation of water. The attenuation of water is designed as 0 (zero) H; that of air is designated as -400 to -1,000 H, fat as -60 to -100 H, body fluid as +20 to +30 H, muscle as +40 to +80 H, trabecular bone as +100 toa300 H, and normal cortical bone as +1,000 H. Routinely, axial sections are obtained; however, computer-reformatted images taken in multiple planes or reconstructed with three-dimensional (3D) techniques may be generated if desired.
 Figure 2.20 ▪ Lateral view of the thoracic spine, autotomography. For the lateral view of the thoracic spine, the patient is erect with the arms elevated. The central beam is directed horizontally to the level of the T6 vertebra with about 10 degrees of cephalad angulation. To eliminate the structures that could obscure the bone elements of the thoracic spine, the patient is instructed to breathe shallowly during the exposure. A: The radiograph in this projection demonstrates a lateral image of the vertebral bodies and intervertebral disk spaces. B: In a patient with degenerative disk disease note narrowing of several intervertebral disk spaces, formation of anterior osteophytes, and focal calcifications of anterior longitudinal ligament. C: In a patient with diffuse idiopathic skeletal hyperostosis (DISH syndrome) observe characteristic anterior flowing hyperostosis and relative good preservation of the disk spaces. D: In a patient with ankylosing spondylitis, there is squaring of the vertebral bodies and formation of delicate anterior and posterior syndesmophytes, giving the appearance of “bamboo” spine. |
 Figure 2.21 ▪ Digital radiography. Digital radiograph of the elbow (A) without and (B) with edge enhancement. The bone and soft tissue details are better appreciated than on the standard radiographs. C: Digital radiograph of the elbow of a patient with advanced rheumatoid arthritis shows osteopenic bones and articular erosions. |
The introduction of spiral (helical) scanning was a further improvement of CT. This technique, referred to as volume-acquisition CT, has made possible a data-gathering system using continuous rotation of the x-ray source and the detectors. It allows the rapid acquisition of volumes of CT data and renders the ability to reformat the images at any predetermined intervals ranging from 0.5 mm to 10.0 mm. Unlike standard CT, in which up to a maximum of 12 scans could be obtained per minute, helical CT acquires all data in 24 or 32 seconds, generating up to 92 sections. This technology has markedly reduced scan times and has eliminated interscan delay and hence interscan motion. It also has decreased the motion artifacts, improved the definition of scanned structures, and markedly facilitated the ability to obtain 3D reconstructions generated from multiple overlapping transaxial images acquired in a single breath-hold. Spiral CT allows data to be acquired during the phase of maximum contrast enhancement, thus optimizing the detection of abnormality. The data volume may be viewed either as conventional transaxial images (Figs. 2.22 and 2.23) or as multiplane reformation (Fig. 2.24) and 3D reconstruction (Fig. 2.25).
Most recently, with the advent of multichannel multi-detector-row CT (MDCT), images can be generated with subsecond gantry rotation times yielding high-resolution volume data sets, and at the same time minimizing the radiation dose to the patient. Even more advanced is high-resolution flat-panel volumetric CT (fpVCT), which uses digital flat-panel detectors and provides volumetric coverage as well as ultra-high spatial resolution in two-dimensional (2D) and 3D projections. Furthermore, it reduces metal and beam-hardening artifacts. In addition to the aforementioned features, fpVCT also allows dynamic imaging of time-varying processes.
Occasionally, iodinated contrast agents may be used intravenously to enhance the CT images. A contrast agent directly alters image contrast by increasing the x-ray attenuation, thus displaying increased brightness in the CT images.
CT is effective in evaluating degenerative and inflammatory changes of various joints (see Figs. 2.22B, C, 2.24, and 2.25), and in the spine to document spinal stenosis (see Fig. 2.23). In the assessment of spinal stenosis secondary to degenerative changes, CT examination may also be performed after myelography (Fig. 2.26), although myelography alone is often sufficient (see later and Fig. 2.38).
 Figure 2.22 ▪ Computed tomography, axial sections. A: In this direct transaxial image, the normal sternoclavicular joints are well depicted. B: Axial CT image of the hip joints of a 55-year-old man with osteoarthritis shows narrowing of the joint spaces, subchondral sclerosis, and osteophyte formation (arrows). In addition, there is an osteochondral body present within the medial joint compartment of the left hip (open arrow). C: Axial CT section through the sacroiliac joints of a 49-year-old man with psoriatic arthritis shows diffuse narrowing of the joints and articular erosions (arrows). |
 Figure 2.23 ▪ Computed tomography of spinal stenosis. Axial CT section of the lumbar spine of a 66-year-old man with degenerative spine disease shows osteoarthritis of the facet joints and marked narrowing of the spinal canal. |
 Figure 2.24 ▪ Computed tomography, multiplane reformations. A: Reformatted in the coronal plane CT image of the right hip of a 64-year-old man with osteoarthritis shows narrowing of the joint space, subchondral sclerosis, and acetabular protrusio. Coronal (B) and sagittal reformatted (C) CT images of the elbow of another patient show joint space narrowing, osteophyte formation, and intra-articular osteochondral bodies typical for osteoarthritis. |
 Figure 2.25 ▪ Computed tomography, 3D reconstruction. A, B: 3D CT images of an elbow joint in shaded surface display demonstrate advanced osteoarthritis. |
 Figure 2.26 ▪ CT myelogram. A: Axial CT section of the cervical spine obtained after myelography shows impingement of the posterior osteophyte on the thecal sac (open arrow). B: In another patient, sagittal reformatted CT image of the lumbar spine shows advanced degenerative disk disease at L2-L3 associated with vacuum phenomenon. Numerous osteophytes are seen arising from the vertebral bodies. Posterior osteophytes arising from the vertebral bodies L1 and L2 are impinging on the ventral aspect of the thecal sac filled with water-soluble contrast. |
 Figure 2.27 ▪ Dual-energy CT of tophaceous gout. A 45-year-old man presented with a painful mass of the small toe of the left foot for past 4 months. A: AP radiograph shows a soft tissue mass at the lateral aspect of the fifth metatarsophalangeal joint (arrow); however, the osseous structures are intact and there is no evidence of erosions. Dual-energy coronal (B) and sagittal (C) reformatted color-coded CT images, in addition to the mass at the small toe (arrow), reveal unsuspected masses (green areas) in the plantar (arrowhead) and posterior aspects (curved arrow) of the hindfoot, consistent with uric acid crystal deposition within the gouty tophi in clinically occult sites. |
 Figure 2.28 ▪ Dual-energy CT of tophaceous gout. A: Anteroposterior radiograph of the right wrist of a 72-year-old man shows erosions of the capitate, scaphoid, and lunate (arrows) of unknown etiology. Osteoarthritis is noted of the scaphoid-trapezium-trapezoid joint (arrowhead). B: Sagital DECT color-coded image shows the presence of urate crystals (green). C, D: 3D reformatted CT images show the exact anatomic relationship between the monosodium urate-containing gouty tophi (green) and osseous structures. |
Recently dual-energy CT (DECT) gained a wide acceptance as a modality used for detection or exclusion of tophaceous gout. The DECT system is equipped with two x-ray tubes with different peak kilovoltages (80 kVp and 140 kVp), thus allowing simultaneous acquisition of two sets of images of the desired anatomic region. The material-specific differences in attenuation of various elements enable classification of the chemical composition of scanned tissue, allowing accurate and specific characterization and separation of monosodium urate from calcium-containing mineralization. DECT data yield color-coded cross-sectional images, clearly depicting the foci of accumulation of urate crystals (Fig. 2.27). The 3D reconstructed images may also be generated (Fig. 2.28). In addition, in patients with known tophaceous gout, this technique may be used for serial volumetric quantification of subclinical tophus to evaluate response to treatment.
 Figure 2.29 ▪ Arthrography of osteoarthritis. Double-contrast arthrogram of the knee in a 62-year-old man with a history of progressive pain localized to the medial femorotibial joint compartment demonstrates destruction of the articular cartilage (arrow) and a degenerative tear of the free edge of the medial meniscus (open arrow), consistent with osteoarthritis. |
 Figure 2.30 ▪ Arthrography of infectious arthritis. A: Anteroposterior radiograph of the left hip of a 64-year-old woman who had had an upper respiratory infection 6 months before shows complete destruction of articular cartilage on both sides of the joint and erosion of the femoral head diagnostic of septic arthritis. B: Contrast arthrogram was performed primarily to obtain joint fluid for bacteriologic examination, which yielded S. aureus. The contras agent outlines the destroyed joint, showing a synovial irregularity consistent with chronic infectious synovitis. |
ARTHROGRAPHY
ANGIOGRAPHY, CT ANGIOGRAPHY, AND MR ANGIOGRAPHY (MRA)
The use of contrast material injected directly into selective branches of both the arterial (arteriography) and venous (venography) circulation has aided greatly in assessing the involvement of the vascular system in systemic rheumatologic diseases and has provided a precise method for defining local pathology. Characteristic anatomic locations and patterns of involvement can be seen in such disorders as Takayasu arteritis, temporal arteritis, polyarteritis nodosa, and other forms of systemic vasculitis. Because generalized arteritis commonly involves the bowel, resulting in ischemia, necrosis, and hemorrhage, selective arteriography may be used diagnostically to differentiate diffuse from localized processes. Currently, instead of arteriography, CT angiography (Figs. 2.31, 2.32, and 2.33) and magnetic resonance arteriography (Figs. 2.34, 2.35, and 2.36) are more commonly performed. In particular, the latter imaging technique, with recent innovations in hardware and software and the advent of 3.0-Tesla magnets
has allowed reduction in exogenous contrast dose without compromising overall image quality. It is an effective modality allowing detection of aneurysms, vessel stenosis, and obstruction; by using the double invasion recovery (DIR) “black blood” technique (by suppressing the signal from flowing blood while maintaining high signal in the surrounding stationary tissues), it can also assess the vessel wall thickness. Conventional arteriography, however, can be used therapeutically by employing embolization with specially designed coils or clot-promoting or endogenously formed clotted material to stop localized areas of hemorrhage, often preventing a major abdominal surgical procedure in an otherwise severely compromised patient. Central vessels occlusion is achieved by detachable balloons, metallic coils, or Gelfoam particles. Conversely, for peripheral and capillary vessels occlusion, Ethibloc, tissue glue and particles with an average size from 500 µm to 750 µm can be employed.
has allowed reduction in exogenous contrast dose without compromising overall image quality. It is an effective modality allowing detection of aneurysms, vessel stenosis, and obstruction; by using the double invasion recovery (DIR) “black blood” technique (by suppressing the signal from flowing blood while maintaining high signal in the surrounding stationary tissues), it can also assess the vessel wall thickness. Conventional arteriography, however, can be used therapeutically by employing embolization with specially designed coils or clot-promoting or endogenously formed clotted material to stop localized areas of hemorrhage, often preventing a major abdominal surgical procedure in an otherwise severely compromised patient. Central vessels occlusion is achieved by detachable balloons, metallic coils, or Gelfoam particles. Conversely, for peripheral and capillary vessels occlusion, Ethibloc, tissue glue and particles with an average size from 500 µm to 750 µm can be employed.
 Figure 2.31 ▪ CT angiography. Normal 3D CT angiogram of the chest. |
 Figure 2.32 ▪ CT angiography of Takayasu arteritis. A: 3D reconstructed volume-rendering image of the neck of a 37-year-old woman obtained after intravenous administration of 125 mL of Omnipaque 350 shows narrowing of the left subclavian artery distal to the origin of the carotid artery (arrow). B: 3D CT reconstructed volume-rendering image of the thoracic and abdominal aorta shows diffuse narrowing of the abdominal aorta (arrow), calcified plaque at the diaphragmatic hiatus, stenosis at the origin of the celiac axis, and occlusion of the right main renal artery. |
 Figure 2.33 ▪ CT angiography of Takayasu arteritis. A 56-year-old woman, who was diagnosed with Takayasu arteritis three years before, presented with high blood pressure, pain in the abdomen and lower extremities, dizziness, and headache. A: After intravenous administration of 100 mL of Omnipaque 350, 3D CT-reconstructed volume-rendering image shows significant narrowing of the lower thoracic and abdominal aortic segments, most pronounced at the diaphragmatic hiatus (arrow). There is also mild dilatation of proximal renal and mesenteric arteries. B: After surgery, which consisted of placement of abdominal aorta graft, 3D CT reconstructed volume-rendering image obtained after intravenous administration of 125 mL of Omnipaque 350 injected at a rate of 4.0 mL/s demonstrates the abdominal aorta graft (curved arrow) that extends from the thoracic aorta to the bifurcation. The native abdominal aorta is diffusely narrowed (arrow) and shows sclerotic plaques. Visualized branches of the bypass graft include the left renal artery, celiac artery, and superior mesenteric artery, all of which are patent. |
 Figure 2.34 ▪ MR angiography, normal study. A 27-year-old woman was diagnosed with mixed connective tissue disease. Because vasculitis and occlusion of femoral artery were also suspected, she underwent magnetic resonance arteriography. Coronal MRI of the knee (A) demonstrated medullary bone infarctions in the distal femora; however MRA (B) shows no abnormalities of the vessels. |
 Figure 2.35 ▪ MR angiography, artery occlusion. A 67-year-old woman with clinically documented rheumatoid arthritis presented with a history of intermittent pain in both lower extremities exaggerating by walking. MRI obtained after intravenous injection of 20 cc of Magnevist gadolinium-based contrast shows significant narrowing of the right popliteal artery (arrow) and a complete occlusion of the left popliteal artery (curved arrow) with collateral circulation and reconstitution of the short distal segment at the level of popliteal fossa (open arrow). |
 Figure 2.36 ▪ MR angiography of Takayasu arteritis. After intravenous administration of 20 mL of gadodiamide (a gadolinium-based contrast agent), 3D MR angiography of the chest and neck was performed in a 64-year-old man diagnosed with myelodysplastic syndrome and large vessel arteritis. A: In the arterial phase, note the narrowing of the left subclavian and left carotid arteries. B: In addition, the mixed arterial and venous phase demonstrates occlusion of the left subclavian, left internal jugular, and left brachiocephalic veins. Note several enlarged neck lymph nodes (arrows) representing Hodgkin lymphoma. Normal chest MR angiogram in arterial (C) and mixed (D) phases is shown for comparison. |
MYELOGRAPHY AND CT MYELOGRAPHY
Myelography is still occasionally being used alone (Figs. 2.37, 2.38, 2.39, 2.40) or in conjunction with CT in evaluation of spinal stenosis or disk herniation (Figs. 2.41 and 2.42); however, its role has been significantly diminished with use of CT and magnetic resonance imaging (MRI).
DISKOGRAPHY
Diskography is a radiologic procedure consisting of injection of a contrast material into the nucleus pulposus under fluoroscopic guidance. Although this is a controversial procedure abandoned by many radiologists, under tightly restricted indications and immaculate technique, a diskogram can yield valuable information. Diskography is an
effective aid to determine the source of a patient’s low back pain. It is not purely an imaging technique because the symptoms produced during the test (pain during the injection of contrast, known as pain provocation) are considered to have even greater diagnostic value than do the obtained radiographs. This technique should always be combined with CT examination (so-called CT diskography) (Figs. 2.43 and 2.44).
effective aid to determine the source of a patient’s low back pain. It is not purely an imaging technique because the symptoms produced during the test (pain during the injection of contrast, known as pain provocation) are considered to have even greater diagnostic value than do the obtained radiographs. This technique should always be combined with CT examination (so-called CT diskography) (Figs. 2.43 and 2.44).
 Figure 2.37 ▪ Myelography. For myelographic examination of the lumbar spine, the patient is prone on the table. The puncture site, usually at the L3-L4 or L2-L3 level, is marked under fluoroscopic control. A 22-gauge needle is inserted into the subarachnoid space, and free flow of spinal fluid indicates proper placement. Iohexol or iopamidol (15 mL), in a concentration of 180 mg iodine per milliliter, is slowly injected, and films are obtained in the posteroanterior (A), left and right oblique (B), and cross-table lateral (C) projections. In these normal studies, contrast is seen outlining the subarachnoid spaces of the thecal sac as well as the cul-de-sac or most caudal part of the subarachnoid space. The nerve roots appear symmetric on both sides of the contrast column. A linear filling defect represents a nerve root in its contrast-filled sleeve. The length of the root pocket may vary from one patient to another, but in each patient, all roots are approximately equal in length. It is imperative during myelographic examination of the lumbar segment to obtain one spot film of the thoracic segment at the level T10-T12 (D) because tumors localized in the conus medullaris may mimic the clinical symptoms of a herniated lumbar disk. |
 Figure 2.38 ▪ Myelography of disk infection. A 39-year-old man with a history of pulmonary tuberculosis developed acute neurologic symptoms of spinal cord compression. A: Anteroposterior radiograph of the lower thoracic spine shows minimal disk-space narrowing at T9-T10 and a large paraspinal mass (arrow). B: Myelogram shows complete obstruction of the flow of contrast agent in the subarachnoid space at the level of disk infection (arrows). |
 Figure 2.39 ▪ Myelography of spinal stenosis. Lateral radiograph of the lumbosacral spine obtained after injection of metrizamide into the subarachnoid space shows an “hourglass” configuration of the contrast agent in the thecal sac, a feature characteristic of spinal stenosis. This appearance results from concominent hypertrophy of the facet joints and posterior bulging of the intervertebral disks. |
 Figure 2.40 ▪ Myelography of disk herniation. Lateral spot film obtained during myelography in a 38-year-old man demonstrates a large posterior herniation of the intervertebral disk L4-L5 (arrow). |
 Figure 2.41 ▪ CT myelography of disk herniation. A 47-year-old man presented with severe back pain radiating to the right buttock and leg. A: Spot film in the oblique projection obtained during myelography shows an extradural defect on the right side of the thecal sac at the L5-S1 disk space (arrow) involving the right S1 nerve root, which is cut off (open arrow). The S2 nerve root is normally outlined (curved arrow). B, C: CT sections also obtained during myelography demonstrate the lack of opacification of the S1 nerve root on the right side and a large herniation of the L5-S1 disk compressing the thecal sac from the right. |
 Figure 2.42 ▪ 3D CT myelography of disk herniation. A 3D CT-reconstructed image in maximum intensity projection (MIP) of the lower thoracic spine was obtained after contrast agent was injected into the thecal sac (CT myelography). There is disk herniation at the level of T7-T8 (arrow) associated with complete obstruction of contrast flow (open arrows). The curved arrow points to the spinal cord. |
SCINTIGRAPHY (RADIONUCLIDE BONE SCAN)
Scintigraphy is a modality that detects the distribution in the body of a radioactive agent injected into the vascular system. After an intravenous administration of a radiopharmaceutical agent, the patient is placed under a scintillation camera, which detects the distribution of radioactivity in the body by measuring the interaction of gamma rays emitted from the body with sodium iodide crystals in the head of the camera. The photoscans are obtained in multiple projections and may include either the entire body or selected parts. One major advantage of skeletal scintigraphy over all other imaging techniques (excluding positron emission tomography [PET]) is its ability to image the entire skeleton at once (Fig. 2.45). As Johnson remarked, it provides a “metabolic picture,” anatomically localizing a lesion by assessing its metabolic activity compared with that of adjacent normal bone. A bone scan can confirm the presence of the disease, demonstrate the distribution of the lesion,
and help to evaluate the activity of the pathologic process. Although it is a very sensitive modality, its specificity is very low. Indications for skeletal scintigraphy include traumatic conditions, tumors, various arthritides, infections, and metabolic bone diseases. The detected abnormality may consist of either decreased uptake of a bone-seeking radiopharmaceutical agent (e.g., in the early stage of osteonecrosis) or increased uptake (e.g., in case of fractures, neoplasms, or arthritis). Some anatomic structures under normal conditions may show increased activity (such as sacroiliac joints or growth plates).
and help to evaluate the activity of the pathologic process. Although it is a very sensitive modality, its specificity is very low. Indications for skeletal scintigraphy include traumatic conditions, tumors, various arthritides, infections, and metabolic bone diseases. The detected abnormality may consist of either decreased uptake of a bone-seeking radiopharmaceutical agent (e.g., in the early stage of osteonecrosis) or increased uptake (e.g., in case of fractures, neoplasms, or arthritis). Some anatomic structures under normal conditions may show increased activity (such as sacroiliac joints or growth plates).
 Figure 2.43 ▪ Diskography. For diskographic examination of the lumbar spine, the patient is prone on the table, and the level of the injection, depending on the indication, is marked. The needle is inserted into the center of the nucleus pulposus, and about 2 mL to 3 mL of metrizamide is injected. A: Lateral radiograph of a normal diskogram shows a concentration of contrast agent in the nucleus pulposus outlining the disk; there should be no leak of contrast while the needle is in place. B: CT section through the L3-L4 disk space after diskography shows the normal appearance of this structure. |
In rheumatology, radionuclide bone scanning is much more commonly used than other techniques, mainly for evaluating the distribution of arthritis in different joints. The radiopharmaceuticals currently in use in bone scanning include organic diphosphonates—ethylene diphosphonate (HEPD) and methylene diphosphonate (MDP)—labeled with 99m technetium (99mTc), a gamma emitter with a 6-hour half-life; MDP is more commonly used, typically in a dose that provides 15 mCi (555 MBq) of 99mTc (see later). Its uptake in bone is related to both osteoblastic activity and the regional blood flow. After intravenous injection of the radiopharmaceutical, ˜ 50% of the dose localizes in bone, with the remainder circulating freely in the body and eventually excreted by the kidneys. A gamma camera can then be used in a procedure known as a four-phase radionuclide bone scanning. Scintigraphy can determine the distribution of arthritic changes in the skeleton (Figs. 2.46 and 2.47) and at the specific sites (Figs. 2.48, 2.49, 2.50, 2.51, 2.52), as well as in areas usually not detected by standard radiography like sternomanubrial or temporomandibular joints among others. This technique is also useful in distinguishing infected joint from infected periarticular soft tissues if radiography is not diagnostic and the patient cannot undergo MRI because of contraindications such as the presence of cardiac pacemaker, cerebral aneurysm clips, or claustrophobia. With cellulitis, diffusely increased uptake of the radiopharmaceutical agent is present in the first two phases, but there is no significant increase of uptake in the third or fourth delayed phases (Fig. 2.53). Conversely, osteomyelitis and septic arthritis cause focally increased uptake in all four phases (Fig. 2.54). Radionuclide bone scanning is also an effective modality to discriminate whether the failure of arthroplasty occurred secondary to mechanical loosening of the prosthesis or infection (Figs. 2.55, 2.56, 2.57, 2.58, 2.59, 2.60). To distinguish infectious arthritis from other forms of arthritides, indium-111 (111In) labeled white blood cells (WBCs), either alone or in combination with 99mTc sulfur colloid (also known as indium leukocyte imaging) (Figs. 2.61 and 2.62)
and 57Ga scans are employed. The use of 99mTc hexamethylpropylene amine oxime (HMPAO)-labeled WBC for diagnosing infectious processes has also been recently advocated. The kinetics and normal distribution of such leukocytes are similar to those of 111In-labeled leukocytes. The superior resolution and count density of 99mTc, however, gives this technique an advantage over the use of 111In-labeled WBCs. Another radiopharmaceutical used for detection of infection and inflammation is 99mTc-labeled interleukin 8 (IL-8). A small protein (8.5 kDa) that belongs to the CXC subfamily of chemokines, IL-8 is a chemotactic cytokine that binds with a high affinity to receptors expressed on neutrophils. More recently, imaging of the joints affected by rheumatoid arthritis was attempted using 99mTc-labeled specific murine anti-CD4 and nonspecific human immunoglobulin. The rationale to use this radiopharmaceutical agent was the presence of CD4 molecules on T helper cells and macrophages, both abundantly present in inflammatory infiltrates of rheumatoid arthritis. Moreover, some investigators developed a method for imaging inflammatory joints using a monoclonal antibody (1.2B6) against E-selectin, an endothelial cell-specific adhesion molecule. They compared 111In-anti-E-selectin
mAb and 99mTc-labelled human nonspecific immunoglobulins in the scintigraphic imaging of rheumatoid arthritis, concluding that 111In-1.2B6 is a sensitive method by which to assess RA activity and that targeting is more intense and specific than using 99mTc human immunoglobulin.
Related posts:


Stay updated, free articles. Join our Telegram channel

Full access? Get Clinical Tree


