Renal tumors encompass a heterogeneous disease spectrum, which confounds patient management and treatment. Percutaneous biopsy is limited by an inability to sample every part of the tumor. Radiomics may provide detail beyond what can be achieved from human interpretation. Understanding what new technologies offer will allow radiologists to play a greater role in caring for patients with renal cell carcinoma. In this article, we review the use of radiomics in renal cell carcinoma, in both the pretreatment assessment of renal masses and posttreatment evaluation of renal cell carcinoma, with special emphasis on the use of multiparametric MR imaging datasets.
Key points
- •
Radiomics includes various techniques for the extraction of quantitative features from imaging to improve diagnostic, prognostic, and predictive accuracy of image interpretation, but mandates standardization and large and well-designed databases for optimal use.
- •
Radiomics in the pretreatment assessment of kidney cancer may provide additional insight into the subtyping and tumor biology of renal cell carcinoma.
- •
In the posttreatment setting, radiomics may assist in predicting a response to systemic therapy, including to antiangiogenic treatment, which may not be adequately assessed with traditional size-based criteria.
Introduction
Renal tumors encompass a broad disease spectrum, from benign and indolent lesions to aggressive and invasive malignancies. Imaging plays a critical role in the management of patients with renal tumors. Small renal masses (SRMs), defined as those 4 cm or less in size, account for more than 50% of all renal masses with approximately 20% of these demonstrating malignant behavior. The American Urologic Association guidelines for management of renal masses contemplate active surveillance as a valid option for patients with comorbidities and T1a (≤4 cm) or T1b (4–7 cm) tumors. The ability to predict the histology of these renal lesions to distinguish aggressive forms of renal cell carcinoma (RCC) from benign and indolent malignant lesions with imaging has been a primary topic of interest. Furthermore, despite the reported low risk of metastases in larger tumors (ie, cT1b/T2, >4 cm) followed on active surveillance, the lack of reliable predictors of oncologic behavior and low reliability of biopsies to grade larger, heterogeneous tumors limit the applicability of active surveillance in clinical practice for these tumors. Moreover, there is currently no accepted neoadjuvant therapy regimen in the management of kidney cancer. The inherent heterogeneous nature of renal tumors drives the need to better characterize the disease and overcome the sampling variability of percutaneous biopsies. Imaging provides a whole tumor assessment that has the potential to help select effective therapies for specific histologic subtypes. Nevertheless, the known histologic and molecular heterogeneity within the subtypes of RCC, and even within a single tumor, is such that the development of reliable imaging biomarkers to predict the histology and biologic behavior of these lesions is challenging.
Radiomics is an emerging field that attempts to extract data from imaging to provide information beyond what can be achieved from human imaging interpretation alone. The correlation of these imaging data with genomics (ie, radiogenomics), metabolomics (ie, radiometabolomics), and beyond offers an opportunity to generate objective, quantitative biomarkers of tumor biology that may be used to predict patient’s prognosis and likelihood of response to therapy, overcoming some of the challenges associated with disease heterogeneity ( Fig. 1 ). Magnetic resonance (MR) imaging provides rich imaging datasets because of the multiple image contrast mechanisms available with this technique (ie, multiparametric MR imaging). These datasets offer a unique opportunity to implement radiomic analysis. In this article, we review the use of radiomics in RCC, in both the pretreatment assessment of renal masses and the posttreatment evaluation of RCC, with a special emphasis on the use of multiparametric MR imaging datasets.

Radiomics overview
Radiomics is a term that includes various techniques for the extraction of quantitative features from imaging to improve diagnostic, prognostic, and predictive accuracy of image interpretation. Gillies and colleagues define radiomics as “the conversion of images to higher dimensional data and the subsequent mining of these data for improved decision support.” Radiomics approaches provide a mechanism to identify complex patterns in images that are not obvious to the naked eye. The recent breakthroughs in artificial intelligence and computer power have accelerated the application of this type of analysis to medical imaging to guide clinical decisions.
The process begins with the selection and standardization of an imaging protocol. Uniformity in image acquisition is vital in any radiomics assessment to decrease variability and improve the reproducibility and comparability of studies. Mackin and colleagues reported a similar level of variability in the values of radiomics features calculated on computed tomography (CT) images obtained from different CT scanners to that of the variability of these radiomics features found in CT images of patients with non-small cell lung cancers. In MR imaging, standardization of image acquisition may represent a greater challenge owing to the interplay of numerous factors including hardware (ie, magnet strength, coil selection, etc), sequence parameters, and contrast agents. For example, with dynamic contrast-enhanced (DCE) MR imaging, the type and dose contrast agent, software used to extract the pharmacokinetic parameters, and pulse sequence used for image acquisition must be accounted for. Nevertheless, several organizations have attempted to introduce standardization of imaging techniques for quantitative analyses, such as the Quantitative Imaging Biomarkers Alliance , and the Image Biomarker Standardization Initiative (IBSI).
Once an appropriate imaging protocol is selected, a volume of interest is identified. Depending on the prediction target, analyses can be performed on an entire lesion, metastases, and/or normal tissues. Additionally, analyses may be performed on subvolumes of tumor known as habitats, regions that may exhibit unique physiologic characteristics from the remainder of the tumor. Volume of interests are then segmented, either manually or automatically, to determine which voxels are analyzed.
Segmentation is considered a critical component of radiomics, because the subsequent features data are generated from the segmented volumes. Manual segmentation is considered as ground truth, but it is labor intensive, may not be feasible with large volumes of data, and suffers from interoperator variability. Semiautomatic segmentation methods, such as region-growing and level set methods, may maximize outputs and provide greater reproducibility, although they still require some level of manual input by the operator. The method of segmentation can also affect the radiomic analysis. Once the volumes are segmented, feature extraction can then be performed.
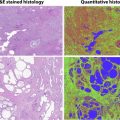
Feature extraction involves the mining of quantitative attributes from the segmented volumes and encompasses the center of radiomics. The number of radiomic features that can be extracted is essentially limitless and requires careful selection, because the inclusion of too many features could result in overfitting. Predictive and prognostic radiomic features should be extracted from training sets and validated in independent datasets, when possible, to diminish the opportunity of overfitting. Features can be subdivided into 2 broad categories: semantic and agnostic features. Semantic features include descriptors commonly used in image interpretation by the radiologist, such as lesion shape, margin, and location. Agnostic features are those mathematically extracted from the image and can be further subdivided into first-, second-, and higher-order statistical outputs.
First-order statistics are obtained from the histogram of voxel intensities to provide characteristics such as the mean, skewness/asymmetry, kurtosis/sharpness, and measures of randomness, including entropy and uniformity. First-order features describe the distribution of intensities without taking into account the spatial relationship of voxels. Second-order, or texture or grayscale features, are based on matrices depicting spatial intensity distribution and describe the relationship between voxels with similar or different intensity values and can provide a measurement of intratumoral heterogeneity. Examples of these include gray-level cooccurrence matrix ( Fig. 2 ) and run-length matrix. Haralick first described a series of texture features commonly applied to medical imaging ( Box 1 ). Finally, higher-order statistical outputs use filter grids on the image to identify repetitive or nonrepetitive patterns.

Angular second momentum
Contrast
Correlation
Difference entropy
Difference variance
Energy
Entropy
Homogeneity
Information measure of correlation 1
Information measure of correlation 2
Max correlation coefficient
Sum average
Sum entropy
Sum variance
Ultimately, the goal of radiomics is to use imaging features to identify patterns that can be used individually or correlated with patient characteristics beyond imaging (eg, histology, immunohistochemistry, and genomic and proteomic profiles) to generate objective, quantitative biomarkers of disease status that can improve diagnosis, inform patient prognosis, and predict response to therapy. This requirement for expansive datasets mandates the creation of large databases through which data may be mined and patterns may be discovered. An intermediate step toward the described radiomic analysis is the use of quantitative MR imaging techniques for characterization of disease aggressiveness in kidney cancer. Understanding the correlation between these quantitative techniques and histopathologic, metabolic, and genetic conditions will facilitate the implementation of radiomic analyses. Here we discuss some of these techniques for evaluation of patients with renal masses in general, localized kidney cancer, and locally advanced and/or metastatic kidney cancer.
Radiomics in the pretreatment assessment of renal masses
Intratumor heterogeneity presents a challenge in the preoperative assessment of renal masses. Percutaneous biopsy is an invasive procedure with excellent accuracy for the diagnosis of kidney cancer. However, biopsies are limited by the inability to sample every part of the tumor or at multiple time points, potentially limiting the accurate characterization of renal masses (ie, subtyping, tumor grading). MR imaging is well-suited for a comprehensive evaluation of renal masses, particularly with its ability to provide quantitative and functional assessments, such as diffusion-weighted imaging (DWI), arterial spin labeling (ASL), and DCE imaging. MR imaging may also be used at multiple time points without the drawback of radiation exposure, allowing renal masses to be followed over time to detect changes in lesion characteristics, which may reflect changes in tumor histology and aggressiveness.
Radiomics for Subtyping of Renal Masses
The noninvasive characterization of renal masses using qualitative features on MR imaging has been well-described. The more common subtypes of RCC can be differentiated primarily using a combination of T2-weighted and postcontrast imaging. Clear cell RCC (ccRCC), the most common and aggressive subtype, most often exhibits hyperintense signal on T2-weighted images and avid enhancement, in addition to intravoxel fat. In contrast, papillary RCC tends to show hypointense signal on T2-weighted imaging and show low-level enhancement. Finally, chromophobe RCC can demonstrate variable signal intensity relative to renal parenchyma on T2-weighted images and show moderate enhancement.
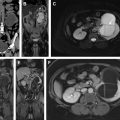
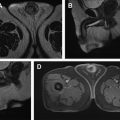
Quantitative assessment of renal mass enhancement is not just an academic exercise. Indeed, there are several clinical scenarios where these measures can have substantial impact on patient management. Therefore, attention to the acquisition technique and standardization across patients is important. For example, a high arterial-to-delay enhancement ratio (>1.5) on multiphasic contrast-enhanced MR imaging, combined with homogeneous low signal intensity on T2-weighted images, has a sensitivity of 73% and specificity of 99% in distinguishing an angiomyolipoma without visible fat (ie, fat-poor angiomyolipoma [fpAML]) from RCC. Quantification of contrast enhancement on multiphasic contrast-enhanced MRI can play a complementary role to tissue biopsies in patients presenting with locally advanced and/or synchronous metastatic disease at diagnosis and can assist in the selection of optimal therapy for these patients ( Fig. 3 ).

Quantitative assessment with DWI may be useful in assisting with characterizing renal masses as well. Signal on DWI depends on the motion of water molecules in the extracellular space and provides a noninvasive assessment of tissue cellularity, integrity of cell membranes, and microcapillary perfusion. Overall, malignant solid renal masses are reported to demonstrate lower apparent diffusion coefficient (ADC) values than benign lesions. Using qualitative features alone, renal oncocytomas exhibit imaging features that may overlap with subtypes of RCC, particularly ccRCC and chromophobe RCC. A metaanalysis of DWI of renal lesions, however, described ADC values for renal oncocytomas tend to be higher (2 ± 0.08 × 10 −3 mm 2 /s) than RCC (1.5 ± 0.08 × 10 −3 mm 2 /s). For example, Taouli and colleagues reported significantly higher ADC values for renal oncocytomas (mean ADC, 1.91 ± 0.97 × 10 −3 mm 2 /s) than solid RCCs (mean ADC, 1.54 ± 0.69 × 10 −3 mm 2 /s).
Nevertheless, absolute ADC values are affected by numerous factors and may vary between MR systems and field strengths. Histogram analyses may help to overcome these limitations and provide a more reliable quantitative assessment, because distribution parameters are independent of signal intensity. A histogram analysis of DWI features may be used to differentiate benign from malignant neoplasms, because histogram-based assessment provides the benefit of quantitatively assessing the heterogeneity characteristically exhibited by ccRCC. Gaing and colleagues used whole lesion histogram analysis of intravoxel incoherent motion (IVIM) on renal lesions, and of the distribution parameters, kurtosis (ie, a measure of flatness of the histogram) of the perfusion fraction was the only variable to distinguish renal oncocytomas from ccRCC. These authors also found that the mean and standard deviation of tissue diffusivity and kurtosis of perfusion fraction could distinguish ccRCC from fpAML. Histogram analysis of contrast enhancement patterns has been used to differentiate among different renal masses as well. Chandarana and colleagues found the histogram distribution parameters of kurtosis and skewness on contrast-enhanced MR imaging acquisitions to be significantly different between ccRCC and papillary RCC.
Textural analyses have also been used on CT to predict histologic subtypes and grade. On portal venous phase images, entropy, a measure of histogram uniformity, and standard deviation correlate positively with ccRCC subtype on whole lesion analyses. In the same study, an association between texture features and survival measures, including overall survival and time to disease recurrence, was seen with the histogram distribution parameters of standard deviation, mean, and entropy on unenhanced CT images. Global heterogeneity features, including run-length nonuniformity and gray-level nonuniformity, were significantly greater for sarcomatoid RCC tumors, an aggressive differentiation of RCC associated with a poor prognosis, when compared with non-sarcomatoid ccRCC.
Future Role for Radiomics in Predicting Tumor Biology
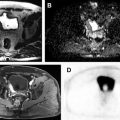
Over the past decade, the incidence of incidentally detected renal masses has increased with the majority of those made up of small renal masses (≤4 cm). Approximately 20% of these masses are benign and many others exhibit an indolent growth pattern. In patients with comorbidities and increased surgical risk, active surveillance may be pursued as a management option. In this setting, the prediction of tumor grade within each specific subtype of RCC would be an essential part in the assessment of renal lesions. Furthermore, a non-invasive method to further assess changes in histopathologic and molecular tumor characteristics on subsequent follow-up imaging that predict a change in oncologic behavior would be of great value in managing these patients. As tumors undergo transformation from a low-grade neoplasm to a high-grade and aggressive tumor, detection of these changes would allow for early intervention, before the tumor acquires the ability to metastasize or invade locally ( Fig. 4 ). This transformation is likely the result of changes in genetic and metabolic alterations, which are difficult to determine in clinical practice owing to the impracticality of performing multiple serial biopsies, so a method to assess for this change noninvasively, such as liquid biopsies or imaging, would radically transform the management of patients undergoing active surveillance.