Key Point
- ▪
With careful technique and adherence to a comprehensive duplex protocol, ultrasound assessment of the renal arteries is feasible.
- ▪
Patient preparation is important.
- ▪
Knowledge of anatomic variants is also important.
Anatomy of the Renal Artery
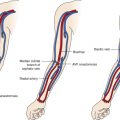
The renal arteries arise from the aorta at approximately the level of the second lumbar vertebra immediately below the superior mesenteric artery, although some variation is known ( Fig. 8-1 ). Major accessory renal arteries are usually fewer than two or three in number. They most commonly arise from the aorta, but smaller arteries can originate from vessels such as the suprarenal artery. Approximately 50% of these accessory arteries extend to the hilum and the other 50% to either the upper or lower poles of the kidney ( Fig. 8-2 ).


Both renal arteries cross the crus of the diaphragm, and as a result, they almost form a right angle with the aorta. The left renal artery extends superior and posterior to the left renal vein and inferior and posterior to the pancreas and splenic vein. The right renal artery is longer than the left renal artery and passes behind the inferior vena cava, right renal vein, head of the pancreas, and descending segment of the duodenum.
Before entering the hilum of the kidney, each renal artery gives off four or five branches that extend to the adrenal gland, ureter, muscle, and neighboring tissue. Closer still to the hilum, the anterior and posterior segmental, or lobar, arteries arise and supply the various segments of the kidney.
The segmental arteries further divide into the interlobar arteries, which run alongside the renal pyramids and then divide again into the arcuate arteries at the corticomedullary junction. The arcuate arteries then divide into the interlobular arteries, which become the afferent glomerular arteries supplying the glomerular body, a capillary tuft that is part of the main filtration system of the kidney.
Renal Artery Stenosis
Renal artery stenosis (RAS) may be caused by atherosclerosis, fibromuscular dysplasia, or aortitis. RAS may be clinically silent, or it may result in hypertension, ischemic nephropathy, or recurrent pulmonary edema. The quest for accurate noninvasive tests to detect RAS evolves, as does the quest for accurate noninvasive tests to predict clinical response to renal artery revascularization. Although percutaneous intervention of stenotic renal arteries is technically successful in a high percentage of cases, the debate continues as to whether atherosclerotic RAS hypertension benefits more from renal revascularization than from antihypertensive medications.
Criteria for the Presence of Renal Artery Stenosis
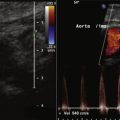
Renal artery duplex findings predict the presence or absence of significant RAS. The peak systolic velocity (PSV) correlates with the severity of angiographic stenosis and the translesional pressure gradient. Stenosis PSV greater than 1.8 to 2.0 at an angle of 45 to 60 degrees or a renal artery PSV–to–aortic PSV ratio of more than 3.5 predicts the presence of significant RAS ( Table 8-1 ).
| PARAMETER | REFERENCE | ANGIOGRAPHIC STANDARD | SENSITIVITY | SPECIFICITY | PPV | NPV |
|---|---|---|---|---|---|---|
| PSV > 200 cm/sec | Staub 5 | >50% | 92% | 81% | ||
| RAR > 2.5 | Staub 5 | >50% | 92% | 79% | ||
| PSV < 200 cm/sec and RAR < 2.5 | >70% | 100% | ||||
| PSV > 219 cm/sec | Kawarada 6 | 89% | 89% | 83% | 93% | |
| PSV ≥ 200 cm/sec | Hua 7 | >60% | 91% | 75% | 60% | 95% |
| RAR ≥ 3.5 | >60% | 72% | 92% | 79% | 88% |
Criteria Purported to Be Predictive of Response to Renal Artery Revascularization
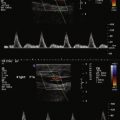
Pulsed-wave Doppler recordings of intrarenal (interlobar) arterial flow are used to calculate the resistance index (RI): the ratio of PSV to end diastolic velocity (EDV). The RI affords some predictiveness of response to revascularization. As stenosis of the renal artery worsens, the early systolic peak diminishes, resulting in a “tardus et parvus” contour. As well, as stenosis worsens, the diastolic velocities increase. The RI is influenced by the severity of the stenosis but also its extent, the distensibility of the vessel, nonrenal/cardiac factors (e.g., tachycardia and aortic valve insufficiency), and the location of Doppler sampling (as the RI decreases from the hilum to the cortex).
Radermacher and colleagues demonstrated that the RI, calculated as (1 − EDV/ESV) × 100 (where ESV is end systolic velocity), of less than 80 was highly predictive of blood pressure response to renal artery angioplasty or stenting, and that the relative risk of worsening of renal function was over 100 times higher with a RI of greater than or equal to 80. However this study did not clearly describe whether the RI was calculated from the stenotic or the contralateral kidney. The stenosis influences the poststenotic RI; therefore, the RI should not be determined on the
- ▪
A bowel “prep” is recommended before performing abdominal (vascular) ultrasound for patients who do not have diabetes:
- ▪
Low-fat meal night before
- ▪
Plenty of clear fluids throughout with medications, if necessary
- ▪
No gum chewing, caffeine, or carbonated beverages
- ▪
Bowl of flavored gelatin the morning of the test (helps abate the appetite and reduces excessive aerophagia)
- ▪
- ▪
Often, the best windows are achieved from lateral decubitus positions:
- ▪
The right kidney is best imaged through the liver.
- ▪
The left kidney is best imaged through the spleen.
- ▪
- ▪
Place the patient in the lateral decubitus position and raise the upper arm over his or her head, to raise the diaphragm and provide better imaging of the upper kidney.
- ▪
It is helpful as well to place the lower extremities in optimal position, with the upper leg crossed over the lower leg and straight, and the lower leg placed behind and bent at the knee (if possible).
- ▪
Choose an approach where possible that is the shortest distance from skin to vessel.
- ▪
Keep the frame rate low by maintaining a narrow color box.
- ▪
Better color enhancement may be achieved with a phased array transducer rather than a curved linear transducer. Grayscale images are generally better with a curved linear transducer.
- ▪
Scan the most important (e.g., renal, if that is the main goal of study) vessels first and with limited breath holding, because continual transducer compression and breath holding can cause excessive gas formation, compromising the latter part of a study.
- ▪
The left renal vein is normally a useful landmark for the ostium/proximal right renal artery because the left renal vein crosses rightward over the abdominal aorta to the left side of the inferior vena cava. Rarely, the left renal vein can run posterior to the aorta.
- ▪
For flow sampling of the renal parenchyma, be sure to sample both the upper and lower poles of the kidney because there might be more than one renal artery supplying each pole.
- ▪
Disease parameter findings (such as the peak systolic velocity and renal-aortic ratio) should yield congruent findings; if they do not, then the basis of the disagreement needs to be resolved. For example, stenosis of the aorta proximal to the renal arteries may confound use of the renal-aortic ratio such that it is inapplicable, whereas the peak systolic velocity is more applicable.
Subsequently, some authors described utility to RI, and others did not. Voiculescu and associates did not establish the utility of contralateral kidney RI greater than or equal to 80 in predicting blood pressure response, although poststenotic RI less than 55 was somewhat predictive of response. Similarly, in a small series of 36 cases, Garcia-Criado and coworkers did not observe predictiveness of blood pressure response or renal function according to RI less than or greater than 80. Among a larger series of (241) patients treated with stenting for RAS (>70%), RI greater than 80 (39 cases) was associated with improvement in blood pressure and renal function.
Limitations of using intrarenal measurements to diagnose renal artery stenosis are:
- □
Inability to distinguish between occlusion and stenosis
- □
Inability to distinguish between renal artery stenosis and other factors that may alter the waveform (e.g., aortic stenosis or coarctation)
- □
Inability to localize site of the lesion
- □
Inability to identify less than 60% stenosis
- □
Insensitivity to lesions in accessory or segmental arteries
Related posts:

Stay updated, free articles. Join our Telegram channel

Full access? Get Clinical Tree


