Key Points
- ▪
Knowledge of normal and variant anatomy of the lower extremity arterial vasculature is critical.
- ▪
A standardized and comprehensive duplex examination protocol is critical.
- ▪
Knowledge of possible diseases/lesions potentially within the lower extremity arterial vasculature, and how to maximize their recognition, is critical.
This chapter is intended to review the ultrasound approach to assessment of arterial occlusive disease distal to the aorta. The arterial vasculature beyond the aorta has greater length than the aorta itself. As the arterial vasculature beyond the aorta involves progressively smaller and smaller vessels, it is more susceptible to occlusive disease than the aorta itself. Aneurysmal disease may occur at several levels in the lower extremity arterial vasculature. Duplex ultrasound of the lower extremity arterial vasculature is generally associated with noninvasive assessment of lower limb blood pressures, and may be associated as well with toe systolic blood pressure and transcutaneous oximetry.
Arterial Anatomy of the Lower Extremities
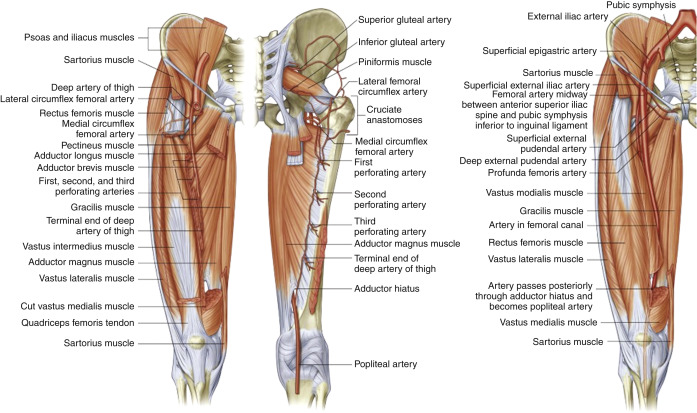
The anatomy of the arterial vasculature ( Figs. 5-1 to 5-3 ) of the lower abdomen, pelvis, and lower extremities is fairly consistent, with the level of branch origin being the most common type of variant. In 80% of cases, the aorta bifurcates within 1.25 cm of the iliac crest.

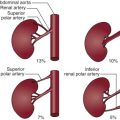
The right and left common iliac arteries are the continuation of the distal abdominal aorta at approximately the level of the fourth lumbar vertebra. The right and left common iliac arteries pass over the psoas muscle, run downward and laterally and themselves divide into internal (hypogastric) and external iliac arteries, the larger of the two branches, at a level between the last lumbar vertebra and the sacrum. The external iliac artery is larger than the internal iliac artery. The right common iliac artery is slightly longer than the left and passes over the fifth lumbar vertebra. There are small branches of the common iliac artery that supply the ureter, the peritoneum, and the psoas major muscle. Occasionally, accessory renal arteries arise from the common iliac artery.
Occlusion of the common iliac artery stimulates collaterals between branches of the abdominal aorta and the inferior mesenteric artery that bridge to the internal iliac artery and are thus one of the reasons that occlusive disease of the common iliac artery may be associated with bowel ischemia. Congenital atresia of one or both of the common iliac arteries is rare.
The external iliac artery has several small branches, which supply the psoas major muscle and lymph glands and two larger branches that arise from its distal segment. The first branch is the deep circumflex artery, which arises from the lateral surface of the external iliac artery and courses toward the anterior superior iliac spine, where it joins with branches of the lateral femoral circumflex artery. This connection is an important collateral source when common iliac artery occlusion extends into the internal iliac artery. The second branch of the external iliac artery is the inferior epigastric branch, which arises medially almost opposite the deep circumflex artery and courses superiorly beneath the rectus abdominis muscle.
In external iliac or common femoral artery occlusion, collateral vessels form between the gluteal branches of the internal iliac artery and the femoral circumflex branches of the profunda femoris artery.
The internal iliac artery, on average 4 cm long and with highly variable branching patterns, arises opposite the lumbosacral articulation and courses downward and medially with branches that supply the buttock, walls and viscera of the pelvis, reproductive organs, and medial side of the thigh.
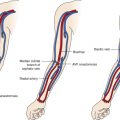
The common femoral artery is a continuation of the external iliac artery. It originates at the inguinal ligament and is part of the femoral sheath, a downward continuation of the fascia lining the abdomen, which also contains the femoral nerve and vein. The common femoral artery extends approximately 3 to 4 cm below the inguinal ligament, where it then bifurcates into the superficial femoral and profunda femoris artery.
The profunda femoris artery, which lies lateral to the superficial femoral artery, gives rise to segmentally occurring circumflex and perforating branches which, when the superficial femoral artery is occluded, connect with the genicular branches of the popliteal artery to reconstitute the distal segment at the level of the adductor hiatus.
- ▪
Even when the Doppler angle of insonation is inappropriate for acquisition of accurate velocity measurements, for example along the mid-external iliac artery where its course is parallel to pelvic floor, a suitably steered color box still reveals a focal narrowing by depicting turbulent flow and thereby gives some indication of the presence of stenosis.
- ▪
If a lower foreleg artery (such as the tibial artery) is subtotally occluded, its ongoing segments may be mistaken for the accompanying vein, as they may be easily comprensible, due to low distending pressure, against shallowly underlying bone.
- ▪
A triphasic nonturbulent waveform at the common femoral level does not necessarily mean that there is no significant stenosis in either the common or external iliac arteries.
- ▪
At the femoral bifurcation, the profunda femoris artery may sometimes run in the usual position of the superficial femoral artery (i.e., more anteriorly for the first few centimeters) and the superficial femoral artery run more posteriorly. Hence, the vessels need to be followed along their length to identify them, and their courses may be atypical and engender confusion as to their identify. In a slim leg, this could result in the impression that the vessel is occluded by the time the mid thigh is reached and the profunda femoris artery had devolved into smaller branches.
- ▪
In a situation where the superficial femoral artery is chronically occluded and its ultrasonographic appearance blends into the surrounding tissues, it is possible to follow the profunda femoris artery until it divides into branches, giving the impression that the vessel is at least patent in the proximal thigh.
- ▪
A saphenous vein bypass graft typically lies closer to the skin surface than does the native vessel and is therefore more likely to be easily compressed by the probe during scanning, falsely suggesting narrowing. Hence when scanning, use very light pressure and lots of gel.
- ▪
Biphasic (increased diastolic) flow rather than the usual triphasic flow can be seen in the periphery of normal arteries when there is vasodilation and hyperemia as a result of infection, for example.
From the femoral bifurcation, the superficial femoral artery continues as the primary conduit between the common femoral and popliteal artery, giving off several small branches along its course and from the mid- to distal thigh, running under the sartorius muscle in the adductor canal along with the femoral vein and branches of the femoral nerve.
In the distal thigh, the superficial femoral artery courses deeply through the adductor hiatus and posteriorly into the popliteal fossa, to become the popliteal artery.
There are three groups of branches of the popliteal artery: (1) the genicular arteries, which form a collateral network around the knee; (2) the paired sural arteries, which arise from the posterior aspect and supply the gastrocnemius and soleal muscle; and (3) the anterior tibial artery, which crosses the upper edge of the interosseous membrane and extends down to the level of the medial malleolus.
The genicular branches connect with tibial branches to form a collateral network and bypass popliteal artery occlusions.
The tibioperoneal trunk extends approximately 2.5 cm from the takeoff of the anterior tibial artery to the bifurcation of posterior tibial and peroneal arteries, with the posterior tibial running distally to a point midway between the medial malleolus and the tip of the heel.
A common variant of anatomy is a small or absent posterior tibial artery, which is frequently diminished in size and absent in approximately 5% of limbs individuals (bilaterally). The peroneal artery is typically larger when the posterior tibial artery is small or absent.
There is generally a dearth of collateral availability and formation in the foreleg. Because there are few branch vessels present in the proximal foreleg to participate as collaterals, occlusion of the popliteal and proximal tibial arteries may result in severe distal ischemia.
The peroneal artery originates from the bifurcation of the tibioperoneal trunk and descends along the medial side of the fibula. The peroneal artery bifurcates behind the lateral malleolus into the lateral calcaneal arteries and may provide large collateral branches to the tibial arteries in the distal calf.
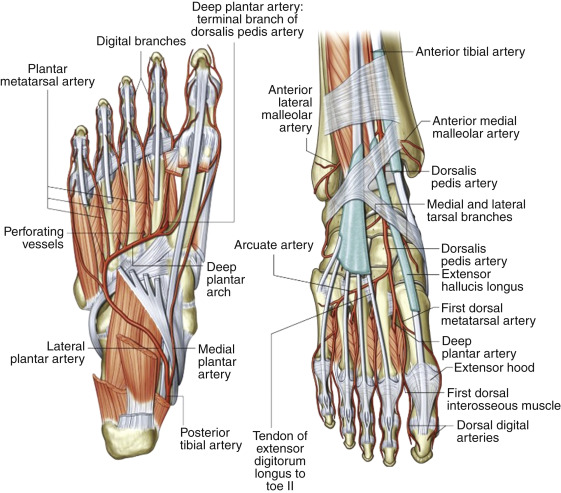
The dorsalis pedis artery is the continuation of the anterior tibial artery and runs lateral to the extensor tendon to the first toe. The line of demarcation of the two is held to be the level of the ankle. The artery is congenitally absent in approximately 4% to 5% of individuals but always bilaterally. In approximately 4% of individuals, the dorsalis pedis artery is a continuation of the perforating branch of the peroneal artery, and the anterior tibial artery does not extend to the ankle level or it is severely diminished in size. This variant artery may be detected by duplex scanning, and unless the anterior tibial artery is mapped, its continuation from the anterior tibial artery may be wrongfully assumed. As with the arteries within the hand, an arcade of vessels provides redundancy and digital branches.
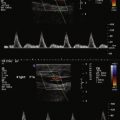
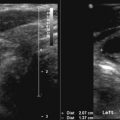
The figures in this chapter represent numerous examples of ultrasound scanning of lower extremity arteries: common femoral artery ( Figs. 5-4 to 5-7 ), superficial femoral artery ( Figs. 5-8 to 5-15 ), profunda femoris artery ( Figs. 5-16 and 5-17 ), common iliac artery ( Figs. 5-18 to 5-28 ), external iliac artery ( Figs. 5-29 to 5-33 ), internal iliac artery ( Fig. 5-34 ), popliteal artery ( Figs. 5-35 to 5-40 ), surgical cases ( Figs. 5-41 to 5-48 ), and trifurcations ( Figs. 5-49 to 5-52 ).