CHAPTER 106 Renal Artery Hypertension
The classic studies by Goldblatt in the 1930s have shown that renal artery stenosis (RAS) is the underlying cause of renovascular hypertension (RVH).1 Although only 5% of cases of hypertension can be attributed to RAS, it is a potentially curable cause of hypertension. In most cases, RVH is caused by atherosclerotic RAS or fibromuscular dysplasia (FMD).2 Atherosclerosis accounts for 70% to 90% of cases of RAS and usually involves the ostium and proximal third of the main renal artery.2,3 Fibromuscular dysplasia (FMD) frequently involves the distal two thirds of the renal artery and its branches. It is most often characterized by aneurysmal dilations interspersed with localized narrowings presenting as a so-called string of beads or string-of-pearls appearance on angiography.4
Intra-arterial digital subtraction angiography (IA-DSA) is traditionally regarded as the definitive test to diagnose the presence of RAS. However, both the invasive nature of IA-DSA and the difficulty in assessing the pathophysiologic significance of stenotic lesions have encouraged the search for widely available noninvasive or minimally invasive diagnostic tests. In addition, IA-DSA is not a perfect test for the detection of RAS because it is subject to substantial interobserver variation.5
PREVALENCE AND EPIDEMIOLOGY
Atherosclerotic Renal Artery Disease
The prevalence of RAS in the general population is low. Among patients diagnosed with hypertension, RAS is present in 1% to 6%.6 On the other hand, atherosclerotic RAS is a common and progressive disease in patients with preexisting manifestations of atherosclerosis or clinical clues suggestive of RAS (see later, “Imaging Indications and Algorithm”). In selected cohorts of patients, such as those undergoing coronary or peripheral angiography, the prevalence of atherosclerotic RAS may increase to more than 20%. Among patients with atherosclerotic RAS, progressive stenosis has been reported in 51% of renal arteries 5 years after diagnosis (including 18% of initially normal vessels). Only 3% to 16% of renal arteries became totally occluded and renal atrophy of more than 60% developed in 21% of patients with RAS.2
Fibromuscular Dysplasia
FMD is responsible for 10% to 30% of cases of RAS.2–4 In one of the largest studies on imaging of RAS, the Dutch Renal Artery Diagnostic Study in Systolic Hypertension (RADISH),7 the prevalence of FMD, as shown by IA-DSA, was 27 of 356 patients (7.6%), all of whom were referred for imaging of the renal arteries because of therapy-resistant hypertension and/or clinical clues suggestive of RAS, including a baseline blood pressure higher than 95 mm Hg. In this study, FMD comprised 38% of all cases of RAS.
ETIOLOGY AND PATHOPHYSIOLOGY
The relationships between renal artery stenosis, hypertension, and renal excretory disfunction are not straightforward but are complex. Renal artery stenosis may occur as an isolated finding or in combination with hypertension, renal insufficiency, or both. The underlying pathophysiologic mechanisms are incompletely elucidated. Current understanding2,8 is that a decrease in renal perfusion pressure activates the renin-angiotensin system, which leads to the release of renin and the production of angiotensin II. This, in turn, has a direct effect on sodium excretion, sympathetic nerve activity, intrarenal prostaglandin concentrations, and nitric oxide production. When all these factors are present, the end result is renovascular hypertension. When hypertension is sustained, plasma renin levels may decrease, partially explaining the limitations of renin measurements for identifying patients with renovascular hypertension; this phenomenon is referred to as reverse tachyphylaxis.
MANIFESTATIONS OF DISEASE
Clinical Presentation
In addition to hypertension, patients may present with ischemic nephropathy. Ischemic nephropathy is defined as an obstruction of renal blood flow that leads to ischemia and excretory dysfunction.9 The pathophysiology of ischemic nephropathy is not fully understood but it is present when the serum creatinine level is elevated because of loss of renal mass as a consequence of long-standing hypertension. In general, loss of more than 50% of renal mass is usually associated with elevated creatinine levels. It is estimated that ischemic nephropathy is present in up to 24% of patients with unexplained chronic or progressive renal failure.
Imaging Indications and Algorithm
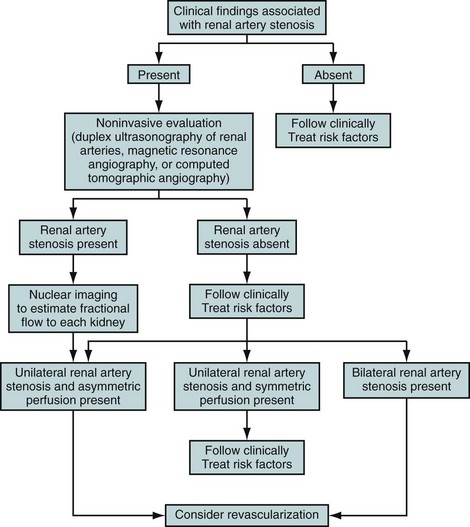
The rational use of noninvasive imaging techniques to detect RAS is important to maximize the diagnostic performance of the test. It is well known in epidemiology that positive and negative predictive values depend on the prevalence of disease. A general rule of thumb is that diagnostic tests perform better when the prevalence of disease is higher. Therefore, clinical clues are used to increase the a priori chances of a patient having RAS (Fig. 106-1). Clinical clues suggestive of RAS include the following: are the presence of diastolic blood pressure of 95 mm Hg or higher; an epigastric, subcostal, or flank bruit; sudden, accelerated, or malignant hypertension; unilateral small kidney; hypertension in children or young adults (prior to age 35) or adults older than 55 years; hypertension and unexplained impairment of renal function; sudden worsening of renal function in a patient with known hypertension; hypertension refractory to three or more appropriate antihypertensive drugs; impairment of renal function in response to angiotensin-converting enzyme inhibitor; and the presence of extensive occlusive disease in the coronary, cerebral, and/or peripheral circulation.3 Using these clinical clues, the prior probability of RAS can be increased to approximately 20% or higher.7,10
Imaging Techniques and Findings
Ultrasound
Ultrasonographic examination of the renal arteries is entirely noninvasive because it does not require injection of contrast medium. In contrast to CE-MRA and MDCTA, however, it does require fasting for 8 hours prior to the examination.11
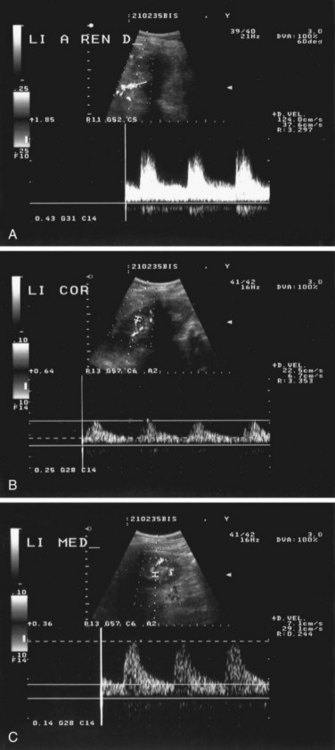
RAS can be detected by color DUS using peak systolic velocity in a stenosis or by poststenotic flow phenomena. Most researchers have used 180 to 200 cm/sec at the point of maximum stenosis as the cutoff point to establish 50% or higher RAS12 (Fig. 106-2). However, because of obesity, excessive bowel gas, or inability of the patient to sustain a breath-hold, about 10% to 20% of the examinations are unsuccessful. In addition, a study by Nchimi and colleagues13 has demonstrated that the accuracy of DUS for the detection of accessory renal arteries is still low. An indirect approach to assessing the severity of RAS is by measuring acceleration in intrarenal arteries distal to a stenosis and the presence of a tardus-parvus waveform. The tardus-parvus phenomenon is used to describe a change in the Doppler blood flow velocity waveform that may be found downstream from significant arterial stenoses. Tardus refers to delayed or prolonged early systolic acceleration (more than 0.07 second14), and parvus refers to diminished amplitude and rounding of the systolic peak.15 By combining direct and indirect measurements, the diagnostic yield may be increased.
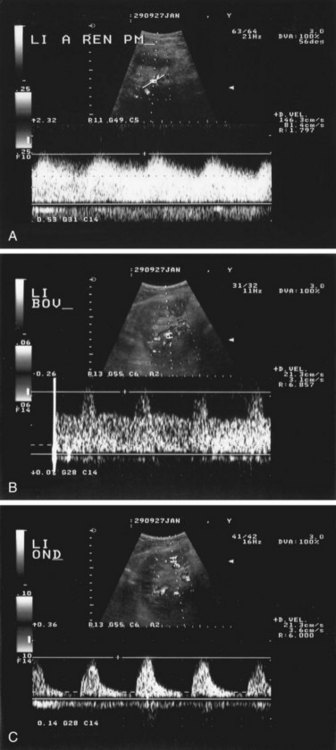
Velocities are measured by obtaining Doppler signals from segmental arteries, typically in the upper, middle, and lower portions of each kidney (Fig. 106-3). When measuring the RI, it is important to keep in mind that pulse rates below 50 or above 70 beats/min, or measuring during inspiration or a Valsalva maneuver, may lead to less accurate measurements. Radermacher and associates16 have shown that in patients with 50% or greater stenosis in at least one renal artery, RI values above 0.80 are highly sensitive and specific to identify patients in whom angioplasty or surgery will not improve renal function, blood pressure, or kidney survival. However, a potential source of bias in this study was that only in patients in which ultrasound detected 50% or greater RAS was therapy considered. In addition, it is not known whether elevated RI values alone are predictive of therapeutic failure. The same group showed that an RI value above 0.80 measured at least 3 months after transplantation is associated with poor subsequent allograft performance and death.17
The diagnostic accuracy of color DUS is moderate to high, depending primarily on the expertise of the vascular laboratory. Reported sensitivities and specificities are generally in the 80% to 90% range. In a meta-analysis comparing different noninvasive diagnostic tests for RAS, the accuracy of ultrasonography for the detection of RAS was shown to be significantly lower than that of CE-MRA and MDCTA.18 A well-known drawback of ultrasonography is the large interobserver variation, although in expert laboratories with dedicated ultrasonographers, this may not be a prohibitive problem.19 Intravenous microbubble contrast agents may improve diagnostic accuracy and success rates.20 DUS may become an interesting alternative to CTA and MRA because of concerns about the effects of administration of iodinated and MR contrast media.
Computed Tomography
Over the past decade,multidetector CT (MDCT) of the vascular system has become firmly integrated into clinical routine. With the recent introduction of MDCT scanners, with which up to 320 slices can be acquired in parallel, CTA has evolved even further. MDCT systems are equipped with two or more parallel detector arrays and always use a synchronously rotating tube and detector array.21,22 To provide sufficient vessel to background contrast, up to 150 mL of 300 mg I/mL or up to 85 mL of 400 mg I/mL nonionic contrast medium is needed. Injection speeds range from 2 to 6 mL/sec. Faster acquisitions require less total contrast medium.23
The need to acquire data during breath-hold and careful, individualized synchronization of contrast injection with acquisition are technical aspects of CTA that are similar to those of CE-MRA (see later, “Magnetic Resonance Imaging”). With the fastest CT scanners, timing of data acquisition becomes even more critical because the imaging time becomes substantially shorter, and the contrast bolus may be missed if mistimed.23
Stay updated, free articles. Join our Telegram channel

Full access? Get Clinical Tree


 FIGURE 106-1
 FIGURE 106-2

 FIGURE 106-3