Renal Transplantation
Renal transplantation is the most desirable treatment for patients with end-stage renal disease; it usually permits homeostasis and a quality of life superior to that achievable by dialysis. Currently, 90% to 95% of transplant recipients survive the first year after surgery, and at least 80% of those transplanted kidneys are functioning at that time. Short-term and long-term survival rates of functioning transplanted kidneys correlate positively with meticulous immunosuppression, rigid human leukocyte antigen (HLA) matching, experience of the transplant team, and ideal recipient age (5 to 50 years). But even in carefully selected and managed patients, only a minority of transplanted kidneys retain useful function longer than 10 years. Patients may receive subsequent grafts after a first one has failed, and duration of function in the first graft is a useful predictor of longevity in the next.
A variety of radiologic procedures are used in the selection of donors and recipients, as well as in the management and detection of posttransplant complications.
▪ PRETRANSPLANT EVALUATION
Living Donor Evaluation
About 20% of transplanted kidneys are obtained from living donors, and most donors are related to the recipients. After appropriate HLA matching is performed, the donor undergoes radiologic evaluation to be sure that the kidney considered for donation does not have a morphologic or vascular abnormality that would contraindicate surgery. The remaining kidney must be sufficiently normal that the donor is not at risk for subsequent renal insufficiency.
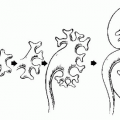
Both computed tomography angiography (CTA; Fig. 12.1) and magnetic resonance angiography (MRA; Fig. 12.2) have proven to be quite accurate in distinguishing whether each kidney has one or two main renal arteries, and in depicting renal venous anatomy (Fig. 12.3). MRA has the disadvantage of low sensitivity for small renal stones and is more likely than CTA to miss tiny polar accessory arteries; currently, CT is more widely used than MR for evaluating prospective donors.
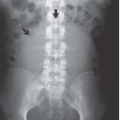
Radiation dose should be minimized for donor CT. KVP may be reduced. Noncontrast views of the kidneys are necessary to find small stones, but postcontrast CT can be limited to one set of scans if a preliminary contrast bolus is given to opacify the collecting systems and, after a larger bolus, scans are timed to reveal both arteries and veins. The scout view from a CT urogram is also useful to depict the renal collecting systems, bladder, and ureter (Fig. 12.4).
Evaluation of the kidneys should include an assessment of renal volume, as this parameter closely predicts renal function. Large kidneys are preferable; donors with large remaining kidneys achieve better renal function than those with small ones; large donated kidneys have fewer complications in recipients; and small transplanted kidneys may have insufficient function to serve a large recipient. Simple cysts and small nonobstructing stones may not absolutely disqualify a donor candidate, but tumors, scars, hydronephrosis, and other conditions can jeopardize the health of donor and/or recipient, and usually prohibit transplantation.
Renal vascular assessment is crucial. Arterial conditions such as atherosclerosis or fibromuscular disease are contraindications to donor nephrectomy. Accessory renal arteries are important to depict (Fig. 12.5). Duplicated renal arteries are not an absolute contraindication, but arterial luminal diameters should be measured because arteries smaller than 3 mm are difficult to anastomose to recipient vessels. Triplicated renal arteries usually preclude donor nephrectomy. Very small polar arteries can usually be sacrificed, but since small lower pole arteries may give branches to the renal pelvis and proximal ureter, postoperative ureteral complications are more likely if these vessels are occluded. The distances between the aortic origin and first bifurcation of all major arteries should be measured; if these segments are short, surgery becomes more difficult.
Renal venous anatomy must also be analyzed. Retroaortic or circumaortic left renal veins are important to recognize, as are duplicated right renal veins. The distances between the veins’ junctions and the inferior vena cava and their first bifurcations should be measured. Finally, renal venous tributaries, such as adrenal, lumbar, and gonadal veins, should be described.
Recipient Evaluation
Radiologic evaluation of the urinary tract in the recipient does not follow a routine path. Virtually all recipients have their kidneys imaged in the course of treatment for renal failure; the combination of ultrasound, CT, and radionuclide studies the patients undergo depends on the specific renal disease. Sometimes specific imaging of the recipient’s native kidneys will be necessary during the pretransplant workup. Evaluation for acquired renal cystic disease and the neoplasms that such kidneys sometimes develop is best performed by CT. CT may be used to evaluate kidneys in patients with autosomal-dominant polycystic kidney disease if
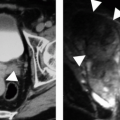
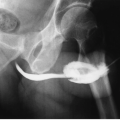
extreme enlargement or persistent bleeding makes them candidates for nephrectomy. Patients with severe vesicoureteral reflux may require surgical therapy, so voiding cystourethrography may be necessary in patients with recurrent urinary tract infections. Voiding cystourethrography may also be indicated in patients who have been anuric so long that their ability to void normally in the posttransplant period is questioned. Bladders in such patients may have only a small capacity and, when studied by cystography, may demonstrate benign extravasation (Fig. 12.6). This finding does not indicate gross perforation of the bladder, and is not a contraindication to transplantation.
extreme enlargement or persistent bleeding makes them candidates for nephrectomy. Patients with severe vesicoureteral reflux may require surgical therapy, so voiding cystourethrography may be necessary in patients with recurrent urinary tract infections. Voiding cystourethrography may also be indicated in patients who have been anuric so long that their ability to void normally in the posttransplant period is questioned. Bladders in such patients may have only a small capacity and, when studied by cystography, may demonstrate benign extravasation (Fig. 12.6). This finding does not indicate gross perforation of the bladder, and is not a contraindication to transplantation.
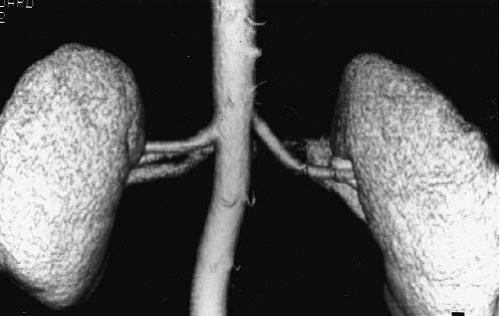 FIGURE 12.1. CTA. Single renal arteries are seen on this volume-rendered image. Portions of the renal veins are also visible. |
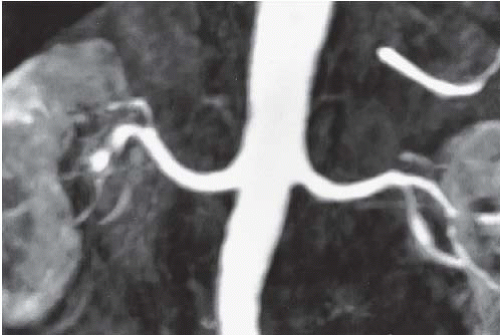 FIGURE 12.2. MRA. Single renal arteries are seen on this T1-weighted three-dimensional spoiled gradient echo image. |
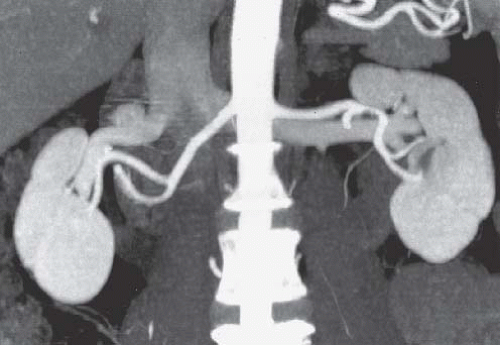 FIGURE 12.3. CT angiogram reveals a single artery and vein supplying each kidney. |
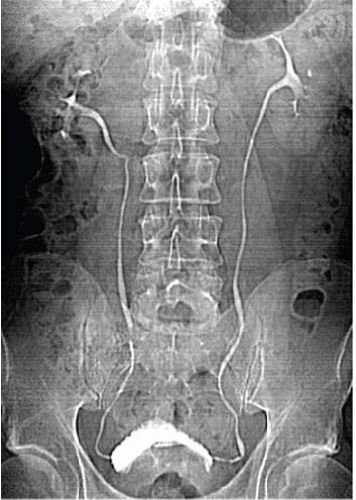 FIGURE 12.4. CT urography. A scout view demonstrates single ureter bilaterally. The prostate is enlarged, there is a TURP defect, and the bladder is trabeculated. |
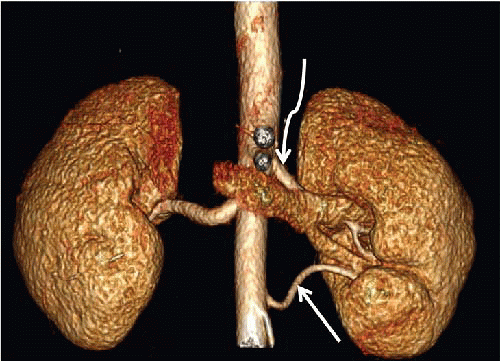 FIGURE 12.5. Accessory renal artery. Volume-rendered image from CTA demonstrates two left renal arteries (arrows). |
Evaluation of the vessels to which the transplanted kidney’s artery and vein will be anastomosed is important. Noncontrast CT permits assessment of degree of recipient vascular calcification; severity of calcification is directly proportional to difficulty in performing the anastomosis. Some centers perform CTA of the common and external iliac arteries as well to evaluate them for stenosis or occlusion.
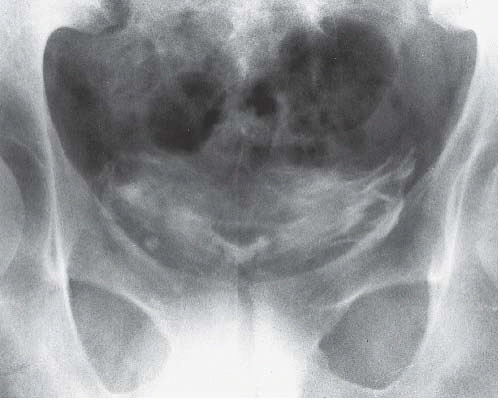 FIGURE 12.6. A postvoid film from a voiding cystourethrogram in a patient with an unused bladder demonstrates benign extraperitoneal extravasation. |
▪ COMPLICATIONS OF RENAL TRANSPLANTATION
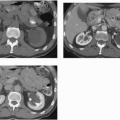
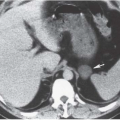
In case of posttransplant renal dysfunction, or as a routine evaluation, ultrasound is usually the initial imaging modality employed. Posttransplant imaging of the recipient (Fig. 12.7) may show no abnormalities.
Complications of renal transplantation may be divided into those that affect the renal parenchyma and its small vessels, those that involve primarily the large vessels and their surgery, those that involve the transplanted ureter and its anastomosis, and those that appear as fluid collections in the surgical bed of the recipient. Longterm complications of renal transplantation consist primarily of neoplasms for which recipients are at increased risk.
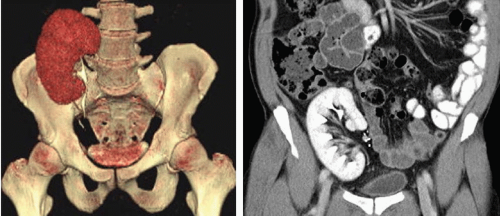 FIGURE 12.7. CT urography of two patients with kidneys transplanted into their right iliac fossae. Right: Coronal reformat. Left: Volume-rendered image. |
Renal Complications
Table 12.1 reveals the times during or after transplantation that these complications are most likely to appear. These times, and some of the clinical and radiologic data that can be acquired, frequently permit a confident diagnosis of the specific complication. However, it is often difficult to establish a specific diagnosis without biopsy of the renal cortex for histologic examination.
Acute Tubular Necrosis
Acute tubular necrosis (ATN) usually occurs in the immediate post-transplant period, and is related to ischemia of the transplanted kidney before vascular anastomosis. Such ischemia may occur in cadaveric donors during the agonal period of the donor and in any donor during the delay between the harvesting of the kidney and the completion of vascular anastomoses in the recipient. The duration of the ischemia is directly related to the likelihood of ATN. Most episodes of ATN resolve spontaneously and appear to have little adverse effect on ultimate graft survival.
ATN may be manifested as anuria, rising creatinine, and mild enlargement and tenderness of the graft. Graft tenderness and fever are less likely to be prominent signs of ATN than of cases of acute rejection, but the clinical picture seldom allows confident differentiation between the two conditions. ATN usually appears within 1 or 2 days after transplantation, and usually resolves within a few days to a few weeks of initial onset; however, some cases may persist for several weeks before recovery.
TABLE 12.1 Temporal Sequence of Causes of Parenchymal Complications of Renal Transplants | ||||||||||||
|---|---|---|---|---|---|---|---|---|---|---|---|---|
|
Cyclosporine Nephrotoxicity
Cyclosporine, together with prednisone, has been the mainstay of immunosuppressive therapy. It is, however, both nephrotoxic and hepatotoxic. Newer drugs, including sirolimus, tacrolimus, and mycophenolate mofetil, permit reduction in doses of cyclosporine and diminished nephrotoxicity, albeit at the cost of increased risk of hyperlipidemia and diabetes. Cyclosporine nephrotoxicity may be acute, subacute, or chronic. Both acute and subacute nephrotoxicity may be treated by lowering the dose of cyclosporine; chronic nephrotoxicity is seldom reversible. Acute toxicity appears to potentiate initial graft dysfunction related to ischemia and may also prolong it. Because measurement of blood cyclosporine levels does not always permit distinction of cyclosporine nephrotoxicity from other causes of transplant dysfunction, imaging data may be critical in the differential diagnosis of a failing transplant.
Rejection
Graft rejection continues to represent a significant source of morbidity in the transplant patient. Rejection is currently classified into four categories: (1) hyperacute rejection, (2) accelerated acute rejection, (3) acute rejection, and (4) chronic rejection. Virtually every patient experiences some form of rejection in the posttransplant period. Differentiation of graft rejection from other causes of intrinsic renal dysfunction is crucial because rejection may require increasing the dose of immunosuppressive therapy, whereas cyclosporine nephrotoxicity should be treated in the opposite way.
Hyperacute rejection is mediated by hormonal antibodies and is often manifested during surgery; the antigen-antibody reaction causes complement activation, which in turn damages the vascular endothelium, particularly in small vessels. These vessels become filled with fibrin thrombi, thereby making extensive cortical necrosis inevitable. A graft exhibiting hyperacute rejection is seldom salvageable, and transplant nephrectomy is performed immediately.
Some authors believe that accelerated acute rejection is an antibody-mediated form of rejection identical to hyperacute rejection, but with an onset delayed until 2 or 3 days after surgery. Others believe it is a manifestation of cell-mediated immunity. Diagnosis of an accelerated acute rejection usually occurs when a rejection episode occurs in the first week of transplantation. It is frequently, but not always, successfully treated with immunosuppression.
Acute rejection constitutes functional and pathologic changes characterized by a relatively rapid increase in serum creatinine (a rise of 25% or more above the baseline level occurring within 24 to 48 hours), graft swelling and tenderness, and fever. There is usually oliguria. Acute rejection is thought to occur because of a proliferation of C-lymphocytes and to represent a cell-mediated form of immunity. Histologically, acute rejection is characterized by a proliferation of mononuclear cells, eosinophils, and plasma cells that infiltrate the interstitium of the kidney. A vascular component may also be present. Biopsy specimens in acute rejection sometimes are classified as showing primarily interstitial rejection or both interstitial and vascular abnormalities. A vascular component connotes a poorer prognosis. Acute rejection may occur at any time after transplantation, but is most often encountered during the first 10 weeks after surgery.
Chronic rejection may appear months to years after surgery and usually has a more insidious onset than acute rejection. Graft swelling and tenderness, and fever are less prominent features of chronic than acute rejection. Pathologic examination may reveal endothelial swelling, smooth muscle proliferation in small vessels, and glomerular changes, as well as tubular atrophy, segmental fibrosis, and diffuse infiltration with inflammatory cells. In general, the changes of chronic rejection are irreversible and lead to progressive azotemia and hypertension. Chronic allograft nephropathy is often due to a combination of chronic rejection, antirejection drug nephrotoxicity, and a vasculopathy due to more protean risk factors such as hypertension, hyperlipidemia, diabetes, and smoking. Decline in renal function may be slowed by careful management of drugs, but is rarely, if ever, halted completely.
Imaging
Imaging of patients with functional abnormalities of transplanted kidneys is a critical step in the differential diagnosis of the cause of the transplant dysfunction, but imaging findings, considered alone, do not always allow an accurate and specific diagnosis. Sometimes the abnormality is clear, but frequently the clinical or laboratory data must be considered along with the radiologic findings to reach a firm diagnosis. Although scintigraphic and Doppler ultrasound findings have been the subjects of considerable investigation, findings that permit accurate distinction among rejection, cyclosporine nephrotoxicity, and ATN in the absence of clinical information have been elusive, and biopsy is frequently necessary. Scintigraphy provides quantifiable assessment of the transplant’s handling of specific compounds, but the ability of gray-scale, Doppler and color Doppler ultrasound to evaluate vessels, flow dynamics, anatomy, and peritransplant structures has led to its usual choice as the first imaging technique.
Hyperacute rejection infrequently leads to an imaging evaluation because it usually occurs in the operating room. Because renal cortical perfusion is markedly diminished or completely absent, Doppler ultrasound will reveal little or no cortical blood flow, radionuclide examinations will show almost complete absence of perfusion or tubular accumulation (Fig. 12.8), and angiography will reveal total or near-total lack of filling of small vessels.
Accelerated acute rejection demonstrates imaging findings consistent with acute rejection, but occurs within the first week after transplantation. Rare cases of cortical nephrocalcinosis (Fig. 12.9) have been described in patients whose transplants underwent severe immediate rejection but were left in situ for several years.
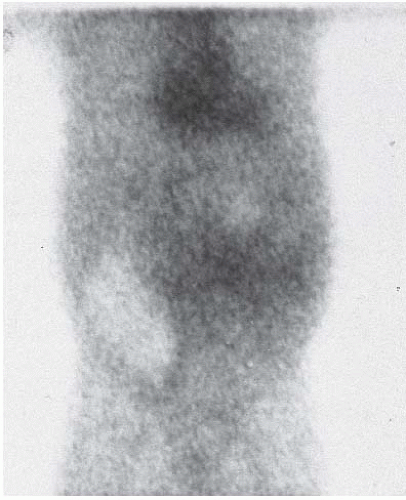 FIGURE 12.8. Hyperacute rejection. Scintigram obtained a day after transplantation shows nearly complete absence of activity in transplanted kidney. (Courtesy of Rashid Fawwaz, M.D.) |
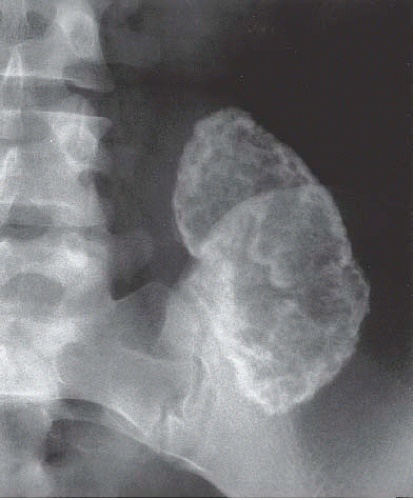 FIGURE 12.9. Cortical nephrocalcinosis from acute severe rejection. |
Gray-scale images (Fig. 12.10) of patients with acute transplant rejection may show an increase in the volume of the kidney, swelling, and altered echogenicity of the renal pyramids and the cortex. The high echogenicity of the sinus of a normal kidney may be diminished. These findings are thought to reflect edema of the parenchyma and of the renal sinus fat. Edema of the collecting system walls may make them appear thickened. The sensitivity of these findings to diagnose rejection, however, and the ability to distinguish rejection from cyclosporine nephrotoxicity and ATN when the findings are not clearly present, is poor.
There is diminution of total renal blood flow in rejection, cyclosporine nephrotoxicity, and ATN. Although there are variations in the severity of oligemia among cases of each condition, attempts have been made to use Doppler flow studies to distinguish acute rejection from ATN and cyclosporine nephrotoxicity by analyzing signals from the main renal artery and from intrarenal branches. In patients with acute rejection—especially those in whom vascular changes predominate in biopsy specimens, as opposed to those in whom the histologic changes are primarily interstitial—the resistive index (RI) is often elevated (Fig. 12.10). When the RI is 0.90 or higher, acute rejection is likely, although occasionally elevated RIs may be caused by arterial stenosis, renal vein thrombosis, acute severe ureteral obstruction, severe ATN, acute cyclosporine nephrotoxicity, pyelonephritis, and compression of the kidney by a perirenal fluid collection. With lower RIs, primarily interstitial acute rejection, cyclosporine nephrotoxicity, and ATN are possible etiologies. Because rejection and ATN may not affect the entire kidney uniformly and because resistive indices may vary from observer to observer, the accuracy of this method of differential diagnosis is far from ideal and many authors feel that RI measurements are not very useful. In some centers, the pulsatility index (PI) ([peak systolic frequency shift-diastolic frequency shift]/the mean frequency shift) is used as an alternative to measurement of the RI. A PI of 1.5 or greater is generally considered indicative of rejection. In patients with ATN, higher RI and PI values are associated with longer periods of recovery of function. Power Doppler findings have not improved upon the differentiation between acute rejection and other causes of graft failure.
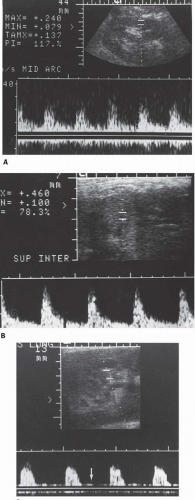 FIGURE 12.10. Duplex Doppler ultrasonograms. A: Normal duplex study with a PI of 1.17. B: Mild rejection; RI = 0.78, PI = 1.7. C: Severe rejection with virtually complete absence of diastolic flow (arrow). |
RI and PI values may have prognostic significance as well. If they remain elevated in the first transplant month, even in patients with stable renal function, the kidneys are at increased risk to develop chronic allograft nephropathy, and the risk is worse if there are progressive rises in these indices. An elevated RI in the graft vessels also indicates an increased risk for the subsequent development or worsening of general cardiovascular disease, possibly because this parameter not only reflects abnormal vessels in the graft but also indicates decreased compliance of the systemic arteries in the rest of the body.
Although experimental evidence shows that renal blood flow is lower than normal in cases of ATN, Doppler and radionuclide examinations do not always suggest ischemia. The early phase in a technetium-99m diethylenetriaminepentaacetic acid (99mTc-DTPA) renogram (the “perfusion” phase) is relatively well maintained (Fig. 12.11), even though the later phases and the technetium-99m-mercaptoacetyltriglycine (99mTc-MAG3) curves fail to show rapid parenchymal washout and even show persistent accumulation of the isotope. Sonography, including Doppler, may be normal, or the RI may be increased (Fig. 12.10).
Like Doppler ultrasound, scintigraphy interpreted in the absence of other data frequently cannot distinguish specifically and accurately the several causes of renal parenchymal dysfunction in transplant patients, but it may be of value when considered with all available information. In acute rejection associated primarily with vascular changes (Fig. 12.12), the rapid increase in activity seen normally is attenuated; the maximum intensity of activity seen in early images is diminished, and the delay between the time of peak activity in the aorta and peak activity in the kidney is prolonged. These findings may also occur in rejection that is primarily of the cellular type, as well as in ATN and cyclosporine nephrotoxicity, but are less severe in those conditions. The findings may precede clinical evidence of rejection. All parenchymal causes of graft dysfunction exhibit deteriorating tubular function manifested by diminished activity in later parts of the examination. Once established, ATN and acute rejection may produce scintigraphic findings that are difficult to distinguish. But if the first scans after the operation are abnormal, ATN is likely to be present, whereas if the scans were initially normal, but subsequently became abnormal, acute rejection is more likely to be the diagnosis. ATN followed by acute rejection is difficult to distinguish from ATN without recovery, although the usual course of ATN is a spontaneous return toward normal within 1 or 2 weeks of onset. Severe diminution of activity in the kidney, or complete failure of the kidney to accumulate isotope, is a poor prognostic sign.
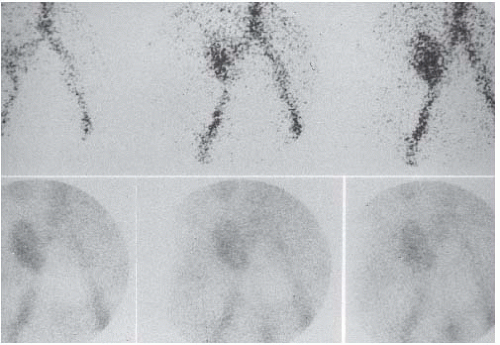 FIGURE 12.11. ATN. The top row of dynamic images shows rapid early uptake (the “perfusion” phase). The lower row of images, obtained 1, 10, and 20 minutes after administration of isotope, reveals persistence of activity and little excretion into the bladder. (Courtesy of Rashid Fawwaz, M.D.)
Related posts:Stay updated, free articles. Join our Telegram channel
Full access? Get Clinical Tree
 Get Clinical Tree app for offline access

|