Because any cell type found in the kidney or renal capsule has the potential to become neoplastic, there are many types of renal tumors. Unfortunately, few of these tumors have a radiographic appearance sufficiently characteristic to make a confident diagnosis. Modern imaging techniques, nonetheless, play a major role in the diagnosis, staging, and management of these lesions.
▪ RENAL PARENCHYMAL TUMORS
Renal Cell Carcinoma
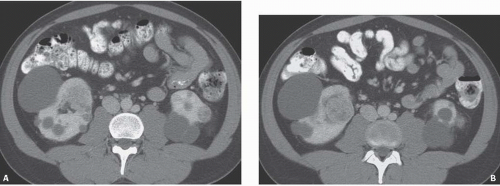
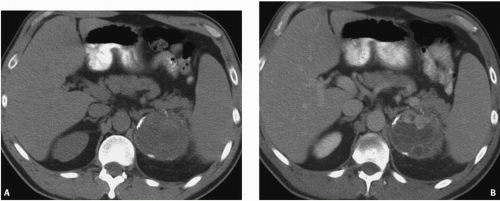
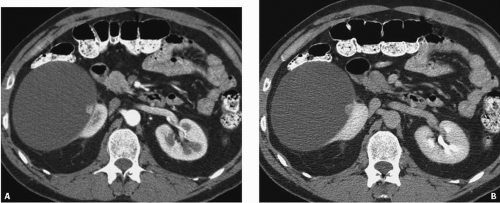
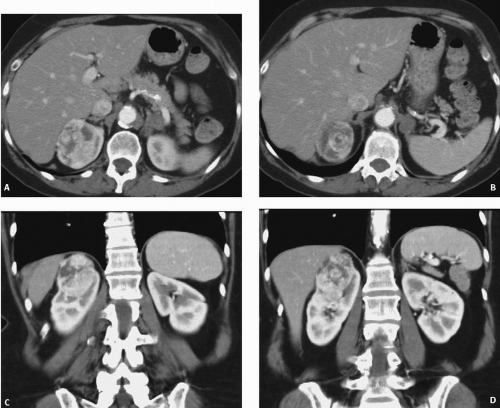
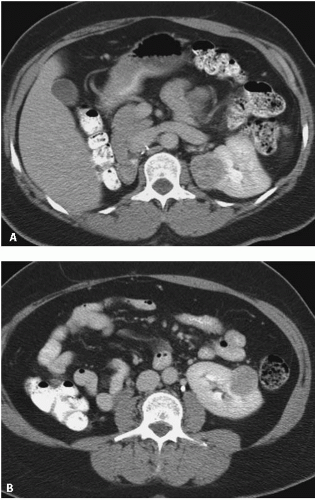
Renal cell carcinoma (RCC) is twice as common in men than in women. The tumor may occur at any age, but the incidence peaks in the sixth decade. No specific etiologic agents are recognized, but there is an increased incidence in patients who use tobacco, which increases the incidence of the disease by as much as 50%, and who have obesity and uncontrolled hypertension. The incidence of RCC has been increasing worldwide, partly owing to the more frequent detection by imaging, but also to an increase in the prevalence of risk factors. There is also a 4-fold increase in the incidence of the disease in first-degree family members of patients with RCCs. Patients with von Hippel-Lindau (VHL) disease (Fig. 8.1) often develop renal carcinomas that are smaller but frequently multiple and bilateral. There is also a familial RCC (hereditary papillary RCC) unrelated to VHL.
Patients on chronic hemodialysis or peritoneal dialysis develop acquired renal cystic disease (see Chapter 7). These patients have an incidence of renal carcinoma of approximately 7%, although not all of these tumors behave in a biologically aggressive manner. These tumors begin to appear in patients as early as 3 years after initiation of dialysis but are difficult to detect because these patients’ kidneys are not functioning and usually contain multiple cysts and dystrophic calcifications. The incidence of renal tumors seems to parallel the development of acquired cystic disease, such that more tumors are seen the longer the patients are maintained on dialysis. The effect of renal transplantation on the development of renal cancer is unclear. Although it is likely that successful transplantation reduces the risk of renal carcinoma, this is counterbalanced by the increased risk of malignancy with immunosuppression.
The classic clinical presentation of a flank mass, pain, and hematuria occurs in only a minority of patients. As abdominal computed tomography (CT) and ultrasound examinations are commonly performed for a variety of nonrenal indications, the vast majority of renal tumors are now discovered incidentally when they are completely asymptomatic.
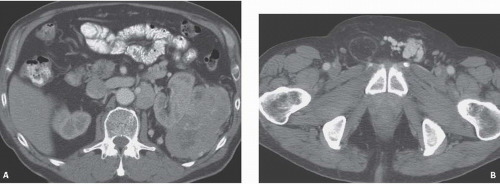
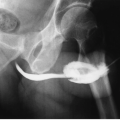
Patients with large tumors may first complain of nonspecific symptoms such as weight loss, fatigue, or even gastrointestinal or neurologic symptoms. Less common presenting complaints include fever or a new left-sided varicocele (Fig. 8.2). Fatigue may be caused by a normochromic normocytic anemia. Such nonspecific symptoms may be referred to as a paraneoplastic syndrome. A variety of hormones may be secreted by RCCs in sufficient quantity to cause distinct clinical manifestations (Table 8.1). These hormones include renin, erythropoietin, parathormone, adrenocorticotropic hormone, prolactin, and gonadotropin. Thus, renal adenocarcinoma has sometimes been called the internist’s tumor.
Among symptomatic patients, hematuria is the most common sign, occurring in more than 50% of patients. Flank pain, present in more than one-third of patients, is probably caused by distension of the renal capsule. A flank mass is palpable at presentation in approximately one-third of patients with large tumors.
It is difficult to predict the natural history of renal adenocarcinoma. Some tumors demonstrate aggressive behavior by growing rapidly and metastasizing early. However, occasionally patients may live for years with an untreated primary tumor. Small tumors, in particular, may show only minimal growth when followed over many years. Metastases generally occur when tumors are larger than 5 cm and only rarely when the tumors are less than 3 cm in diameter. Metastases may be present at the time of initial presentation, but have also been reported as late as 31 years after nephrectomy. Spontaneous regression of metastases or the primary tumor may also occur.
FIGURE 8.1. VHL disease. A, B: CT images of the kidney in a patient with von Hippel-Lindau showing bilateral renal cysts and solid tumors (arrows).
FIGURE 8.2. RCC. A patient with a large left renal tumor (A) presented with a varicocele of the left testes (B).
TABLE 8.1 Endocrine Manifestations of Renal Adenocarcinoma
Hormone
Manifestation
Renin
Hypertension
Erythropoietin
Erythrocytosis
Parathormone
Hypercalcemia
Prolactin
Galactorrhea
Gonadotropin
Gynecomastia
ACTH
Cushing syndrome
Classification
It is now understood that renal cortical neoplasms are a family of differing neoplasms with distinct cytogenetic and molecular defects and differing prognoses and potential morbidities. In 1997, the Heidelberg Classification of RCC, which subdivided these tumors into distinct entities based on histologic, immunohistochemical, and genetic differences, was adopted by the World Health Organization (WHO) (Table 8.2). The WHO classification is as follows: (1) conventional or clear cell RCCs (65% of cases); (2) papillary RCCs (15%), which have a 90% 5-year survival when they occur sporadically; (3) chromophobe RCCs (5%), which have the best overall prognosis; (4) collecting duct carcinomas (1%), which are highly malignant and have a very poor prognosis; (5) renal oncocytomas (5%), which are benign but sometimes difficult to distinguish from chromophobe tumors except by immunohistochemical studies; and (6) unclassified tumors (5%).
Clear cell RCCs are the most common. Defects in the VHL suppressor gene are responsible for 60% of the sporadic cases of clear cell carcinoma, even in patients without the full-blown syndrome. VHL protein, the product of this gene, is a potent tumor suppressor. Its absence in turn leads to production of several proteins involved in tumor angiogenesis, including hypoxia inducing factor (HIF-α) and vascular endothelial growth factor. The most consistent abnormality is a deletion of the short arm of chromosome 3. Histologically, conventional RCC has abundant clear cytoplasm with a predominant alveolar architecture. The Fuhrman nuclear grading system is often used to additionally characterize the lesion and has been shown to have an excellent correlation with staging and survival. The system ranges from grade 1 (small uniform nuclei) to grade 4 (severe nuclear anaplasia). There is a separate category of spindle-shaped cells with ominous prognostic significance seen in all histologic subtypes referred to as a sarcomatoid variant. Sarcomatoid RCCs contain elements of renal adenocarcinoma, transitional cell carcinoma, and sarcoma. They occur more frequently in elderly patients, but are radiologically indistinguishable from renal adenocarcinoma.
TABLE 8.2 Classification of RCC
Type
Cell of Origin
Prognosis
Conventional
Proximal convuluted tubule
Depends on nuclear (Fuhrman) grade
Grade I (10%)—67% 5-year survival
Grade II (35%)—56% 5-year survival
Grade III (35%)—33% 5-year survival
Grade IV (20%)—8% 5-year survival
Papillary
Proximal convoluted tubule
Type I good
Type II poorer than type I
Chromophobe
Collecting duct
Best
Collecting duct
Medullary collecting duct
Poor
Oncocytoma
Collecting duct
Benign
Papillary tumors are characterized by abnormalities of chromosomes 7 and 17 and loss of chromosome Y. They typically have a papillary growth pattern and exhibit a frondlike appearance with a central fibrovascular core on histologic examination. There is a 5:1 male predominance.
Hereditary papillary renal carcinoma is an autosomal dominant form of the disease associated with multifocal papillary RCC. These tumors metastasize less frequently than do clear cell tumors; however, metastases, when they occur, may be more aggressive. A recent study has suggested that there is a significant decrease in cancer-specific survival when metastatic disease is present in patients with papillary RCC compared with those with conventional tumors, whereas the outcome in nonmetastatic papillary tumors is generally more favorable. Papillary renal cell tumors have been subdivided into type I, which are generally sporadic with a favorable outcome and type II, which are more likely inherited, multiple, and often with a higher Fuhrman grade and poorer prognosis.
Chromophobe RCCs and oncocytomas both arise from the medullary collecting duct; chromophobe tumors generally show a more favorable course than do conventional RCCs. Histologically, they are characterized by the presence of large polygonal cells. The Birt-Hogg-Dube syndrome is a form of inherited RCC also characterized by hair follicle hamartomas and frequent pneumotosis from rupture of thin-walled lung cysts. Patients with this syndrome often have chromophobe tumors or mixed chromophobe tumors and oncocytomas.
Oncocytomas are benign tumors that have a male predilection and a mean age of presentation in the seventh decade. They comprise approximately 5% of renal tumors. Oncocytomas most often are detected as an incidental finding. Occasionally, patients may complain of a flank mass, pain, or hematuria.
The gross appearance of an oncocytoma is a well-defined tan to brown tumor. Oncocytomas are homogeneous and do not show necrosis or hemorrhage, but often contain a prominent central stellate scar. In contrast, renal carcinomas are orange-yellow and often have areas of hemorrhage and tumor necrosis.
Although there are occasional reported cases of involvement of regional lymph nodes and tumor extension into the renal vein, the vast majority of oncocytomas are well differentiated and benign.
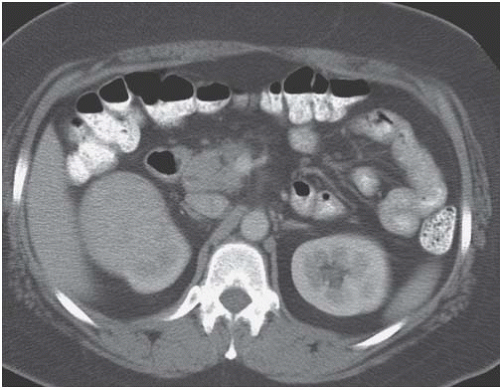
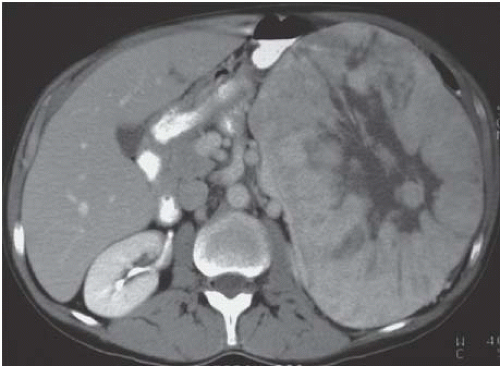
On CT, an oncocytoma is well defined with a relatively sharp interface with the normal renal parenchyma (Fig. 8.3). The central stellate scar (Fig. 8.4) is best seen with CT but is not pathognomonic for an oncocytoma because it can be seen in renal adenocarcinoma.
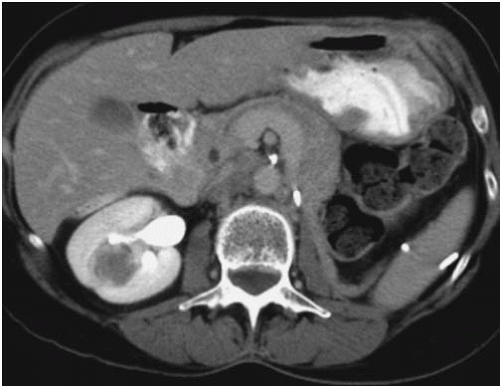
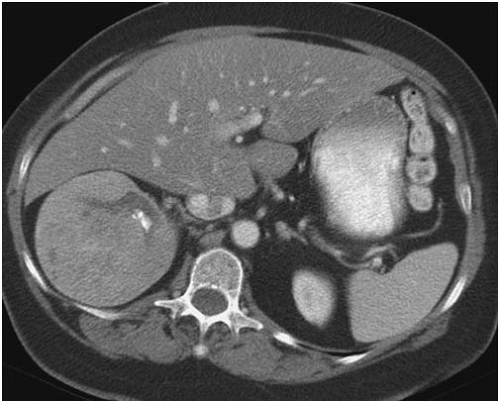
FIGURE 8.3. Oncocytoma. An image from a CT scan demonstrating a relatively homogeneous appearing right renal mass that was found to be an oncocytoma.
FIGURE 8.4. Oncocytoma. A large left renal mass with a prominent central scar.
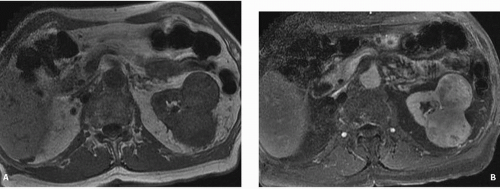
FIGURE 8.5. Oncocytoma on MR. A: Pre- and (B) postcontrast axial T1-weighted image show two left heterogeneous enhancing renal masses.
Magnetic resonance imaging (MRI) reveals a low-signal-intensity mass on T1-weighted images, which differs from the intermediate to high signal intensity often seen in RCCs. On T2-weighted images, oncocytomas show a high signal intensity (Fig. 8.5).
Angiography, which is no longer routinely performed, demonstrates a vascular renal tumor with a dense tumor blush. A “spoke wheel” pattern of vessels penetrating into the center of the tumor is felt to be characteristic. Although this vascular configuration is often described in an oncocytoma, it is not pathognomonic because it can also be seen in renal adenocarcinoma.
Because an oncocytoma cannot be reliably diagnosed radiographically, treatment is surgical. If typical radiographic features of an oncocytoma, such as a central stellate scar and a spoke wheel vascular pattern are present, an oncocytoma may be suggested. However, neither appearance is pathognomonic, and surgery is required.
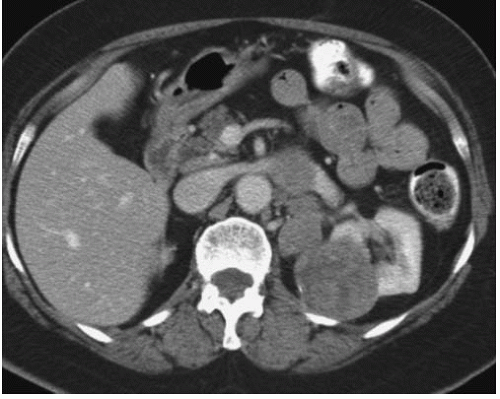
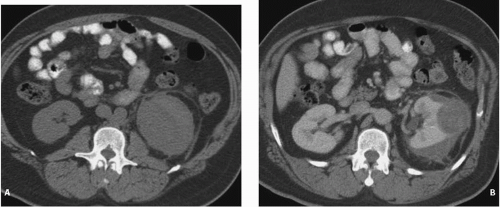
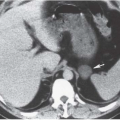
Collecting duct carcinoma, which accounts for less than 1% of all RCCs, is typically an aggressive tumor often occurring in younger patients and has a poor prognosis. In 1995, Davis et al. reported a previously unrecognized renal neoplasm in young black patients with sickle cell trait. The dominant tumor mass was in the medulla, with satellite lesions in the cortex. Venous and lymphatic invasion was usually present. This tumor is now recognized as a variant of collecting duct carcinoma and is known as renal medullarycarcinoma.
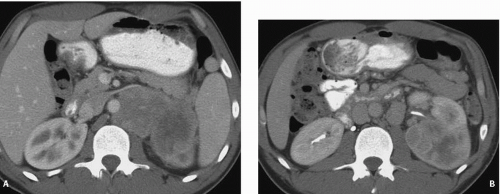
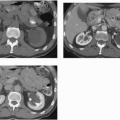
FIGURE 8.6. Renal medullary cancer. A, B: CT of the abdomen shows a poorly marginated left renal mass with extensive retroperitoneal adenopathy in a young patient with sickle cell trait.
The patients ranged from 11 to 39 years of age, and there was a male preponderance, especially among the younger patients. Although almost all patients had sickle cell trait, none had sickle cell disease. One case of renal medullary carcinoma has now been reported in a white adolescent without sickle cell trait.
The tumor arises from the calyceal epithelium, is centrally located, grows in an infiltrative pattern, and is usually very large at presentation (Fig. 8.6). The renal sinus is typically invaded, and caliectasis without pelviectasis often is present. The contrast enhancement and echotexture are heterogeneous.
Renal medullary carcinoma is an extremely aggressive tumor. Metastases, especially to regional lymph nodes, are present in most patients at presentation. Treatment is surgical resection, but the mean survival after surgery among the 33 cases reported by Davis et al. was only 15 weeks. All reported cases have been fatal.
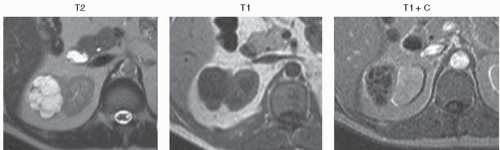
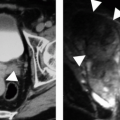
FIGURE 8.7. Multilocular cystic clear cell carcinoma. MR images demonstrate a multicystic mass with enhancing septa.
Other less common varieties of RCC include Xp 11 translocation carcinomas and multilocular cystic clear cell carcinoma (Fig. 8.7), which is very low grade and has not been reported to metastasize.
Staging
The two most commonly used staging systems are the classic system described by Robson et al. in 1969 and the TNM system described by the American Joint Committee for Cancer Staging (Table 8.3). The Robson classification is simpler, has been in use longer, but has fallen out of favor as it does not reflect the patient’s prognosis as accurately as does the TNM system. For example, it is well established that tumor size correlates significantly with the presence or absence of metastasis; yet size is not considered in the Robson criteria. Involvement of the renal vein and regional lymph nodes are both considered as stage III disease by Robson criteria; in fact, simple tumor thrombus in the renal vein does not significantly alter the prognosis from stage II patients. Involvement of regional nodes, however, often portends a less favorable outcome.
The TNM system was most recently revised in 2010. This system has been found to correlate more closely with patient outcomes and more accurately allows comparison of data across different institutions. Patients with stage I disease have a 5-year survival of 95%; stage II, 88%; stage III, 59%; and stage IV, 20%.
Imaging
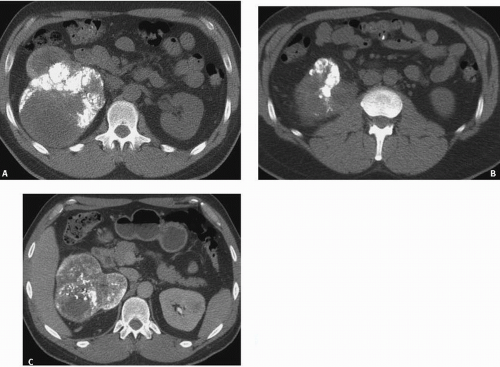
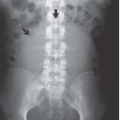
Calcification, which can be detected on an abdominal radiograph in as many as 20% of renal adenocarcinomas (Fig. 8.8), is even easier to detect on an unenhanced CT examination. However, calcification may also be seen in other renal masses, including common lesions such as benign cysts.
The character of the calcification is helpful in determining the etiology of a renal mass. Thin peripheral curvilinear calcification is more commonly seen in a cyst, whereas central or thick mural calcification means the lesion is more likely a renal carcinoma (Fig. 8.9). However, the importance of calcification has decreased because CT, ultrasound, and magnetic resonance (MR) can be used to more clearly define the nature of a renal mass. Any of these cross-sectional imaging modalities can directly detect a soft tissue mass or tumor nodule within a cystic mass without relying on the presence of a central calcification.
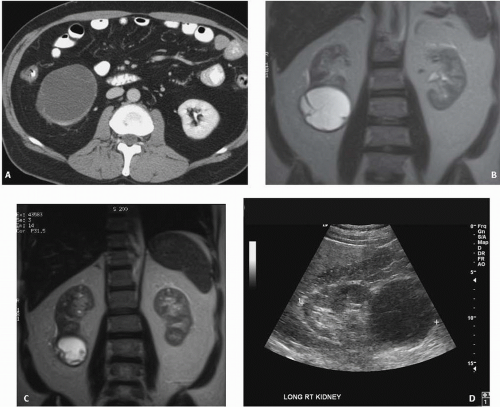
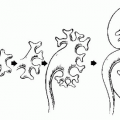
In all but very large tumors, renal function is preserved. Diminished renal function suggests tumor thrombus in the renal vein as a cause of the renal dysfunction. The tumor is identified as a mass with mottled density that causes a focal bulge in the renal contour. Such tumors are termed exophytic (Fig. 8.10). Tumors that do not deform the renal contour are termed intrarenal (Fig. 8.11). Involvement of the collecting system is seen as irregularity of the urothelial surface or complete occlusion of a calyx or infundibulum. A filling defect within the collecting system may represent blood clot or tumor invasion, but is relatively uncommon with renal parenchymal tumors (Fig. 8.12). If a mass is present in the collecting system, the lesion is more likely to represent a transitional cell carcinoma that has invaded the renal parenchyma rather than an RCC that invades the collecting system. Some tumors, particularly those with sarcomatoid features have an infiltrative appearance in which the reniform shape of the kidney is preserved. Occasionally, the tumor can be found arising in the wall of a simple renal cyst (Fig. 8.13). In some cases, the tumor itself has a cystic appearance (Fig. 8.14) and may be difficult to distinguish from a complex but benign renal cyst (see Chapter 7). It has been estimated that 15% of cases of RCC will be cystic on radiologic and pathologic examination. The clinical features of cystic RCC are similar to those that are completely solid. Although cystic RCCs may be of any histologic subtype, unilocular cystic RCCs are more commonly of the papillary variety. Hartman et al. suggest that there are four basic pathologic mechanisms resulting in cystic RCC: intrinsic multiloculated growth, intrinsic unilocular growth (cystadenocarcinoma), cystic necrosis, and origin from the epithelial lining of a preexisting simple cyst. Three basic radiologic patterns of cystic RCC may be seen: unilocular cystic mass, multiloculated cystic mass, and discrete mural nodule in a cystic mass.
TABLE 8.3 Renal Carcinoma Staging
Robson Stage
Disease Extent
I
Confined within renal capsule
II
Penetrates beyond renal capsule
IIIA
Extension to renal vein or IVC
IIIB
Involves regional lymph nodes
IIIC
Both vein and lymph node involvement
IVA
Tumor growth through Gerota fascia
IVB
Distant metastasis
2010 TNM Classification
TX
Primary tumor cannot be assessed
T1
Tumor <7 cm confined to kidney
T1a
<4 cm
T1b
4-7 cm
T2
Tumor >7 cm confined to kidney
T2a
Tumor >7 cm but less than 10 cm confined to kidney
T2b
Tumor >10 cm limited to the kidney
T3
Tumor extends into major veins or perinephric space but not ipsilateral adrenal
T3a
Renal vein, perinephric of renal sinus but confined to Gerota fascia
T3b
Tumors extend to IVC below diaphragm
T3c
IVC above diaphragm
T4
Extension into neighboring organs outside Gerota fascia or ipsilateral adrenal
N0
No nodal involvement
N1
Metastasis to a single regional node
N2
More than one node involved
M0
No distant metastasis
M1
Distant metastasis
Staging Groups
Stage I—T1 N0 M0
Stage II—T2 N0 M0
Stage III—T1 N1 M0; T2 N1 M0; T3 N0 M0
Stage IV—T4 N0-1 M0; Any T N2 M0; Any T, Any N, M1
FIGURE 8.8. RCC with dystrophic calcification. Noncontrast (A, B) enhanced (C) images from a CT of the abdomen in a patient with extensive dystrophic calcification from a conventional RCC.
FIGURE 8.9. RCC. Noncontrast (A), NP (B) images show a cystic mass in the upper pole of the left kidney with thick mural calcification. Multiple enhancing tumor nodules are present.
FIGURE 8.10. RCC. CT shows an exophytic left renal mass with extensive left para-aortic lymphadenopathy from a papillary RCC.
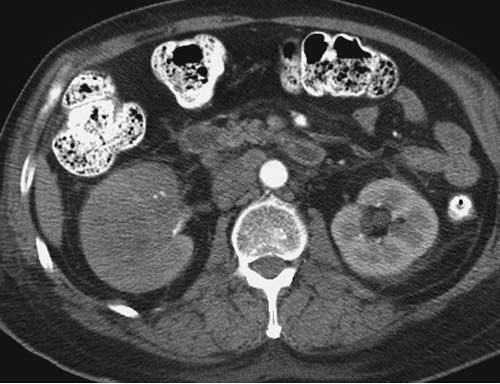
FIGURE 8.11. RCC. An intrarenal mass is present that does not deform the right renal contour. Retroperitoneal adenopathy is also present.
FIGURE 8.12. Renal carcinoma with filling defect in the renal pelvis. An excretory phase image through the midportion of the kidney demonstrates a filling defect (arrow) in the renal pelvis, simulating a transitional cell carcinoma. Para-aortic lymphadenopathy is also present.
FIGURE 8.13. Tumor in a cyst wall. A: Corticomedullary. B: Excretory phase images show an enhancing nodule in the wall of a simple cyst (arrow).
FIGURE 8.14. Cystic RCC. A: Excretory phase CT image shows a cystic renal mass with faint mural nodules. B, C: Coronal T2-weighted MR images show the thickened septae within the mass to better advantage. D: Ultrasound demonstrates a solid right lower pole mass.
Multilocular cystic clear cell carcinomas are rare tumors that have not been reported to metastize (Fig. 8.7). Septal thickening and mural calcification may be present.
Perinephric hemorrhage may be the presenting sign in some patients (Fig. 8.15). A renal tumor, either a RCC or an angiomyolipoma, is the most common cause of spontaneous perinephric hemorrhage in patients who are not being anticoagulated.
Pre- and postcontrast thin section multiphasic CT is the method of choice for evaluating a suspected renal mass. When a mass is identified on a CT scan performed for another purpose, it is often prudent to perform a dedicated renal CT in order to assess the vascularity of the lesion and its enhancement characteristics, as well as to accurately assess the status of the inferior vena cava, regional lymph nodes, and adjacent organs.
Details of the technique of a dedicated renal CT protocol are discussed in greater detail in Chapter 3. At a minimum, a three-phase study that includes a noncontrast examination of the liver and kidneys, a postcontrast study made during the nephrographic phase (NP), and an excretory phase set of images should be included in such a study. In addition, data sets reconstructed in the coronal plane are often helpful in identifying small masses. Some authors include images made during the corticomedullary phase (CMP), which, although not well suited for tumor detection, may be helpful in assessing the vascularity of the lesion.
FIGURE 8.15. RCC with acute hemorrhage. A: Noncontrast CT shows high attenuation acute perinephric hemorrhage surrounding the left kidney. B: After contrast enhancement, a renal mass is evident.
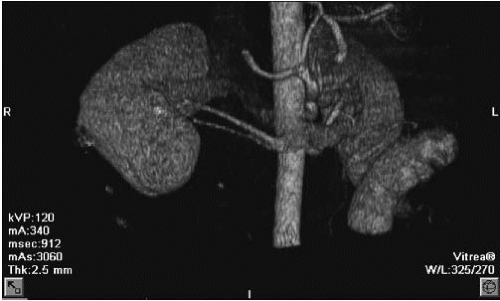
The speed of CT image acquisition allows imaging of the kidneys during the CMP and NP of contrast enhancement. Images may also be obtained during the vascular phase to optimally visualize the renal artery and vein (Fig. 8.16). Although vascular phase images are obtained slightly before CMP images, the two phases are sufficiently close that only one set of images may be needed. Vascular phase images may be useful to define renal vascular anatomy for planned urologic surgery. Vascular enhancement of a renal mass is most easily detected during the vascular or CMP. NP images are important for the detection of solid renal masses as they help avoid the false positive and false negative interpretations when only CMP images are examined.
It has been shown that multiphasic helical CT can be used to characterize the subtype of RCC that is present. Clear cell renal carcinomas tend to be heterogeneous, hypervascular masses, often with central areas of necrosis (Fig. 8.17). In one study, conventional renal tumors demonstrated 60 and 100 HU of enhancement, while papillary and chromophobe tumors enhanced only 30 to 50 HU.
On excretory phase imaging, an enhancement of more than 44 HU differentiated clear cell tumors from nonclear cell tumors with a sensitivity of 84%, a specificity of 91%, and a positive predictive value of 91%. In addition, chromophobe tumors often have a predominately homogeneous pattern of enhancement. Homogeneous enhancement was also related to tumor size; small (<3 cm) papillary tumors tended to also show homogeneous enhancement, whereas larger tumors and all conventional renal tumors tended to have heterogeneous enhancement. In the study by Herts et al. (2000), homogeneity and low tumor-to-aorta enhancement ratios significantly correlated with papillary histology (Fig. 8.18). This difference in the degree of enhancement is felt to be related to differences in intratumoral vascularity as measured by microvessel density (MVD). Wang showed that the degree of enhancement of RCC was directly related to the MVD of the tumor. Because they tend to show low levels of enhancement and are homogeneous, papillary tumors may be confused with complicated renal cysts (see Fig. 8.18). Chromophobe tumors tended to be more homogeneous and showed a peripheral pattern of enhancement (Fig. 8.19). No significant difference in enhancement pattern between papillary and chromophobe tumors, however, could be detected. Both papillary and chromophobe tumors were more likely, however, to have focal calcification than was found in conventional tumors. Perinephric changes are also common with larger tumors. Perinephric changes including fat stranding and increased perinephric vascularity, however, have been found to correlate with tumor size rather than with histologic type. Invasion into the perinephric space increases the tumor to a T3 lesion according to the TNM classification.
FIGURE 8.16. CT angiogram. Volume rendered CT angiogram shows two renal arteries with a common origin supplying a tumor in the right kidney.
Collecting duct tumors are rare; their imaging characteristics are similar to chromophobe and papillary tumors in that they typically show a peripheral pattern of enhancement (Fig. 8.20).
Multiple renal tumors may be found in approximately 5% to 10% of patients either as synchronous (Fig. 8.21) or metachronous tumors. With the advent of routine cross-sectional imaging to follow such patients, the incidence of multiple tumors being detected has increased, even in patients without inherited forms of RCC. The incidence of multifocal RCC is greater with papillary tumors than with clear cell tumors (11% vs. 2%); however, patients with clear cell histology are more likely to have a contralateral recurrence than is a patient with a unifocal tumor. Multifocality does not appear, however, to be associated with larger or higher stage tumors.
FIGURE 8.17. Conventional RCC. A, B: Two early phase axial images show a hypervascular mass in the upper pole of the right kidney. C, D: Coronal reconstructions.
CT FEATURES OF RCC
Typically exophytic but may be intrarenal or an infiltrative mass
May be hypervascular and heterogeneous (conventional) or homogeneous and poorly enhancing (papillary)
Typically discovered as an incidental finding
Best characterized on NP or excretory phase images
Ultrasound is particularly helpful in distinguishing solid from cystic renal masses. A renal adenocarcinoma is usually seen as a solid mass, although cystic regions representing areas of hemorrhage or necrosis are common. Intraoperative ultrasound is of particular value in patients with intrarenal lesions and plays an important role in patients being managed with nephron-sparing surgical approaches.
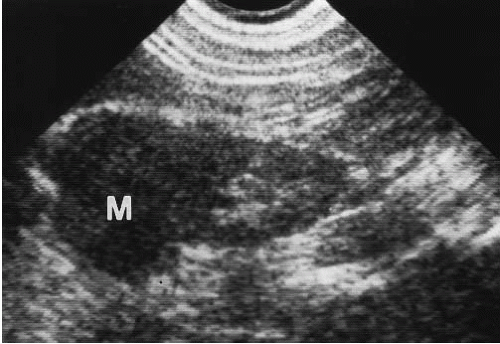
CT has supplanted the ultrasound (US) as the imaging study of choice for both the diagnosis and staging of RCC. In one study of patients with VHL followed with both examinations, US failed to identify 80% of masses smaller than 1 cm seen on CT. Microbubble contrast agents, while not approved in the United States, have been shown to enhance vascular elements within soft tissues including the kidney and may be useful in some RCCs that are hypovascular on enhanced CT. The echogenicity of renal carcinomas is variable. They may be more echogenic, less echogenic (Fig. 8.22), or isoechoic with the normal renal parenchyma. Highly echogenic tumors, which are more frequently small tumors, may mimic the increased echogenicity of fat-containing tumors such as angiomyolipomas. With the increased recognition of small renal carcinomas, more hyperechoic tumors mimicking angiomyolipomas are found. However, an anechoic rim is often present in hyperechoic renal carcinomas and is not seen in angiomyolipomas. Isoechoic tumors may be difficult to detect with ultrasound, especially if they are small and do not displace the collecting system or produce a contour deformity. Less echogenic tumors simulate more homogeneous tumors such as lymphomas or may be confused with renal cysts. However, these solid tumors have poorly defined margins and do not have the increased sound transmission seen with cysts. A few renal adenocarcinomas are frankly cystic. However, even these tumors can usually be distinguished from simple cysts by their irregularly thick walls and the presence of some internal echoes.
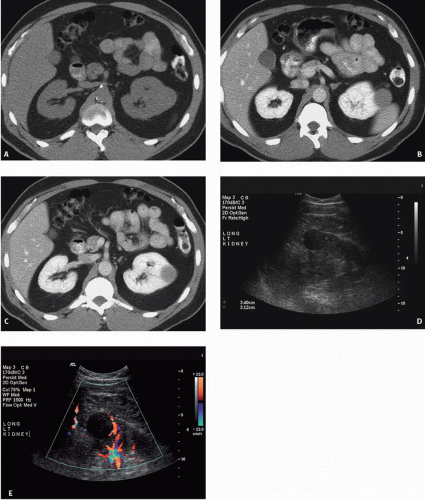
FIGURE 8.18. Papillary RCC. A: Noncontrast study shows an exophytic renal mass with an attenuation of 40 HU. After contrast enhancement (B, C), the mass increases to 60 HU. On ultrasound (D), the mass is hypoechoic. Color Doppler (E) shows no flow. Because of this low level of enhancement and its homogeneous appearance, confusion with a complicated renal cyst may occur.
FIGURE 8.19. Chromophobe RCC. An axial image from early phase CT shows a relatively homogeneous mass in the right kidney with a peripheral rim of enhancement. A small focus of dystrophic calcification is present as well.
FIGURE 8.20. Collecting duct carcinoma. An arterial image showing a poorly enhancing right renal mass.
Doppler ultrasound provides a noninvasive measure of the vascularity of a renal mass. High-velocity signals, which are presumably due to arteriovenous shunting, are frequently seen in renal carcinomas. Kuijpers et al. (1994) report that a Doppler shift of 2.5 kHz or more indicates a renal carcinoma or inflammatory mass, whereas a shift of less than 2.5 kHz supports the diagnosis of a benign cyst.
MRI has become a valuable modality for evaluating renal masses. The improved signal-to-noise ratios, more practical breath-holding techniques, and fat suppression protocols make lesions more conspicuous. The use of intravascular contrast agents has improved MR sensitivity for detecting renal masses to approximately equal that of contrast-enhanced CT.
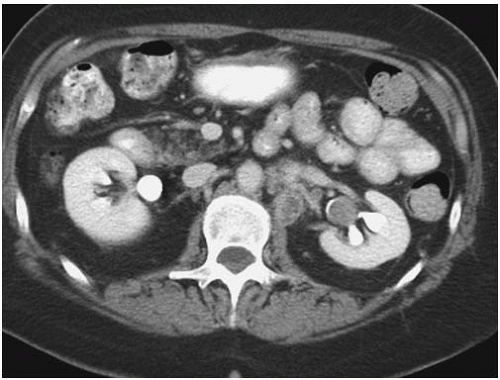
FIGURE 8.21. Multifocal RCC. A, B: Axial images through the kidney show two separate enhancing renal masses in a patient with synchronous primary tumors.
FIGURE 8.22. Renal carcinoma. Ultrasound reveals a mass (M) in the upper pole that is slightly less echogenic than the normal renal parenchyma.
RENAL CARCINOMA (MRI)
Sensitivity similar to CT
Homogeneous tumors are isointense with parenchyma on T1- and T2-weighted sequences
Hypovascular tumors are better seen with fat-saturation techniques
Yamashita et al. (1996) reported finding a pseudocapsule in 66% of renal carcinomas 4 cm in diameter or smaller. This may be useful in surgical planning, because the presence of a pseudocapsule may make enucleation easier.
The signal characteristics of renal carcinomas vary with the vascularity of the tumor and the presence or absence of central necrosis, calcification, hemorrhage, and iron deposits and the subtype of renal tumor that is present. Papillary tumors are typically hypointense on T1 and T2 studies (Fig. 8.23), whereas conventional RCC has higher signal intensity on T2-weighted images (Fig. 8.24). Unlike CT, enhancement on MR is based on signal intensity and is unique to each examination. Thus, quantitative assessment is not possible. Subtraction techniques can visually demonstrate enhancement and can be used when the degree of enhancement is used to assess the lesion’s solid or cystic character. Diffusion-weighted imaging has been shown to be of value in differentiating papillary and clear cell varieties of RCC. With b values of 0 and 500 seconds per mm2, clear cell tumors showed a significantly higher mean apparent diffusion coefficient than papillary tumors.
Only gold members can continue reading. Log In or Register to continue