Fig. 33.1
Chromophobe carcinoma: ultrasound shows a large solid hyperechoic lesion in the upper pole of the right kidney (a). Axial (b) arterial phase image shows the renal lesion with inhomogeneous enhancement. In the axial (c) and coronal (d) split-bolus nephrographic phase images, the lesion appears hypodense
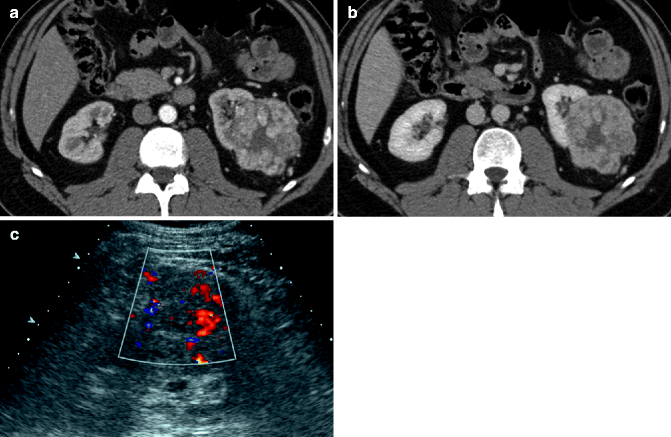
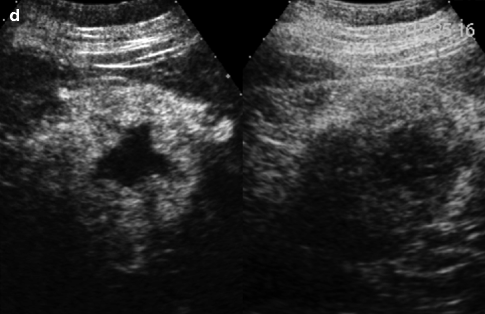
Fig. 33.2
Axial arterial phase (a) image shows a large lesion in the left kidney, hypervascular with a central hypodense portion. In the axial nephrographic image (b) the lesion appears hypodense. On color-Doppler ultrasound (c) the lesion appears isoechoic to the normal renal cortex, and large vessels can be recognized. On contrast-enhanced ultrasound (d) the tumor appears well vascularized in the solid portion, and a necrotic central portion is well recognized
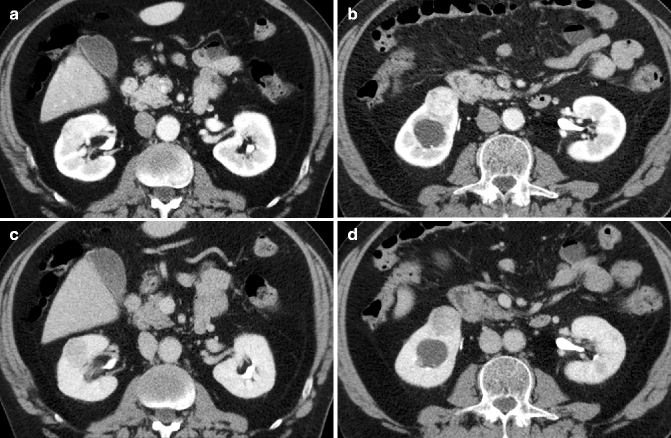
Fig. 33.3
Clear cell carcinoma, with sarcomatous transformation. Axial (a, b) arterial phase split-bolus CT images show two large solid tumors in the right kidney, inhomogeneously hypervascular. The two lesions appear hypodense in the nephrographic phase images (c, d)
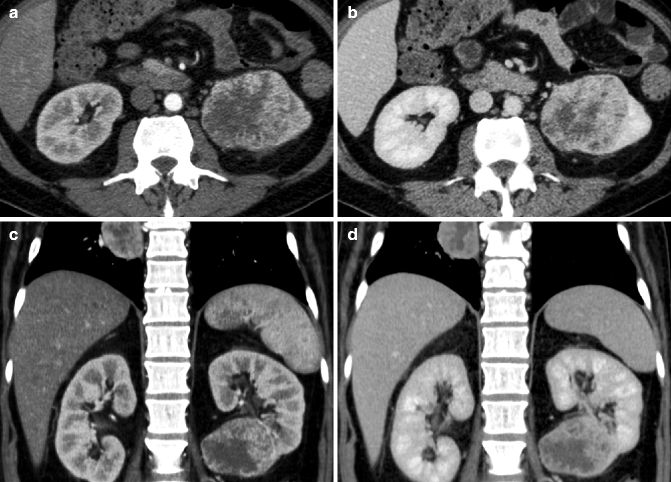
Fig. 33.4
Clear cell carcinoma. Axial (a) and coronal (b) arterial phase CT images show a large inhomogeneous tumor in the left kidney. The tumor appears hypodense in the axial (c) and coronal (d) nephrographic phase images
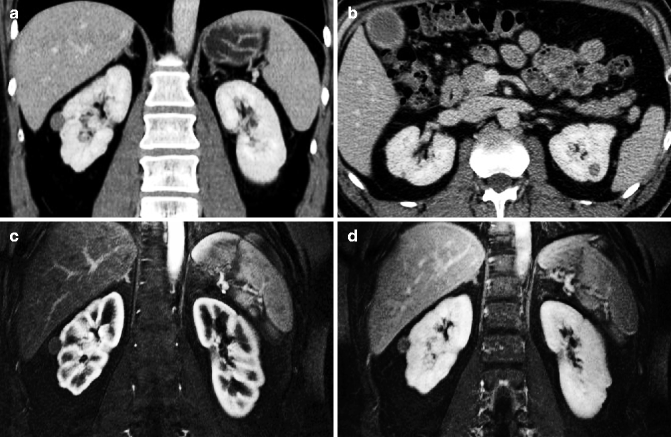
Fig. 33.5
Coronal (a) and axial (b) nephrographic phase CT images show two small solid lesions in the right and left kidney, hypodense to the normal parenchyma. Coronal arterial phase (c) and nephrographic (d) phase MRI show the lesion in the right kidney, hypointense to the normal parenchyma
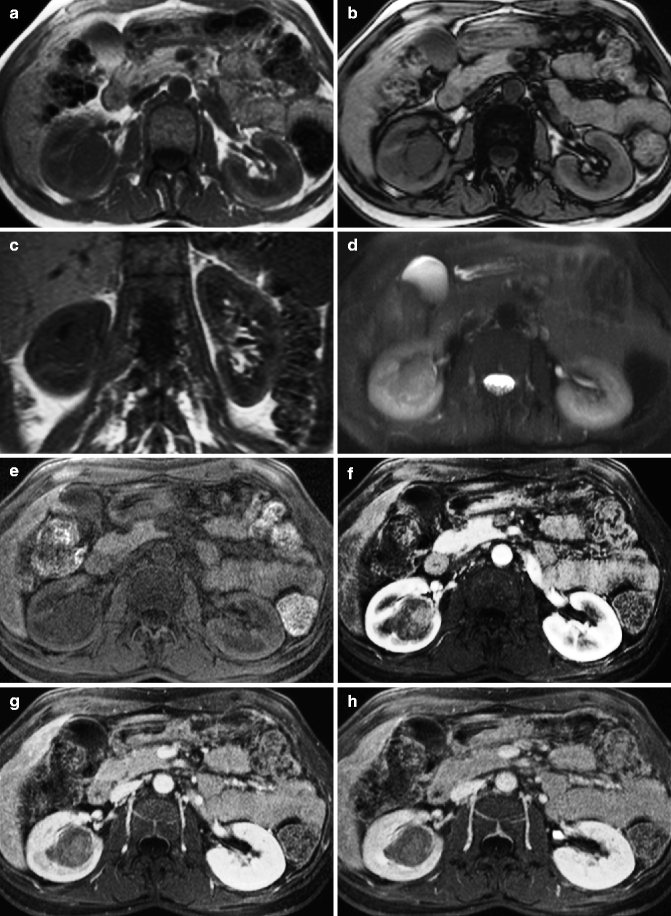
Fig. 33.6
MRI appearance of renal cell carcinoma. An oval mass with sharp margins rises from the renal parenchyma, extending into the sinus. In-phase (a) and out-of-phase (b) images show near-isointensity with the normal renal parenchyma, without signal drop on the out-of-phase image. The mass is also isointense on the coronal T1-weighted image (c) while it appears mildly hypointense on the fat-saturated T2-weighted image (d). Following contrast administration (e) non-contrast; (f) arterial phase; (g) nephrographic phase; (h) excretory phase, the mass appears relatively hypovascular compared to the renal cortex. The mass is better delineated in the nephrographic and excretory phases
Both CT and MRI are used to detect, characterize, and stage renal tumors. The high spatial and contrast resolution of CT and MRI makes detection of masses fairly easy. Characterization is however more challenging because there are some difficulties in differentiating benign from malignant tumors and cystic complex masses. Benign tumors that enter into differential diagnosis with malignant tumors are oncocytoma and lipid-poor angiomyolipoma (Israel and Bosniak 2005). Renal oncocytoma is a benign tumor which presents with soft tissue density on CT, mainly isoattenuating to the normal renal parenchyma on non-contrast-enhanced CT. Following contrast administration, renal oncocytoma is usually hypervascular and therefore hyperdense in the arterial phase and relatively hypodense compared to the renal parenchyma in the nephrographic phase (Fig. 33.7). In typical cases, a central hypodense area with stellate morphology, representing the central scar, is visible. However, this typical feature, highly characteristic of renal oncocytoma, is visible only in a minority of cases and mainly in larger oncocytomas. Similarly, at MRI renal oncocytomas appear hypointense on T1-weighted images and hyperintense on T2-weighted images. Following contrast administration these tumors are hyperintense in the arterial phase and relatively hypointense compared to the renal parenchyma in the nephrographic phase (Schatz and Lieber 2003; Zagoria 2000). The detectability of the central scar on MRI is the same as on CT, so the differential diagnosis remains difficult also with MRI. Recently a number of papers have been dedicated to the possibility of differentiating oncocytomas from renal cell carcinoma using diffusion-weighted images and apparent diffusion coefficient (ADC) values. Oncocytomas tend to have higher ADC values than renal cell carcinomas; a possible explanation is the higher cellularity of malignant renal tumors compared with benign renal tumors. Although this information is of interest and represents an additional finding useful for the differential diagnosis, it must be noted that there is some overlap between the ADC values of oncocytomas and renal cell carcinomas (Doğanay et al. 2011; Rosenkrantz et al. 2010).
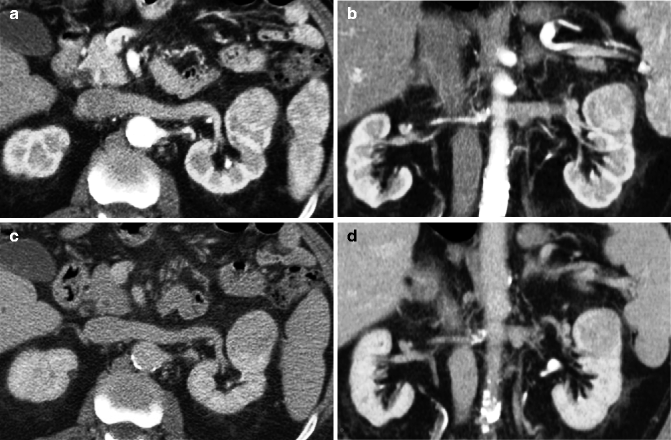

Fig. 33.7
Axial (a) and coronal (b) arterial phase CT images show a large solid tumor in the upper pole of the left kidney, which appears well vascularized. In the axial (c) and coronal (d) nephrographic phase images, the lesion appears hypodense. Pathology of the resected specimen revealed that the lesion was an oncocytoma
Lipid-poor angiomyolipomas also enter into differential diagnosis with malignant tumors (Bj and Wong-Yoll-Cheong 1997; Pozzi Mucelli and Locatelli 2002; Jinzaki et al. 1997). Typical angiomyolipomas are easily characterized with ultrasound, CT, and MRI because they contain fat (Pozzi Mucelli and Locatelli 2002): fat is responsible for the hyperechogenicity on ultrasound, low density on CT, and high signal intensity on T1-weighted MRI. Furthermore, fat can be specifically suppressed on selective fat-saturated sequences in MRI. Lipid-poor angiomyolipomas are rare and represent about 10 % of all renal angiomyolipomas. Their diagnosis is difficult since the density on CT is the same as renal cell carcinomas, both on non-contrast- and contrast-enhanced scans. Also, the signal intensity in MRI of lipid-poor angiomyolipomas and renal cell carcinomas is similar, although it has been suggested that chemical shift sequences, with in- and out-of-phase images, can show a signal drop on out-of-phase images due to the minimal amount of fat that is not detectable with other imaging methods (Burdeny et al. 1997; Israel et al. 2005; Olltwater et al. 1997).
CT and MRI have important roles in staging of renal tumors (Moch et al. 2009). CT is usually preferred in the staging of this neoplasm, because of the possibility of evaluating the lungs, while the results of CT and MRI for staging the abdomen are similar. Concerning local extension, a careful evaluation of the size and the site of the tumor should be performed, together with assessment of the involvement of the renal fascia, the renal vein, the inferior vena cava, and the surrounding organs (adrenal glands, liver, spleen, colon) (Fig. 33.8). The evaluation of the extent includes also the presence of nodes and metastases, mainly in the liver and lungs, but, although rare, also in other organs, such as the pancreas (Figs. 33.9 and 33.10). This assessment is very important because imaging findings influence the type of surgery. Nowadays, since a growing number of renal tumors of small size are detected, these lesions are treated conservatively with tumorectomy, partial nephrectomy, or by means of ablation techniques, rather than with radical nephrectomy which is performed for larger, infiltrating tumors (Tan et al. 2012; Zagoria et al. 2011; Rodriguez et al. 2000; Gill et al. 2000).
Get Clinical Tree app for offline access

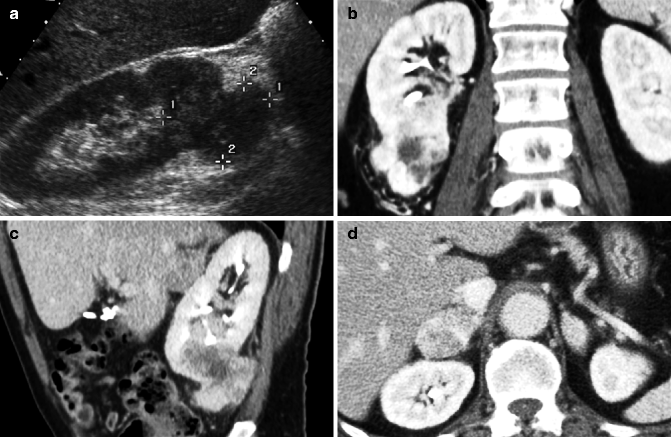
Fig. 33.8
Clear cell carcinoma: Ultrasound shows a large solid isoechoic lesion in the lower pole of the right kidney (a). Coronal (b) split-bolus arterial phase image shows that the renal lesion has inhomogeneous enhancement. In the sagittal oblique (c) split-bolus nephrographic phase image, the lesion appears hypodense. Split-bolus arterial phase axial image shows a large right adrenal localization, consistent with metastasis (d)

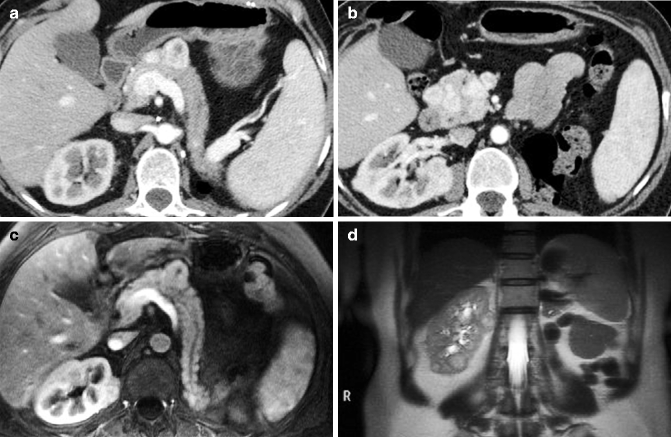
Fig. 33.9
Axial arterial phase images (a, b) show multiple metachronous renal lesions and pancreatic metastases in a patient who had already undergone left nephrectomy. Axial arterial phase MRI (c) shows the pancreatic mass in the body. Coronal T2-weighted MRI (d) shows multiple slightly hyperintense renal masses

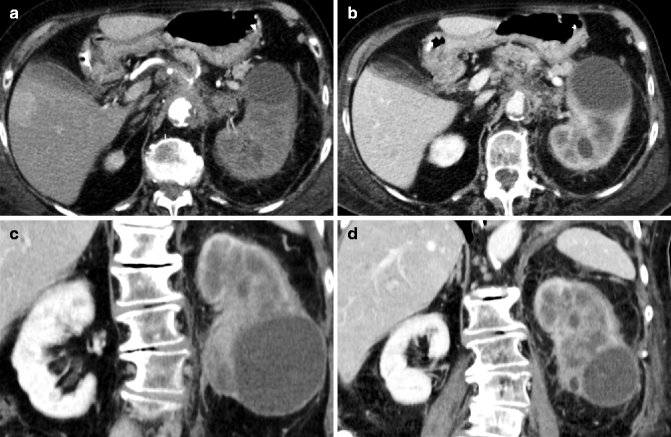
Fig. 33.10
Large infiltrating lesion in the left kidney. Axial early arterial phase CT image shows the left kidney, enlarged, with reduced vascularization (a); a simple cyst is also seen in the lower pole. Axial (b) and coronal (c, d


Stay updated, free articles. Join our Telegram channel

Full access? Get Clinical Tree


