Renovascular Hypertension
Etiology
The most common cause of renovascular hypertension is renal artery stenosis, which may be caused by atherosclerosis (70% to 90%) or less commonly by fibromuscular dysplasia (10% to 30%). Rare causes of renal artery stenosis include arteritis, arterial dissection, and neurofibromatosis.
Prevalence and Epidemiology
Renovascular hypertension pertains to the causal relationship between renal artery stenosis and its clinical consequences, namely, hypertension and/or renal failure. Among hypertensive patients, 1% to 5% have true renovascular hypertension. However, renovascular hypertension affects 15% to 30% of patients who have clinical criteria that suggest renal vascular disease.
Clinical Presentation
Clinical clues that suggest renal artery stenosis include :
- •
Hypertension, early onset (<30 years of age) or severe hypertension over 55 years of age
- •
Accelerated, resistant, or malignant hypertension
- •
Sudden development or worsening of hypertension at any age
- •
Hypertension and unexplained renal insufficiency
- •
Hypertension refractory to multiple drug therapy
- •
Sudden unexplained pulmonary edema
- •
Epigastric or flank bruit
- •
Unexplained congestive heart failure or refractory angina
- •
Unexplained unilateral small kidney or size discrepancy greater than 1.5 cm between kidneys ( Figure 65-1 )

Figure 65-1
A 10-minute delayed image from an intravenous urogram shows a unilateral atrophic kidney on the right secondary to chronic renal insufficiency related to renal artery stenosis.
Pathophysiology
The renal arteries arise from the abdominal aorta and pass in a dorsal and inferolateral direction to enter the renal hilum. One or more accessory renal arteries is present in over 30% of the population, which is clinically important because, rarely, renal artery stenosis in an accessory renal artery can cause renovascular hypertension.
Pathology
A 50% reduction in renal artery diameter (which corresponds to a 75% reduction of the cross-sectional area of the vessel) is considered hemodynamically significant.
Atherosclerosis typically involves the ostium and proximal one third of the main renal artery and is often associated with aortic atherosclerosis.
Fibromuscular dysplasia is a collection of vascular diseases that cause proliferation of components of the arterial wall. Subtypes are classified by the layers of the arterial wall involved. The renal arteries are the most commonly affected vessels.
Renal artery stenosis caused by fibromuscular dysplasia involves the mid to distal main renal arteries and the segmental renal arteries.
Imaging
Digital Subtraction Angiography
For decades, digital subtraction angiography (DSA) was the method of choice for diagnosing renal artery stenosis. With DSA, pressure may be measured across renovascular stenoses, allowing quantitative assessment of the physiologic effect of the stenosis and objective assessment of the physiologic effect of endovascular therapy.
However, DSA is invasive and subject to substantial interobserver variation. Technologic advances in other imaging modalities (duplex ultrasonography, computed tomography [CT], magnetic resonance imaging [MRI], magnetic resonance angiography [MRA]) now permit the noninvasive diagnosis of renovascular stenosis, and the role of DSA is now limited to prerevascularization planning and therapy.
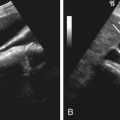
On DSA, signs of atherosclerotic renal artery stenosis include ostial or proximal renal artery narrowing and plaque in the adjacent aorta, whereas fibromuscular dysplasia causes “beading” as a result of alternating areas of fibromuscular proliferation and arterial wall thinning or aneurysm formation ( Figure 65-2 ).

Computed Tomography
Multidetector CT angiography has significantly improved resolution and reduced the contrast dose for evaluation of the renal arteries in a single breath-hold. Bolus tracking methods should be used to ensure optimal arterial opacification. In addition to evaluating the abdominal aorta and renal arteries, assessment of other visceral arteries, evaluation of renal size, cortical thickness, and detection of other renal parenchymal abnormalities can be performed in the same study ( Figure 65-3 ). CT angiography has a high sensitivity (88% to 96%) and specificity (83% to 99%) for detection of renal artery stenosis.

However, CT angiography requires the administration of iodinated contrast media, precluding its use in the many patients with renal artery stenosis who have significantly impaired renal function.
Magnetic Resonance Imaging
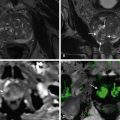
MR angiography has moved from flow-enhanced (time of flight) sequences to breath-hold three-dimensional (3D) spoiled gradient recalled echo gadolinium-enhanced MR angiography (Gd-MRA) using bolus-tracking methods to evaluate the renal arteries. Maximum intensity projection images are routinely reconstructed, but the accurate diagnosis of stenoses requires the evaluation of source images ( Figure 65-4 ). Gd-MRA has a sensitivity of 88% to 100% and a specificity of 71% to 99% for renal artery stenosis and a sensitivity of up to 90% for the detection of accessory renal arteries.

Phase-contrast imaging allows evaluation for turbulence, a finding representative of flow-limiting lesions with more than 50% diameter reduction and is used in addition to Gd-MRA. Phase contrast and steady-state free precession (SSFP) noncontrast techniques are useful in patients whose renal function precludes the use of gadolinium.
In addition, nonenhanced MR angiography allows a safely repeated examination, if required ( Figure 65-5 ). Two recent papers compared a non–contrast-enhanced MRA technique—time-spatial labeling inversion pulse three-dimensional MR with balanced SSFP with DSA and CT angiography.

In the study by Parienty and colleagues, the nonenhanced 3D MR technique provided sensitivity of 93%, specificity of 88%, and accuracy of 91% when compared with DSA. Similarly, in the Renal Artery Contrast Free Trial (REACT), nonenhanced MRA was compared with contrast-enhanced computed tomography angiography and showed a sensitivity of 74%, specificity of 93%, and accuracy of 90%.
Phase-contrast imaging and flow estimation also reduce interobserver variability when evaluating relatively small-caliber vessels, including the renal arteries.
Ultrasonography
The main renal arteries are visualized and examined with color or power Doppler imaging, followed by renal artery velocity analysis with spectral Doppler imaging. Ultrasonography is widely available, noninvasive, and relatively inexpensive and involves no ionizing radiation. However, there are some drawbacks, as follows:
- •
Accessory renal artery detection is poor.
- •
The wide range of sensitivity of 40% to 90% reflects the intrinsic difficulty of imaging of the renal arteries, the high level of expertise needed, and interobserver variation.
- •
There is a high rate (10% to 20%) of nondiagnostic studies.
Criteria to diagnose significant stenosis of a renal artery include:
- 1.
Peak systolic velocity (PSV) at the site of stenosis of 150 cm/s or greater (indicates 50% stenosis) and 180 cm/s or greater (60% stenosis)
- 2.
Ratio of renal to aortic PSV greater than 3.5 (indicates >60% stenosis)
- 3.
Turbulent flow in the poststenotic area
- 4.
Undetectable Doppler signal in renal artery indicates occlusion, provided that proper technique has been used
- 5.
Indirect diagnosis by assessment of intrarenal arteries; severe stenoses that decrease renal artery diameter by more than 75% produce distal intrarenal vascular changes—a tardus parvus phenomenon with a slowed systolic acceleration and a decreased resistive index. Findings include (1) acceleration of less than 370 to 470 cm/s, (2) time of acceleration greater than 0.05 to 0.08 second, and (3) a resistive index difference of greater than 5% between the right and left kidneys.
Interobserver and intraobserver variability using these criteria is high. The factors responsible for changes in the distal waveform are complex and probably more dependent on changes of compliance than on perfusion pressure. Therefore, these criteria are used only when obvious on spectral traces, when quantifying the stenosis as severe (>75%), or when identifying stenosis of a segmental or accessory artery that cannot be identified with spectral Doppler imaging.
Recently developed intravenous microbubble contrast agents may improve diagnostic accuracy and study success rates.
Nuclear Medicine
Unlike cross-sectional imaging, nuclear medicine techniques assess for functional changes secondary to renal artery stenosis. Renal artery stenosis causes hyperactivity of the renin-angiotensin-angiotensin–converting enzyme (ACE) feedback loop. The subsequent efferent arteriolar constriction and secondary elevation of blood pressure maintain renal perfusion and hence function. ACE inhibition removes this efferent arteriolar constriction, decreasing perfusion and function in the affected kidney. The test is therefore useful in identifying physiologically significant renal artery stenosis, thereby facilitating the selection of patients with renal artery stenosis who will benefit from revascularization.
Technetium-99m ( 99m Tc)–labeled mercaptoacetyl triglycine (MAG-3) is the radiotracer of choice for renal imaging. Studies are performed before and after the administration of ACE inhibitors (ACEIs), with unilateral decrease in function or prolonged radiotracer retention after ACE inhibition representing a high probability (>90%) of renal artery stenosis. Criteria include change in the 20-minute/peak uptake ratio of 0.15 or greater, a significantly prolonged transit time, or a change in the scintigraphic grade.
Grades are based on the scintigraphic curves ( Figure 65-6 ) and are classified as follows :
0 = Normal
1 = Minor abnormalities but T max (time to maximum activity) greater than 5 minutes and 20 min/peak uptake ratio greater than 0.3
2 = Marked delayed excretion with preserved washout phase
3 = Delayed excretion without washout phase
4 = Renal failure pattern with measurable kidney uptake
5 = Renal failure pattern without measurable kidney uptake

General interpretive criteria include the following :
- 1.
Normal ACEI scintigram: Low (<10%) probability of renovascular hypertension.
- 2.
Small, poorly functioning kidney (<30% uptake) with no change in time to peak when ACEI scintigram and bilateral symmetric cortical retention indicate intermediate probability of renovascular hypertension.
- 3.
Worsening of scintigraphic curve, reduction in relative uptake, prolongation of renal and parenchymal transit time, increase in the 20-minute/peak uptake ratio, and prolongation of time to maximum activity (T max ) are associated with high probability of renovascular hypertension.
Imaging Algorithm
There is no single accepted algorithm for diagnosing renal artery stenosis ( Box 65-1 ). One approach is to perform ACEI renography in patients with normal or mildly decreased renal function, followed by CT angiography or MR angiography if scintigraphy suggests an intermediate to high probability for physiologically significant renovascular hypertension. Patients with severely impaired renal function should have anatomic evaluation with MR angiography or Doppler ultrasound imaging and functional evaluation with renal scintigraphy ( Table 65-1 ).
Essential hypertension is a diagnosis of exclusion, made after careful history taking, physical examination, and laboratory studies.
Other causes of secondary hypertension include:
- •
Adrenal adenoma: shown by raised plasma cortisol levels
- •
Aortic dissection/coarctation: diagnosed by cross-sectional imaging
- •
Hyperthyroidism: indicated by suppressed thyroid-stimulating hormone
- •
Pheochromocytoma: evident by raised plasma metanephrine levels and 24-hour urinary catecholamine values
| Modality | Accuracy | Limitations | Pitfalls |
|---|---|---|---|
| CT | Sensitivity (88%-96%) Specificity (83%-99%) Best with thin-section multidetector systems | No functional evaluation Iodinated radiation exposure Contraindicated if elevated renal function | Extensive calcification may obscure lumen. Not as accurate in the diagnosis of fibromuscular dysplasia as digital subtraction angiography |
| MRI | Gd-MRA: Sensitivity >95% and specificity >90% for ± 50% renal artery stenosis Noncontrast MRA using 3D SSFP techniques yield sensitivity of 73%-93%, specificity of 88%, and accuracy of 91% | No functional evaluation Usual contraindications to MRI (e.g., pacemakers, metallic implants) Decreased renal function may limit the intravenous use of gadolinium. | Renal artery stenosis may be overestimated. Not sensitive in diagnosis of fibromuscular dysplasia |
| Ultrasonography | Sensitivity for detection of renal artery stenosis 70% or greater is 72%-90%. Primary use is screening for renal artery stenosis. | Needs well-trained technologist Excessive bowel gas and obesity limit evaluation. | Interobserver variability |
| Nuclear medicine | Sensitivity for detection of renal artery stenosis 70% or greater is 51%-96%. | Bilateral disease | Patient hydration influences results. |
Related posts:

Stay updated, free articles. Join our Telegram channel

Full access? Get Clinical Tree


