Sarcomas
Janet Eary
Sarcomas are thought of as relatively rare tumors, however, considering the entire group as a whole, they occur at a higher incidence than this term would suggest. The sarcomas are derived from mesenchymal tissue elements and as such are diagnosed in myriad clinical presentations. This complex group also has a wide variation in clinical outcomes, ranging from relatively indolent behavior that can be treated with surgical management to some of the most biologically aggressive and treatment resistant tumors that can be encountered in clinical practice. Commonly, the sarcomas are considered in two groups: the soft tissues sarcomas and the bone tumors. As with most descriptions of sarcomas, there are many exceptions to such classifications. Several soft tissue sarcomas can present as primary bone tumors, and there are notable presentations of bone tumors that arise in the soft tissues. Although positron emission tomography (PET) imaging in sarcomas presents challenges, it offers opportunities to make a significant contribution to patient care and to explore the utility of imaging in understanding tumor biological behavior.
Soft Tissue Sarcomas
The classification schemes for sarcomas are designed to help assess tumor biologic behavior for treatment planning. They are largely based on histologic criteria that are described on the presumed tissue or origin for a given tumor. In large part, this scheme is successful at categorizing soft tissue sarcomas. Table 8.19.1 shows the most common soft tissue sarcomas classified on the basis of their tissue of origin. However, periodically the classification schemes for sarcoma undergo a certain amount of reconsideration, as this group contains clearly distinct tumors that have no known tissue of origin such as the alveolar soft sarcomas and the epithelioid subtypes. Currently, there is some thinking that although soft tissue sarcomas arise from mesenchymal tissues, their apparent differentiation is a result of local factors, and histologic appearance may not consistently reflect the tissue of origin.
Newer tissue analysis techniques such as immunocytochemistry, cytogenetics, and gene microarrays are suggesting that there is indeed overlap in tumor characteristics, some of which support the current classification schemes and some that do not. The histologic grade of the tumor, which may take into account all of these additional tissue analyses, is most commonly used for prediction of tumor biologic behavior or prognosis and treatment planning. The FNCLCC (Federation Nationale des Centre de Lutte Contre le Cancer) classification scheme for the assessment of the histologic grade of the tumor is most commonly used for the diagnosis of sarcoma (1). It assigns a point score for several tissue characteristics. Factors such as mitotic rate, cellularity, and differentiation are associated with high predictive values for patient outcome.
Soft tissue sarcomas have certain distributions of location within the body for the various tumor histologic subtypes. This factor in many ways also helps to account for differences in patient prognoses between the tumor subtypes and within the patient groups who seemingly display the same tumor subtype. As with tissue diagnosis in sarcomas, there are many exceptions to these descriptions, but their use assists in beginning the process of patient tumor assessment and treatment planning.
Most authorities agree that any given scheme for sarcoma classification and patient outcome prediction has weaknesses that are related to the complexities of these tumors. They often present as large heterogeneous masses that may be deep seated. Masses with a similar appearance on anatomic imaging may have widely differing biologic behavior. Because of this variety in presentation, there can be a significant error in diagnosis for soft tissue sarcomas. Errors in tumor grade that dictate the need for adjuvant therapy have the most consequences. Other errors in classification type and inclusion as sarcomas as opposed to other cancer histologies can also be significant for the purposes of treatment planning for optimal patient outcome and reduction in morbidity.
The trend toward core needle biopsy of these often very large tumors may be increasing these problems based on sampling error alone (2). Most often located for surgical convenience, these small biopsies may miss the most biologically aggressive area of the
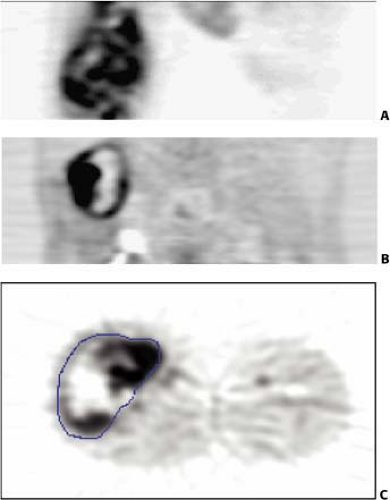
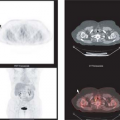
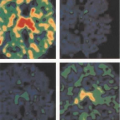
tumor or an area of significant tumor necrosis. The presence of significant liquefactive necrosis is an important factor in the assessment of tumor grade; high-grade tumors are identified by the presence of necrosis. Most sarcoma treatment centers would agree that patients with large intermediate and high-grade tumors benefit from preoperative adjuvant treatment prior to resection. Radiation therapy also plays a role in situations where tumor resection margins are close or contaminated with infiltrating tumor. Fig. 8.19.1 shows fluorodeoxyglucose (FDG) PET images of soft tissue sarcomas with significant spatial heterogeneity in tracer uptake. It demonstrates the potential problem of sampling error for tumor assessment when core biopsy is used for diagnosis. This tumor has areas of low and high uptake as well as significant photopenic areas that likely correspond to tumor necrosis. This appearance indicates a high-grade tumor, with the expected aggressive behavior in the form of early local recurrence and metastases (3,4).
tumor or an area of significant tumor necrosis. The presence of significant liquefactive necrosis is an important factor in the assessment of tumor grade; high-grade tumors are identified by the presence of necrosis. Most sarcoma treatment centers would agree that patients with large intermediate and high-grade tumors benefit from preoperative adjuvant treatment prior to resection. Radiation therapy also plays a role in situations where tumor resection margins are close or contaminated with infiltrating tumor. Fig. 8.19.1 shows fluorodeoxyglucose (FDG) PET images of soft tissue sarcomas with significant spatial heterogeneity in tracer uptake. It demonstrates the potential problem of sampling error for tumor assessment when core biopsy is used for diagnosis. This tumor has areas of low and high uptake as well as significant photopenic areas that likely correspond to tumor necrosis. This appearance indicates a high-grade tumor, with the expected aggressive behavior in the form of early local recurrence and metastases (3,4).
Table 8.19.1 Soft Tissue Sarcoma Subtypes | |
|---|---|
|
Fluorodeoxyglucose PET for Diagnosis of Soft Tissue Sarcomas
Work in PET imaging in soft tissue sarcomas has focused mainly on the problems in diagnosis and assessment of the biological aggressiveness of the tumor, as mentioned above in the discussion of histopathology. Many investigators have endeavored to evaluate the use of FDG PET for the diagnosis of sarcoma, with particular aims directed toward correlation of FDG uptake to describe tumor metabolism with tumor histologic grade. Their goal was to improve accuracy in diagnosis. Sarcomas have regional heterogeneity within the tumor mass, and some areas may be less well differentiated than others. These areas are reflected by a regional increase in FDG uptake, easily noted on a clinical scan. From experience with pathological diagnoses, it is known that the behavior of sarcomas is usually dictated by the most biologically aggressive component. Regional tumor areas with increased uptake have histologic correlates that have been used to support the use of FDG PET for tumor diagnosis and assessment of tumor grade.
Folpe et al. (4) found that an increased tumor standardized uptake value (SUV) was associated with increasing histopathological grade (grades I to III), tissue cellularity, mitotic activity, MIB labeling index, and p53 overexpression. These data suggest that FDG PET images can be used effectively to guide biopsy. Hain et al. (5) found that areas of the tumor with the highest SUV were the most malignant regions compared to the rest of the tumor. Benign tumors did not show significant FDG uptake.
There are numerous published reports from investigators exploring the use of FDG PET to grade sarcomas prior to treatment (6,7,8,9,10,11,12,13,14). Generally, FDG PET shows a significant ability to distinguish benign or low-grade from high-grade tumors. Lucas et al.
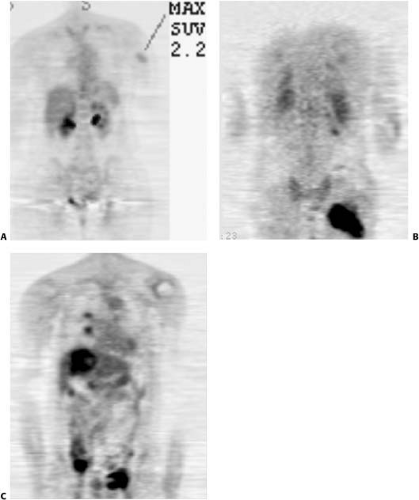
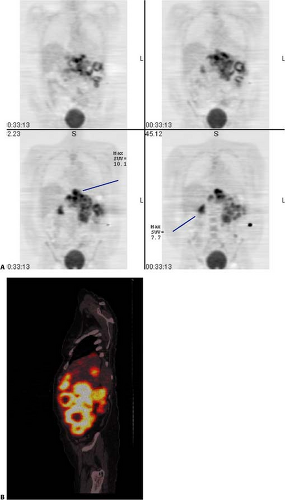
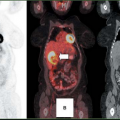
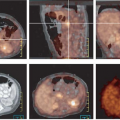
(12), using a quantitative assessment, reported a 95% sensitivity and a 75% specificity for diagnosis. This result is similar to the work published in other studies. Figs. 8.19.2 and 8.19.3 show examples of soft tissue sarcomas.
(12), using a quantitative assessment, reported a 95% sensitivity and a 75% specificity for diagnosis. This result is similar to the work published in other studies. Figs. 8.19.2 and 8.19.3 show examples of soft tissue sarcomas.
Like most other efforts in sarcoma research, published reports are often hampered with low patient numbers and groups of patients with mixed histologic subtypes of tumor. With a number of published studies on the diagnosis of sarcoma in the literature over the past decade, several authors have performed meta-analyses to review the general pertinent findings from the group of studies. Ioannidis and Lau (15) performed a meta-analysis of 15 studies with 441 soft tissue lesions analyzed with receiver operator curves. The sensitivity for distinguishing benign from malignant tumors using visual techniques were 92% and 73%, respectively, and all intermediate- to high-grade tumors were identified visually. Tumors with SUV greater than 2.0 had a sensitivity of 87% and specificity of 79% for this same comparison. The quantitative FDG metabolic rate of 6.0 showed lower values for sensitivity (74%) and specificity (73%) for determination of tumor grade. The meta-analysis authors concluded that FDG PET is helpful in assessing soft tissue masses in recurrent and primary tumors, but performs less well in discriminating low-grade tumors from benign ones.
Franzius et al. (16) and Aoki et al. (17) both concluded that specific prospective studies in larger patient groups and groups with specific tumor histologies should be undertaken to further clarify this role of FDG PET in soft tissue sarcomas. Other meta-analyses of the available literature on the use of FDG PET in the management of patients with sarcoma showed that there is a significant ability of the technique to distinguish benign or low-grade from high-grade tumors.
The use of the FDG PET SUV is very helpful in tumor assessment, since, as a semiquantitative objective assessment, it can be used at baseline to describe the tumor metabolic activity, and in later evaluations, as a comparison for tumor progression or treatment effect. The use of the SUV for tumor assessment has met with controversy since the rapid rise in the use of FDG PET for cancer imaging. This is in large part due to valid criticisms that the tumor SUV data and conclusions from one patient series was often not comparable to those reported in another study. The source of this variability lies more in differences in the FDG PET scan procedures and techniques than with the variable itself as a valid biomarker for tumor biological behavior. Differences in patient preparation with respect to blood glucose levels, length of fast, other metabolic illnesses, FDG dose, length of FDG equilibration, the length of the scan acquisition, and method of attenuation correction are all factors that can influence the SUV determination. Recently, the U.S. National Cancer Institute Imaging Program convened a consensus panel to identify sources of irregularity in FDG PET parameters and procedures to begin establishment of its use as a valid biomarker for tumor response. The consensus opinion was published, and it presents a framework for conduct of FDG PET tumor imaging applications (18).
In sarcoma, the use of the tumor SUV maximum is recommended for reporting and understanding that the areas of highest FDG uptake correlate with tumor areas of increased cellularity and mitotic rate, and that these areas are the ones that have the most potential for aggressive behavior. It has long been known that the most biologically aggressive areas of tumor will control the overall behavior of the tumor, so the use of the FDG maximum uptake in a tumor has the advantage of describing the biological potential of the tumor most accurately.
The use of a global or average SUV for a sarcoma will often include large areas of necrosis, which, although important to identify, will interfere with the reporting of the most metabolically active areas. The technique of selecting the maximum SUV also has the advantage of being relatively independent from region of interest delineation and appears to have good reproducibility.
The use of combined PET/CT imaging has contributed to increasing the accuracy of tumor location in many cancers. There is not much literature to date on the improvement of FDG PET using emission scan images fused with CT for the diagnosis of sarcoma. A large patient group meta-analysis did not find an improvement in diagnostic sensitivity or specificity (15). In another report, magnetic resonance imaging (MRI) FDG PET image coregistration did not significantly add to regional tumor assessment for biopsy (5). With most other cancers, the use of PET/CT has only improved upon the results seen with PET alone. It is thus probable that once a larger experience is gained, that PET/CT will prove superior to PET alone in assessing sarcomas.
The addition of anatomic images to FDG PET for staging of patients with sarcoma does not yield an increase in specificity, but analysis of surgical margins and other anatomic features for surgical planning is facilitated by the use of PET and CT images that are coregistered. The anatomic precision and detail for combined functional imaging and anatomic assessment in the future are likely to be more effectively produced by the use of PET MRI coregistration techniques. There is early published literature in this area. Somer et al. (19) examined patients with soft tissue masses in the lower extremities or near the spine and used externally placed fiducials to assist with image coregistration. Although the variable spatial distortion in the MRI can make direct image overlay procedures difficult, groups are increasingly evaluating this technique.
Stay updated, free articles. Join our Telegram channel

Full access? Get Clinical Tree


