Monitoring Response to Treatment
Anthony F. Shields
Clinical imaging of many types, including x-ray, nuclear, and ultrasound techniques, is widely used to detect and stage cancer. After detection and staging are accomplished, the appropriate therapy must be chosen, and this may include a combination of surgery, radiation, chemotherapy, and biologic therapies. To evaluate the success of such treatment often requires additional imaging studies. As therapy continues to improve and more options are available for patients with cancer, the field of monitoring cancer therapy has burgeoned. For many years, the standard approach has relied on various anatomic imaging techniques to determine if the tumor has recurred, shrunk, or grown. Although cross-sectional imaging with computed tomography (CT) and magnetic resonance imaging (MRI) have become standard in evaluating treatment response, they have a number of limitations. They only evaluate the size of the lesion, not its viability, proliferative rate, or physiologic state.
The major issues that affect the sensitivity and specificity of detecting response by measuring size include delays in shrinking of dying tumors, slow growth of tumors despite unsuccessful treatment, and the persistence of fibrotic or necrotic tumors. Furthermore, new forms of therapy have methods of action that may be more cytostatic than cytocidal. Such treatments are less likely to result in rapid tumor shrinkage, making anatomic response assessment particularly challenging. Positron emission tomography (PET), with its images of many types of physiology, offers a new approach to assess tumor response. Although work in this field is still early in its exploration, studies are already demonstrating that it is becoming the new standard for some tumors and treatments. The optimal imaging approach will depend on the tumor types and treatment and when an answer regarding the success of therapy is needed.
The measurement of the results of treatment is becoming more important as more successful treatment options become available. For example, up until the past few years, it was argued that chemotherapy had little role in the treatment of unresectable non–small cell lung cancer. It has now become accepted that treatment of metastatic disease can prolong survival. Thus, determining if this treatment is successful and whether it should continue has gained importance. Knowing when to discontinue therapy is also of great importance since treatments are toxic and very costly.
Recently, new second- and third-line therapies have been approved for some patients with advanced tumors resistant to first-line treatment. This means that determining that the primary treatment has failed is more critical. New therapies, such as inhibitors of growth factors and tumor vascularity, are being used. Such agents may by cytostatic and slow tumor growth without causing extensive shrinkage in anatomic images. Finally, as therapy becomes more successful, a more common phenomenon is the persistence of fibrotic lesions, which do not contain viable tumor. All of these issues make the development of PET imaging of tumor response an area of growing interest.
The timing of response is certainly a common issue in the assessment of response. The standard approach for patients receiving cytotoxic drugs is to have CT-MRI done every 2 months. The appearance of new lesions or significant growth of old lesions signals that the treatment has failed and that the patient should be offered alternative treatments or supportive care. Even when treatment is successful, it can take months to become evident. How much benefit are patients deriving from stable disease? Recent data, especially those including cytostatic agents, suggest that stable disease provides important benefits, but it is hard to differentiate those with slowly growing tumors where the treatment is not helping from those where the treatment has induced a decrease in the tumor growth rate.
Timing of PET Imaging
A number of small studies have addressed the use of PET in the assessment of response and studied a variety of time lines after the start of therapy. Depending on the tumor type, the treatment, and the goal of the imaging study, one can choose to image as soon as therapy starts to very late after the completion of treatment (Table 8.4.1).
Table 8.4.1 Possible Times for Imaging after the Start of Therapy and Rationale | ||||||||||||||||||
|---|---|---|---|---|---|---|---|---|---|---|---|---|---|---|---|---|---|---|
| ||||||||||||||||||
In assessments done within hours to days after the start of treatment, one is often looking for immediate effects on the cellular pathways targeted by the therapy. For example, has an antiangiogenesis agent really interfered with blood flow, or has tamoxifen blocked estrogen retention in the breast tumor? At this point, such uses have generally been limited to gain a better understanding of the treatment as part of a research application. Those involved in new drug development have been particularly interested in this application (see Chapter 13).
In some cases, one is looking for immediate changes in proliferation or metabolism. This use blends into the next category—the early evaluation during the treatment—but after sufficient time to allow for a clear response of the tumor to treatment being. As previously discussed, anatomic imaging employed in this setting is often repeated 2 to 3 months after the start of treatment. Studies with PET early in the course of treatment are done to speed the assessment with the idea that those without any metabolic evidence of tumor response should stop the present therapy and consider alternate treatment (1). At this point, there are a limited number of studies that address this use. Furthermore, third-party payers do not consistently reimburse for this use at the present time, although the U.S. National Oncology PET Registry does support this use in the United States.
There have been a larger number of studies using PET at the end of a course of treatment or at later times to restage patients and to determine if residual masses represent persistent viable tumor or fibrosis. These uses have found widespread clinical applicability and are leading to the rapidly increasing use of PET in oncology. Recent U.S. government approval of payment for such uses in a number of tumor types is likely to spur this approach further.
Finally, PET is also used in the setting late after treatment to assess persistence or regrowth of the tumor compared to necrosis or fibrosis. The best examples are in the evaluation of patients after treatment for brain tumors, lymphoma, and lung cancer (see below).
Tracers for Measurement of Response
Fluorodeoxyglucose and Tumor Glycolysis
A wide variety of tracers have been tested in the measurement of tumor response. Fluorodeoxyglucose (FDG) has become the most widely used agent for use in oncology because of its easy synthesis, moderate half-life, and generally high tumor retention. As a result, it is very useful for the detection and staging of cancer, as well as determining if the tumor is responding to treatment. It has been commercially produced and centrally distributed, thus allowing for centers without cyclotrons to have ready access to the tracer. In many clinical PET centers it is the only tracer used in cancer, attesting to its profound importance in PET.
As with any tracer, FDG does have its limitations. The greatest limitation is that not all tumors readily retain FDG. In some cases this reflects the fact that tumors may have mucinous or cystic areas or a high degree of fibrosis or differentiation, all of which may have limited FDG retention. Although the rapid renal excretion of unmetabolized FDG is generally an advantage, the tracer accumulation in the bladder has limited its use in the lower pelvis. This has made assessment of prostate and bladder cancers more difficult. The introduction of iterative reconstruction techniques has helped in this regard by limiting streak artifacts that could obscure tumors.
Methionine and Protein Synthesis
The next most commonly reported tracer in the assessment of tumor response is carbon-11 ([11C])-L-methionine. Its easy synthesis, a one-step process using methyl iodide, allows for the production of large quantities in PET centers with cyclotrons. It is readily retained in many tumors and provides high-contrast images in many sites. In vitro studies demonstrated that there are more rapid declines in protein
synthesis than in glucose retention when treatment is successful (2). This has led to a number of promising clinical trials with this agent.
synthesis than in glucose retention when treatment is successful (2). This has led to a number of promising clinical trials with this agent.
Limitations in the use of labeled methionine include the short half-life of [11C] and the requirement of a cyclotron on site. Although it was originally intended to provide a relative measure of protein synthesis, it has become clear that its retention also reflects the transmethylation reaction and its early signal is related to perfusion and transport into the cancer cell. Because of the complex pathways available for methionine retention, it is difficult to provide a simple model of kinetic analysis. Increased uptake of methionine in the pancreas, due to the high level of protein synthesis, limits its use in that organ. Other protein synthesis tracers continue to be developed, but there have been limited clinical studies to date.
Thymidine and Nucleoside Analogues
One of the central problems associated with cancer is the uncontrolled growth of tumor cells. The study of cell proliferation in the laboratory has been at the heart of cancer research for decades. In the clinic, measuring tumor growth has generally relied on serial size determinations, as previously discussed. More direct measurements of growth parameters have required biopsies to look for histologic evidence of proliferation (mitotic figures), nuclear antigens associated with growth, and flow cytometric measurements (S-phase fraction). In some clinical studies, direct measurements of growth have been done by injecting patients with 3H-thymidine prior to biopsy. The requirement for tissue samples has severely limited the studies one can do with such an approach.
Work on noninvasive imaging of cell proliferation has focused on the use of labeled nucleosides, in particular with thymidine and it analogues. The metabolic restriction of incorporation of thymidine into DNA, rather than RNA, had lead to its routine use in the laboratory. Thymidine has been labeled with [11C], both in the methyl group and ring-2 position. Although a small number of trials have demonstrated the utility of labeled thymidine in clinical studies, the short half-life of [11C] and relatively difficult synthesis of the tracers and its metabolism have limited its widespread use. This has lead investigators to begin to explore an number of analogues that can be labeled with fluorine-18 (18F) such as 3′-fluorothymidine (FLT) and iododeoxyuridine, which can be labeled with iodine-124 (124I) (3,4).
Blood Flow
PET has been widely used to measure blood flow in the brain and heart. Initial work relied on the use of [15O]-labeled water, and many academic PET centers became very adept at using this very short half-life (2 minutes) radiotracer. Repeated brain activation studies have been done allowing just a few minutes for decay between injections.
The recent introduction of tumor antivascular agents into clinical trials has led to a growing interest in the use of [15O]-water blood flow studies. One may not see clear evidence of tumor shrinkage with such agents; therefore, primary disruption of the blood supply is eagerly sought by investigators to demonstrate efficacy.
The optimal dose of the antivascular agents may best be determined by measuring the lowest dose needed to decrease tumor flow. Early trials have found changes in tumor blood flow 30 minutes after the injection of agents such as Combretastatin (A4-phosphate Prodrug; OXiGENE Inc, Waltham, Massachusetts) (5). PET provides data complementary to that obtained with MRI (dynamic contrast enhanced), which measures a combination of permeability and flow. Although it is not likely that this will become a common clinical use, PET is playing a valuable role in helping to develop these new drugs.
Labeled Drugs
One particularly interesting application of PET is in the evaluation of labeled anticancer agents. The injection of such labeled compounds allows one to measure the clearance from the blood, as well as the uptake and retention into tumors. For example, studies have been done comparing the uptake of nitrogen-13 ([13N])-cisplatin into brain tumors and have demonstrated that an intra-arterial injection results in higher tumor uptake than simple intravenous delivery (6).
The uptake of labeled drugs has also been used to predict if a patient is likely to be susceptible to a given agent. That is, low uptake and retention may predict resistance to the drug. This has been demonstrated using [18F]-5-fluorouracil, an agent commonly used to treat patients with colorectal cancer (7). In patients with liver metastases those with low uptake were uniformly nonresponders, while the higher the uptake the greater the likelihood of response.
Overall the number of labeled drugs has been small, and although such compounds are useful in measuring the pharmacology of the drugs, they are generally not useful in monitoring response. Although labeled drugs may provide important information to understand the drugs’ distribution and possibly predict therapeutic outcome, there are limited uses so far in monitoring response to treatment.
Quantitation of Tumor Measurements with PET
One of the critical issues in using PET to measure treatment response is the issue of how to best quantitate the imaging results (8,9). When FDG PET is used in diagnostic studies many centers routinely evaluate the images visually to determine if there are areas of activity with more intense uptake compared to the background. A similar approach is used in the routine staging of patients. This is often supplemented with the semiquantitative evaluation using the standardized uptake value (SUV), with untreated malignant lesions having a value well over 2.0 to 3.0.
When evaluating the response to therapy more accurate quantitation gains added importance, for although a tumor may still be visible, significant declines in tumor metabolism may indicate a favorable response (1). This has led to the use of kinetic analysis of image data obtained dynamically along with blood input curves. This allows one to measure overall flux of the tracer into tumors along with the individual rate constants. The relative utility of these approaches depends on the clinical setting and is likely to vary with each tumor and treatment.
For the simple answer of determining if a viable tumor is present at the end of therapy or late after the completion of treatment, simple visual assessment has been successfully employed in some studies (10). In such cases persistent tumor may be reported if activity above background for the surrounding tissues is noted. A similar approach has been employed in determining if recurrence is present rather than necrosis.
When one wishes to obtain information immediately after the start or early in the course of therapy, more quantitative approaches
are more likely to be of value (11). At this point the relative merits of using semiquantitative measurements of SUV and more detailed measurements of kinetic parameters are still open to debate. Some studies have demonstrated benefits for both approaches (12). One issue is clearly the reproducibility of such measurements. Although there are limited data, most trials suggest that repeated measurements made without intervening treatment will vary from 10% to 20% (13). Until the best technique is determined, it has been suggested the data be obtained in a standardized way allowing groups to compare their results and recalculate response values. To this end a recent National Cancer Institute conference has developed recommendations on how to obtain the PET scan and measure the SUV (14).
are more likely to be of value (11). At this point the relative merits of using semiquantitative measurements of SUV and more detailed measurements of kinetic parameters are still open to debate. Some studies have demonstrated benefits for both approaches (12). One issue is clearly the reproducibility of such measurements. Although there are limited data, most trials suggest that repeated measurements made without intervening treatment will vary from 10% to 20% (13). Until the best technique is determined, it has been suggested the data be obtained in a standardized way allowing groups to compare their results and recalculate response values. To this end a recent National Cancer Institute conference has developed recommendations on how to obtain the PET scan and measure the SUV (14).
Table 8.4.2 Brain Tumors and PET Evaluation after Therapy | ||||||||||||||||||||||||||||||||||||||||||||||||||||||||||||||||||||||||||||||||||||||||
|---|---|---|---|---|---|---|---|---|---|---|---|---|---|---|---|---|---|---|---|---|---|---|---|---|---|---|---|---|---|---|---|---|---|---|---|---|---|---|---|---|---|---|---|---|---|---|---|---|---|---|---|---|---|---|---|---|---|---|---|---|---|---|---|---|---|---|---|---|---|---|---|---|---|---|---|---|---|---|---|---|---|---|---|---|---|---|---|---|
| ||||||||||||||||||||||||||||||||||||||||||||||||||||||||||||||||||||||||||||||||||||||||
PET Evaluation of Tumor Response: Clinical and Research Experience
Brain Tumors
The use of PET in oncology began with the study of brain tumors. There have been a number of studies over the years that have examined the course of treatment with surgery, chemotherapy, and radiation and the changes seen using PET (a sample of such studies is seen in Table 8.4.2). In one of the earliest studies looking at response at the end of treatment Ogawa et al. (15) demonstrated that FDG retention decreased by 1 month after chemoradiotherapy, but they did not see declines in blood flow or oxygen consumption.
For a long time the primary use of PET in oncology was to determine disease persistence versus radionecrosis in patients late after therapy for astrocytomas (16). This is useful in determining patient prognosis and deciding if further surgery is indicated. FDG PET has also been used after radiosurgery for brain tumors and brain metastases, but for the most part imaging has been done months after treatment. FDG PET was found to be useful in assessing the remission status and treatment outcome (17,18). The limitations of this approach are the high FDG retention in the normal brain, which can make interpretation difficult at times, and the limited therapeutic options available with each diagnosis.
On the other hand, a rapid increase in tumor activity was seen 1 day after treatment with stereotactic radiosurgery, but this declined by 1 week later (19). The early increase in tumor metabolism on the day after treatment, often called a flare reaction, was shown to correlate with survival in patients treated with carmustine (20). Another pilot study imaged patients 4 hours after radiosurgery and found that the FDG phosphorylation rate rapidly increased in these patients, and this may be a predictor of the ultimate response (21).
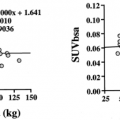
 Figure 8.4.1. Treatment results in patients with high-grade gliomas treated with temozolomide. The change in metabolic rate of fluorodeoxyglucose (MRFDG) in the highest uptake areas of the tumor was compared to objective response at 8 weeks. PET was able to separate responders from nonresponders (P <.02). (Adapted from Brock CS, Young H, O’Reilly SM, et al. Early evaluation of tumour metabolic response using [18F]fluorodeoxyglucose and positron emission tomography: a pilot study following the phase II chemotherapy schedule for temozolomide in recurrent high-grade gliomas. Br J Cancer 2000;82(3):608–615, with permission.) |
As new drugs are developed for this disease, PET is gaining a role in evaluating response to therapy. In a trial temozolomide was given to nine patients with gliomas and FDG PET repeated 14 days after the start of therapy (12). The change in metabolic rate in the regions with high focal tumor uptake was found to correlate with the anatomic response at 8 weeks (Fig. 8.4.1). This analysis required the study of those areas of tumor with high focal uptake rather than the whole tumor. Although SUV changes also correlated with response, the metabolic rate parameters were a better measure of treatment outcome. On the other hand, a study using a cytostatic agent, imaging done about 7 weeks after the start of treatment, did not find a correlation between outcome and FDG retention (22). This emphasizes the point that the best imaging approach may depend on the type of treatment.
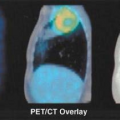
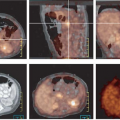
 Figure 8.4.2. Images of a patient with recurrent glioma as imaged with (A) magnetic resonance imaging, (B) fluorodeoxyglucose PET, and (C) [11C]-thymidine (TdR) PET imaged from 20 to 60 minutes. D: Parametric image of thymidine flux constant. The later image best shows the area of recurrent tumor in the area posterior to the previous resection. (From Eary JF, Mankoff DA, Spence AM, et al. 2-[C-11]thymidine imaging of malignant brain tumors. Cancer Res 1999;59(3):615–621, with permission.) |
Although FDG has been the primary tracer used for PET studies of the brain, methionine has also been used in some trials. For example, patients with low-grade (13) or anaplastic (1) astrocytomas were imaged with methionine before and 3, 6, 12, or more than 21 months after radiation (23). The SUV ratio in tumor to normal brain rose significantly in those who died of progressive disease, was stable in those alive with disease, and declined slightly in those without evidence of disease. Imaging with methionine was also shown to be more sensitive and specific after radiosurgery, 78% and 100%, respectively (24). One trial comparing FDG and methionine imaging was done in 30 patients with possible recurrence of brain tumors. Although the two approaches were found to be complementary, methionine was better able to delineate the tumors with increased uptake noted in 93% compared with only 57% with FDG (25). Although methionine appears to be a promising tracer, because of its short half-life it is still not readily available.
The high background of normal glucose utilization has made the use of FDG problematic in trying to determine if patients have small areas of persistent or recurrent disease. Tracers of tumor proliferation have also been developed to assist in monitoring brain tumor therapy including thymidine and its analogues. Agents such as thymidine, FLT, or iododeoxyuridine may assist in this assessment (26,27) (Fig. 8.4.2).
Lymphoma
FDG PET imaging of lymphoma is already done clinically in many centers. It is routinely used in staging, but its greatest role at present is in the assessment of treatment response at the end of therapy. Chemotherapy can be curative in a majority of patients with both Hodgkin’s lymphoma and non-Hodgkin’s lymphoma. A major problem in these patients is that they are often left with residual masses at the end of chemotherapy, and this may represent persistent disease or fibrosis. Knowledge of persistent disease is critical since alternate
treatments are available, including radiation, other chemotherapies, and even high-dose therapy with stem cell rescue. Gallium-67 (67Ga)-scintigraphy was used to assist in this problem but has been variable in its acceptance and has significant limitations in the abdomen. Furthermore, trials have demonstrated that FDG PET is superior to gallium single-photon emission computed tomography (SPECT) in the staging of lymphoma (28,29). A number of studies have been completed that demonstrate the utility of FDG PET to evaluate patients during and at the end of their treatment (Table 8.4.3).
treatments are available, including radiation, other chemotherapies, and even high-dose therapy with stem cell rescue. Gallium-67 (67Ga)-scintigraphy was used to assist in this problem but has been variable in its acceptance and has significant limitations in the abdomen. Furthermore, trials have demonstrated that FDG PET is superior to gallium single-photon emission computed tomography (SPECT) in the staging of lymphoma (28,29). A number of studies have been completed that demonstrate the utility of FDG PET to evaluate patients during and at the end of their treatment (Table 8.4.3).
Table 8.4.3 Lymphoma and PET Evaluation after Chemotherapy | ||||||||||||||||||||||||||||||||||||||||||||||||||||||||||||||||||||||||||||||||||||||||||||||||||||||||||||||||
|---|---|---|---|---|---|---|---|---|---|---|---|---|---|---|---|---|---|---|---|---|---|---|---|---|---|---|---|---|---|---|---|---|---|---|---|---|---|---|---|---|---|---|---|---|---|---|---|---|---|---|---|---|---|---|---|---|---|---|---|---|---|---|---|---|---|---|---|---|---|---|---|---|---|---|---|---|---|---|---|---|---|---|---|---|---|---|---|---|---|---|---|---|---|---|---|---|---|---|---|---|---|---|---|---|---|---|---|---|---|---|---|---|
| ||||||||||||||||||||||||||||||||||||||||||||||||||||||||||||||||||||||||||||||||||||||||||||||||||||||||||||||||
Although initial studies concentrated on imaging patients at the conclusion of treatment, Romer et al. (30) imaged patients before and at 1 and 6 weeks after the start of therapy in 11 patients with non-Hodgkin’s lymphoma (Fig. 8.4.3). When measured using SUV quantitation, they noted a 60% decrease in tumor FDG uptake at 1 week and an average overall decline of 79% by 6 weeks. Although the decline at 1 week was significant, there was too much overlap between patients attaining a long-term complete response and those who relapsed to be of routine clinical use. In analyzing the 6-week images, an SUV cutoff of 2.5 was able to differentiate those maintaining a complete response (CR) from failing patients with an 81% accuracy (Fig. 8.4.4). In their study all three patients with a high SUV relapsed. The problem in assessment came from patients with apparent CR by PET who went on to relapse (two patients). This is an expected limitation with any imaging technology since it will fail to detect microscopic disease that can lead to eventual relapse.
In more recent studies, patients with non-Hodgkin’s lymphoma were imaged after two to three cycles of chemotherapy, and the accuracy of response assessment varied from 66% to 82% (31,32). In the study by Mikhaeel et al. (32) the 5-year progression-free survival was 88.8%, 59.3%, and 16.2% in the patients with PET negative, minimal residual uptake, and PET positive groups, respectively. Another study found that those with negative and positive PET scans achieved a complete remission 83% and 58% of the time, respectively (31). In those with positive scans there was a 43% 2-year event-free survival. Overall, these studies demonstrate that those with positive scans early in the course of treatment generally do poorly, but it is still not clear that if one switched treatment that the outcome would be improved. This must await future trials.
A recent study of 108 patients with Hodgkin’s lymphoma repeated FDG PET after two cycles of ABVD (doxorubicin, bleomycin, vinblastine, dacarbazine) chemotherapy (33). The overall accuracy of PET in response assessment was 95%, but more
importantly only 2 of 20 (10%) who had positive PET scans after cycle two remained in remission. Again, further work is needed to determine if alternate therapy should be studied in this situation.
importantly only 2 of 20 (10%) who had positive PET scans after cycle two remained in remission. Again, further work is needed to determine if alternate therapy should be studied in this situation.
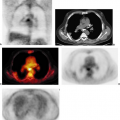
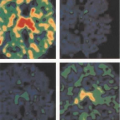
 Figure 8.4.3. A (top row): Patient with high-grade NHL and a large parahilar lesion. This patient had a complete response based on PET and remained in complete response 15 months later. B (bottom row): A patient with extensive mediastinal involvement with high-grade lymphoma. Although the patient had a partial response to therapy, a lesion with an standardized uptake value of 4.1 was still visible at day 42. The patient relapsed during the third course of chemotherapy. Images were obtained pretreatment and days 7 and 42 after the start of therapy. fluorodeoxyglucose, FDG; TdR, [11C]-thymidine flux. (From Romer W, Hanauske A, Ziegler S, et al. Positron emission tomography in non-Hodgkin’s lymphoma: assessment of chemotherapy with fluorodeoxyglucose. Blood 1998;91(12):4464–4471, with permission.) |
More work has been done in imaging patients after the completion of therapy. In a study of 37 patients with HD, imaging with FDG PET at a mean of 10 weeks after treatment had a 74% accuracy in predicting relapse (34). This compared to the accuracy of 32% with CT. Only 1 of 28 patients with a negative PET scan relapsed, while 12 of 22 patients with positive PET scans did not relapse. Some patients had radiation and repeat scans done after chemotherapy. If one takes into account only the PET scans obtained after completing all therapy, the accuracy was 85% and there were only five false-positive scans.
 Figure 8.4.4. Comparison of fluorodeoxyglucose (FDG) PET and ultimate relapse or complete response (CR) in patients undergoing chemotherapy for non-Hodgkin’s lymphoma. PET measurements were obtained as SUVmax (circles) and metabolic rate for FDG (MRFDG) (squares). (Adapted from Romer W, Hanauske A, Ziegler S, et al. Positron emission tomography in non-Hodgkin’s lymphoma: assessment of chemotherapy with fluorodeoxyglucose. Blood 1998;91(12): 4464–4471, with permission.) |
Jerusalem et al. (35) studied 19 patients with Hodgkin’s lymphoma and 35 with non-Hodgkin’s lymphoma in the posttreatment evaluation of patients 1 to 3 months after chemotherapy. All six patients with positive posttreatment PET scans progressed as did 8 of 48 patients (17%) with negative scans. The overall accuracy of PET was 85% in predicting relapse, compared with 67% for CT. Although all patients with positive PET relapsed, only 26% (5 of 19) of patients with positive CT and negative PET progressed, and 10% of those with both negative PET and CT progressed.
Related posts:
Stay updated, free articles. Join our Telegram channel

Full access? Get Clinical Tree


