Standardized Uptake Values
Richard L. Wahl
Positron emission tomography (PET) and PET/CT (computed tomography) are inherently quantitative techniques. Properly performed attenuation-corrected images from well-calibrated scanners accurately reflect radioactivity concentrations in each voxel of the image. There is, admittedly, variability due to statistical noise, meaning larger regions of interest are likely more statistically robust than tiny regions. Although partial volume effects result in underestimation of the radiotracer uptake in small “hot” lesions, the quantitative capabilities of PET are by now quite well understood and for objects over about twice the size as the reconstructed resolution of the PET images (typically objects of 2 cm and larger), the radioactivity concentration in the lesion is accurately represented. This unique quantitative capability of PET images was significantly drawn upon in the preceding chapter on data analysis and processing. Accurate quantitation of radioactivity by PET is required for kinetic modeling of dynamic PET images to provide information about varying aspects of biological processes. PET coupled with kinetic modeling methods is a powerful research tool and its applications are discussed in several locations in this text, including the preceding chapter, the oxidative metabolism (Chapter 11.3), and several others. Kinetic modeling methods can be quite complex, requiring a variety of simplifying assumptions, are subject to variability in part due to the region of interest placement, which requires long dynamic acquisitions and can be degraded by motion, and are only relatively infrequently used in the clinical practice of PET imaging.
A practical challenge with kinetic modeling approaches are that they require the patient to be in the PET scanner for moderately long periods of time to allow for dynamic imaging to be acquired to determine the time activity curves in a variety of tissues. For carbon-11 (11C) or fluorine-18 (18F) images, 60 to 90 minutes of data acquisition, from the time of tracer injection until well into the radioactive decay of the tracers, is required as an imaging period. This length of acquisition is typically not a problem in the research setting, although patient motion is clearly a concern and will degrade, if uncorrected, in such modeling. But the long acquisition times are additionally concerning as they require valuable scanner time. Further, the kinetic modeling approaches are far from routine. Thus, modeling is used much more in research than in routine clinical practice. In clinical practice, the logistical requirements of shorter imaging periods, greater resistance to patient motion, along with qualitative methods of analysis or more simple quantitative methods are much more commonly applied.
In most practice settings, qualitative analysis is the main approach to PET image interpretations, including common oncologic, cardiac, and brain fluorodeoxyglucose (FDG) PET imaging approaches. Qualitative imaging has the inherent challenge of being user, or interpreter, dependent. Readers can apply differing thresholds for positivity and negativity. Although several studies have shown reasonably good reproducibility in qualitative interpretations for both diagnosis and treatment response assessment, these data are limited (1,2). Thus, there is typically a desire for image quantitation. The simple quantitative measurement, the standardized uptake value (SUV), is used in several situations and is growing in application as more use of PET in early treatment response assessment occurs. Some have called the SUV a semiquantitative parameter. This is probably linguistically incorrect since it is a numerical figure and it is really a quantitative metric (3). This parameter is available as a function on virtually any PET/CT device and can be applied to a wide variety of radiotracers. This measurement is used most commonly in the assessment of FDG PET oncology images, and the discussion in this chapter focuses on FDG PET, for the most part.
The SUV value has been called the differential absorption ratio, but this term is not as commonly used as SUV (4). The SUV is defined as:
SUV = [mCi/mL (decay corrected) in tissue]/[mCi of tracer injected into the patient/body weight in grams].
The value becomes unitless if it is assumed that 1 g of body weight is equal to 1 mL. The SUV calculated in this manner is also known as SUVbw, where bw represents body weight.
The SUV would equal 1 if the injected tracer was completely and uniformly distributed throughout the body after injection and if there was no excretion. In fact, the most commonly used radiotracer for clinical PET is FDG, which does not distribute evenly throughout the body. In the fasting state, little FDG goes to fat or muscle, so these tissues have low SUVs, less than 1, in most instances. By contrast, liver and blood SUVs are often higher than 1.
In general, cancers have elevated glucose metabolism and concordant increases in FDG uptake versus background tissues. Thus, the higher the SUV, in simplistic terms, the more probable it is that a given lesion is malignant. The SUV can be helpful and in some studies has been able to separate malignant from benign tissues quite well (e.g., in lung nodules with an SUV higher than 2.5, cancer is more probable than in low SUV lesions). High SUV may be associated with more aggressive tumors, as well as with sarcoma, lymphomas, and some lung cancers. Similarly, the SUV can be very helpful in a given patient in monitoring the response of a cancer to therapy.
If the patient has been fed, or insulin is present, the fat and muscle can have more FDG uptake due to the activation of their insulin-sensitive glucose transporters (5). In general, FDG PET for tumor imaging is performed in the fasting state, so high muscle uptake is not typically too problematic. Since the FDG reaches the tumor from the
blood stream, high activity levels in muscle can potentially divert FDG from reaching the tumor and lower the tumor SUV. Thus, uniform patient preparation is very important. Chapter 8.1 of this text additionally details the importance of uniform preparation of patients for PET studies. For oncology studies, a metabolic state of low serum glucose levels and low serum insulin levels is most desirable. This is typically achieved with several hours, commonly 4 or more, of fasting. Some advocate the last meal before the PET scan be a high protein, low carbohydrate meal. Avoiding intense exercise for 24 or more hours prior to PET is probably reasonable as well. Some of the considerations for a reproducible PET study were reported in a recent National Cancer Institute workshop document and in the introductory chapter on tumor imaging in this text, Chapter 8.1 (6).
blood stream, high activity levels in muscle can potentially divert FDG from reaching the tumor and lower the tumor SUV. Thus, uniform patient preparation is very important. Chapter 8.1 of this text additionally details the importance of uniform preparation of patients for PET studies. For oncology studies, a metabolic state of low serum glucose levels and low serum insulin levels is most desirable. This is typically achieved with several hours, commonly 4 or more, of fasting. Some advocate the last meal before the PET scan be a high protein, low carbohydrate meal. Avoiding intense exercise for 24 or more hours prior to PET is probably reasonable as well. Some of the considerations for a reproducible PET study were reported in a recent National Cancer Institute workshop document and in the introductory chapter on tumor imaging in this text, Chapter 8.1 (6).
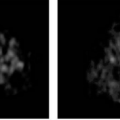
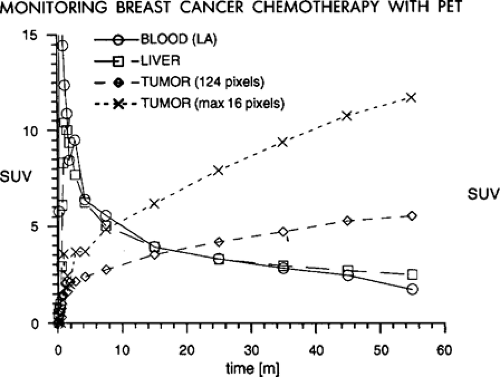 Figure 6.1. The standard uptake value (SUV) in normal tissues declines in the 60 minutes postinjection. The SUV in the tumor rises over the same time period. The SUV in the small region of interest (SI) (4 × 4) is much higher than the SUV in the larger region of interest. (From Wahl RL, Zasadny K, Helvie M, et al. Metabolic monitoring of breast cancer chemohormonotherapy using positron emission tomography: initial evaluation. J Clin Oncol 1993;11:2101–2111, with permission.) |
It is very important to have a consistent time from the injection of the radiotracer until the imaging is performed, if SUV values are to be reproducible from study to study. As is shown in Fig. 6.1 in a patient with untreated breast cancer injected with FDG and imaged continuously over the thorax for 60 minutes, the tumor SUV rises continuously through the first hour of imaging (7). Indeed, it has been shown that in most untreated tumors, the SUV continues to rise through 60 minutes postinjection and can continue to rise though 90 minutes or more postradiotracer injection (6,7). One report showed tumor concentrations of [18F]-FDG did not reach a plateau within the 90 minutes of imaging in any of the pretreatment studies and only in one case posttreatment. Further, the average time to reach 95% of the plateau value pretreatment was 298 +/- 42 minutes (range: 130 to 500 minutes); in posttreatment, it was 154 +/- 31 minutes (range: 65 to 240 minutes). The difference between the plateau drug uptake ratio and the 60-minute value was 46% +/- 6% pretreatment and 17% +/- 5% posttreatment (8). Thus, if one day a patient has a PET scan at 45 minutes postinjection and another day has a scan at 90 minutes postinjection, it is very probable that the tumor SUV will be much higher on the study performed at the later time point, even if there has been no interval treatment (Fig. 6.1). This is in considerable contrast to the tracer behavior in normal tissues, as most of them, such as liver, blood, lung, muscle, and so forth fall over the same period of time (7). So, tumor/background ratios generally increase with time, and this must be realized if there are major differences in the timing of the PET scans from day to day. Without such controls, some have referred to the SUV as a “silly useless value” (9). However, it was also shown that if the time from injection to imaging is kept constant, the SUV values are very consistent from study to study on test retest imaging (10). Thus, for determining SUV it is for critical patients to have the same time from injection until imaging. With such controls the SUV may be more of a “supremely useful value.”
Related posts:
Stay updated, free articles. Join our Telegram channel

Full access? Get Clinical Tree


