Scan Parameters and Image Optimization
Introduction
In this chapter, we will discuss all the important parameters in MR imaging that the operator can control and adjust. We will then see how these changes influence the image quality. Every radiologist is comfortable with a particular set of techniques; therefore, “custom-made” techniques can be achieved only if the radiologist is aware of the parameters and trade-offs involved.
Primary and Secondary Parameters
Primary parameters are those that are set directly: 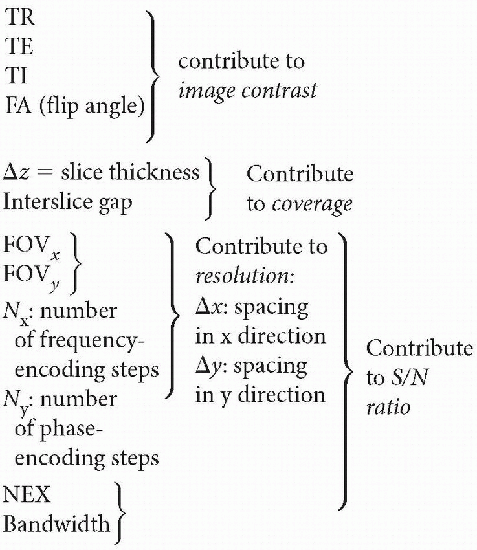
From the primary parameters above, we can get the secondary parameters (which are also used to describe the image):
Scan time
Coverage
Resolution
Image contrast
Unfortunately, optimization of these parameters may involve some trade-offs. To gain some advantage with one parameter, we might have to sacrifice another parameter. Let’s start out with the concept of signal-to-noise ratio (SNR).
Signal-to-Noise Ratio. What we want is signal. What we don’t want is noise. Although we can’t completely eliminate noise, there are ways to maximize the SNR. SNR is given by
which makes sense because Ny × NEX × Ts is the total time the machine is “listening” to the spin echoes.
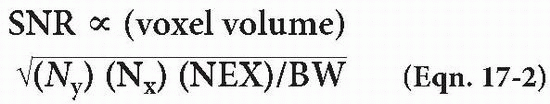
Therefore, SNR depends on
Voxel volume = Δx · Δy · Δz
Number of excitations (NEX)
Number of phase-encoding steps (Ny)
Number of frequency-encoding steps (Nx)
Full bandwidth (BW)
Let’s go through each parameter and see how SNR is affected.
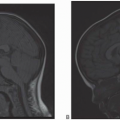
Voxel Volume
If we increase the voxel size, we increase the number of proton spins in the voxel and, therefore, increase the signal coming out of the voxel (Fig. 17-1). The voxel volume is given by Voxel volume = Δx · Δy · Δz where Δx = pixel size in the x direction, Δy = pixel size in the y direction, and Δz = slice thickness.
NEX (Number of Excitations or Acquisitions). NEX stands for the number of times the scan is repeated. Let’s say we have two signals (S1 and S2), corresponding to the same slice (with the same Gy). There is constant noise (N) associated with each signal (N1 = N2 = N). If we add up the signals (assuming S1 = S2 = S), we get S1 + S2 = 2S However, if we add up the noise, we get
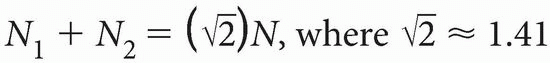
This formula does not make sense at first glance. Why do we get  N and not 2N? The answer has to do with a somewhat complicated statistical concept and the so-called random Brownian motion theory, which deals with the spectral density of the noise.
N and not 2N? The answer has to do with a somewhat complicated statistical concept and the so-called random Brownian motion theory, which deals with the spectral density of the noise.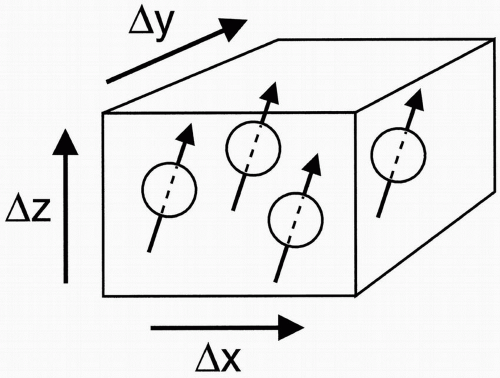 |
In a simplistic approach, think of the noise as the variance (σ2) of a Gaussian distribution (σ = standard deviation). Then, for the sum of the two noise distributions, the variance is additive and given by σ12 + σ22 = σ2 + σ2 = 2σ2 from which the standard deviation is calculated to be
This is where the  factor comes from. However, you don’t need to know the underlying math—you just need to understand the concept. In summary:
factor comes from. However, you don’t need to know the underlying math—you just need to understand the concept. In summary:
The resulting signal will be twice the original signal. The resulting noise, however, will be less—it will be the square root of 2 multiplied by the noise  N.
N.
N.In other words, if we increase the number of acquisitions by a factor of 2, the signal doubles and noise increases by  , for a net 2/
 =
=  ; thus, SNR increases by a factor of
  .
.
, for a net 2/ = ; thus, SNR increases by a factor of .
Think of the NEX as an averaging operation that causes “smoothing” and improvement in the image quality by increasing the signal to a greater degree (e.g., factor 2) relative to the increase in the noise (e.g., factor  ). As another example, increasing NEX by a factor of 4 results in an increase of signal by 4 and an increase of noise by
  or 2. Thus, SNR increases by 4/2 or twofold.
). As another example, increasing NEX by a factor of 4 results in an increase of signal by 4 and an increase of noise by or 2. Thus, SNR increases by 4/2 or twofold.Ny (Number of Phase-Encoding Steps). The same concept holds for Ny. That is, similar to NEX, there is a 41% ( ) increase in SNR when Ny is doubled. As with NEX, when the number of phase-encode steps doubles, signal doubles and noise increases (randomly) by
  (for a net
  increase in SNR).
) increase in SNR when Ny is doubled. As with NEX, when the number of phase-encode steps doubles, signal doubles and noise increases (randomly) by (for a net increase in SNR).Bandwidth. An inverse relationship exists between BW and SNR. If we go to a wider bandwidth, we include more noise, and the SNR decreases. If we decrease the bandwidth, we
allow less noise to come through, and the SNR increases.
allow less noise to come through, and the SNR increases.
↓ BW → ↑ SNR To be exact, decreasing the BW by a factor of 2 causes the SNR to improve by a factor of  .
.
.In general, decreased bandwidth causes the following:
Increased SNR
Increased chemical shift artifact (more on this later)
Longer minimum TE (which means less signal due to more T2 decay). Remember that Bandwidth = 1/ΔTs = Nx/Ts
Therefore, a longer sampling time (Ts), which is necessary for a decreased bandwidth, results in a longer minimum TE. With a long TE, increased T2 dephasing results in decreased signal. However, the contribution from reduced noise due to a lower bandwidth outweighs the deleterious effect of reduced signal due to greater T2 decay from increased TE.
Decreased number of slices. This decrease is caused by the longer TE. Remember, number of slices = TR/(TE + Ts/2 + To) where Ts is the total sampling (readout) time and To is the “overhead” time. A narrower bandwidth is usually used on the second echo of a T2-weighted dual-echo image because, with the second echo, we have a longer TE and we are able to afford the longer sampling time. On the first echo, however, we can’t afford to use a narrower bandwidth because we can’t afford to lengthen the TE. However, we probably don’t need the smaller bandwidth anyway because we already have enough SNR on the proton density-weighted first echo of a long T2, double-echo image. A typical Ts for a 1.5-T scanner is 8 msec, resulting in a BW (for a 256 matrix) of BW = Nx/Ts = 256/8 = 32 kHz = ± 16 kHz = 125 Hz/pixel
Note that BW can be described as “full bandwidth” (32 kHz in example above), ± the Nyquist frequency (which is ± 16 kHz above and defines the FOV) or “bandwidth per pixel” (which is unambiguous if you forget the ±).
A typical “variable bandwidth” option includes
A wide bandwidth (±16 kHz) on the first echo, and
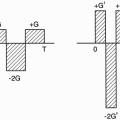
Question: How does the gradient affect the BW?
Answer: Recall from Chapter 15 that the field of view (FOV) is given by FOV = BW/γGx or Gx = BW/γFOV
SNR in 3D Imaging
In 3D imaging, we have the same factors contributing to SNR, plus an additional phaseencoding step in the z direction (Nz):
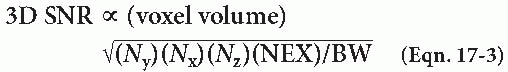
From this equation, you can see why SNR in 3D imaging is higher than that in 2D imaging. Specifically,
Voxel size
Total sampling time
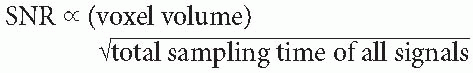
Sampling time (Ts) is the time that we sample the signal. Therefore, it makes sense that the more time we spend sampling the signal, the higher the SNR will be. Let’s look again at the formula for SNR (in 2D imaging):
We know that Ny is the number of phase-encoding steps, which is the number of times we sample the echo corresponding to a particular phaseencoding gradient Gy, and that NEX is the number of times we repeat each phase-encoding step. In essence, the factor T = Ts · Ny · NEX is the total sampling time of all the echoes received for a particular slice. Thus,
In summary, SNR can be increased by doing the following:
Increasing TR
Decreasing TE
Using a lower BW
Using volume (i.e., 3D) imaging
Increasing NEX
Increasing Ny
Increasing Nx
Increasing the voxel size
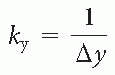
Resolution. Spatial resolution (or pixel size) is the minimum distance that we can distinguish between two points on an image. It is determined by Pixel size = FOV/number of pixels ↑ Ny → better resolution If we increase the number of phase-encoding steps, what happens to SNR? Obviously, better resolution usually means poorer SNR. However, if we look at Equation 17-2, it appears that by increasing Ny, the SNR should increase! What’s the catch? The catch is, we are keeping the FOV constant while increasing Ny. Take, for example, Pixel size along y-axis = Δy = FOVy


Related posts:
Stay updated, free articles. Join our Telegram channel
Full access? Get Clinical Tree
