When diffuse disease is infiltrative it spreads throughout an entire organ. Depending on the progression of the disease, changes in the appearance of the organ’s parenchyma range from subtle to severe. In this case, the liver was obviously enlarged and there were subtle changes in the appearance of the parenchyma.
• After the scan:
• Describe any difference in echo pattern appearance using sonographic terminology to provide the interpreting physician with the comprehensive details of the study.
• All pathology visualized by ultrasound in some way disrupts the normal echo pattern of the organ or structure involved and may also alter its shape, size, contour, position, or textural appearance.
• Key findings can be used to help detect parenchymal changes of an organ. When the normal homogeneous (uniform) texture of organ parenchyma is interrupted by disease, the parenchyma assumes an irregular or heterogeneous pattern. The changes may be diffuse disease—either infiltrative throughout the organ or focal in a specific area; or the changes may be localized disease, consisting of single or multiple masses.
• Infiltrative diffuse disease:
▪ Spreads throughout an entire organ.
▪ May appear subtle to very obvious depending on the severity and progression of the disease. Look for characteristic changes in overall organ echo texture, size, shape, and position, and any associated complications with adjacent structures (Figure 3-1). With advanced diffuse disease, the appearance of the parenchyma may also be interrupted with multiple necrotic or blood filled spaces. Each diffuse disease has its own distinctive criteria that may include all or only some of these characteristics.
• Focal diffuse disease:
▪ Look for isolated areas with a change in organ echo texture, size, and possible displacement of adjacent structures (Figure 3-2).

This image shows how focal diffuse disease disrupts the normal appearance of organ parenchyma. Observe the multiple lesions. Notice how the size of the liver appears enlarged, displacing the right kidney posteriorly.
• Localized disease (masses):
▪ Look for a mass or multiple masses, which are circumscribed to a specific area. A mass may be classified according to its composition as solid (all tissue), cystic (fluid filled), or complex (tissue and fluid) (Figure 3-3).
• Certain disease processes are accompanied by the formation of calculi, which interrupt the normal appearance of an organ. Typically, calculi or “stones” are distinguished by the fact that they impede (reflect, absorb, stop, decrease) sound waves, creating an echogenic or bright anterior surface and dark to anechoic posterior shadow (Figure 3-4). These acoustic shadows usually have sharp, well-defined edges.
• Some abnormalities are a result of obstruction due to calculi, disease, or compromise from an adjacent enlarged organ or mass. All of these present sonographically as deviations from the normal appearance and size of the structure(s) they are associated with (Figure 3-5).
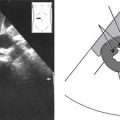
• Abnormalities such as vascular aneurysms are due to a break down or weakening of structure, which present sonographically as deviations from the normal appearance and size (Figure 3-6).
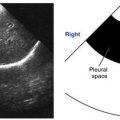
• There are certain body structures such as lymph nodes that are generally not appreciated sonographically unless they are abnormal (Figure 3-7).
Criteria for Documenting Abnormal Findings/Pathology
• Pathology must be surveyed in at least two scanning planes following the survey of the primary area(s) of interest. This is not to say that the abnormality is not evaluated as the area of interest is evaluated, but it ensures that a total evaluation is made of a structure, not just its abnormal part.

A mass is classified according to its composition; solid, cystic, complex. A, This is a solid, echogenic mass in the liver (noted by arrows). It appears hyperechoic relative to the surrounding liver. Notice how the mass is circumscribed to a specific area. B, This is cystic mass (noted by the measurement calipers). It appears specific to one area and is primarily anechoic with echogenic internal debris. Note the increased posterior through transmission indicating fluid. C, This is a complex mass (noted by arrows). It appears confined to one area and heterogeneous; composed of echogenic, solid portions and anechoic, cystic portions (indicated by increased posterior through transmission).
• Image documentation must be in at least two scanning planes. Single-plane representation of an abnormality is not enough confirmation.
• Image documentation must include a volume measurement of an abnormality. Volume measurements: L × W × AP = V (length × width × the anteroposterior dimension).
• Careful placement of measurement calipers at the leading margins of an abnormality provides accurate dimensions.

Typically, calculi or “stones” are distinguished by the fact that they impede (reflect, absorb, stop, decrease) sound waves This creates a bright anterior surface and dark to anechoic posterior shadow. Note the well-defined, sharp edges of the shadows.

Some abnormalities are a result of obstruction due to calculi (stone), disease, or compromise from an adjacent enlarged organ or mass. In this case, a stone within the common bile duct (CBD) is obstructing the flow of bile; consequently, the proximal portion of the CBD is dilated. (Courtesy Adrian Goudie, MD, Ultrasoundvillage.com.)
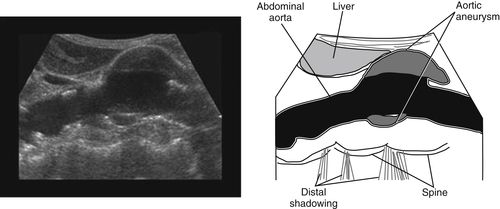
Some abnormalities, such as the aortic aneurysm seen in this image, are due to a break down or weakening of structure. (Courtesy Dr. T.S.A. Geertsma, Ziekenhuis Gelderse Vallei, Ede, The Netherlands.)

This image highlights a lymph node (arrow); typically, they are not appreciated sonographically unless they are abnormal.
• When multiple masses are present and can be differentiated from each other, they should be measured individually.
• Image documentation must include views of the abnormality with high- and low-gain settings in at least two scanning planes to resolve the composition.
• Remember, you can document an abnormality without knowing what it is. It is not necessary to be familiar with specific diseases and abnormalities to document them sonographically. A sonographer benefits, however, from having a broader knowledge of specific abnormalities and pathologic processes. The goal is to provide the physician with interpretable images.
• The required images are a small representation of what a sonographer visualizes during a study. Therefore, the images should provide the interpreting physician with the most telling and technically accurate information available.
Criteria for Describing the Sonographic Appearance of Abnormal Findings/Pathology
• The purpose of learning how to accurately and appropriately describe the sonographic appearance of pathology is essential to staying within the scope of a sonographer’s legal parameters. This need arises with the understanding that physicians exclusively render diagnoses.
• You can document and describe an abnormality without knowing what it is. From the examples in this section, you will see that it is not necessary to be familiar with specific diseases and abnormalities to describe them sonographically. A sonographer benefits, however, from having a broader knowledge of specific abnormalities and pathologic processes.
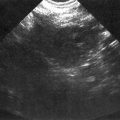
• While the findings in the next image are typical of diffuse liver disease/cirrhosis, an example of how a sonographer should describe the findings is:

”Enlarged right lobe of the liver, visualization of intrahepatic vessels is markedly decreased. Ascites noted anteriorly and inferiorly.”
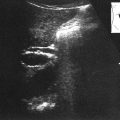
• One example of focal disease is pancreatitis which causes focal enlargement of the head of the pancreas. Pressure from the enlarged head can obstruct, constrict, or dilate the common bile duct. In some cases, the duodenum becomes obstructed as well. While the findings in the following image are consistent with pancreatitis, an example of how a sonographer should describe the findings is:
Related posts:
Stay updated, free articles. Join our Telegram channel

Full access? Get Clinical Tree


