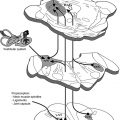
Fig. 39.1
The process of subtraction ictal SPECT coregistered to MRI. Interictal SPECT is linearly transformed to the same patient’s ictal SPECT using chamfer surface matching algorithm (a). The total intensity levels of ictal and transformed interictal SPECTs are normalized (b). The difference of two corresponding pixel values of ictal and interictal SPECTs is calculated and separated into positive (increased rCBF) and negative difference (decreased rCBF) images (c). Finally, subtracted SPECT is overlaid to MRI for anatomical localization (d)
Ictal–interictal SPECT registration: Before subtracting each voxel value of the ictal and interictal SPECT images, three-dimensional position of interictal SPECT is transformed to the ictal SPECT using a chamfer surface matching algorithm. In all cases, root mean square distance is within one voxel. Correct anatomical registration of the ictal and interictal SPECT images is very important for improving the sensitivity of the SPECT subtraction. Moreover, inaccurate registration may produce false-negative or false-positive perfusion differences.
Normalization of radioisotope uptake level: Different radioisotope uptake levels are normalized as each patient receives different amounts of radioisotope. A normalization factor is calculated over the whole brain. Global normalization is the best method for preprocessing, but sometimes this method can produce false-positive or false-negative findings especially when the areas of perfusion changes are extensive. In that case, regional normalization using the cerebellum, white matter, non-epileptic hemisphere, or brain stem may be a better normalization scheme (Zubal et al. 1995).
Ictal-transformed interictal SPECT subtraction: To obtain the cerebral perfusion difference, transformed and normalized interictal SPECT is subtracted from ictal SPECT. The difference in radioisotope uptake level is calculated by pixel-by-pixel subtraction. Thus, brain regions of increased rCBF (with positive pixel values) and regions of decreased rCBF (with negative pixel values) are separately identified.
Intensity thresholding: To erase noise during the subtraction processing, the standard deviation (SD) of subtracted SPECT pixels is calculated. A threshold of two SD is set to erase the noise. Placing the significance level at three SD increases specificity, but decreases sensitivity. If no significant rCBF change is observed in subtracted SPECT, one can consider reducing the threshold to one SD and searching for (nonsignificant) tendencies toward ictal rCBF changes.
MRI-subtracted SPECT registration: For the localization of difference images, the subtracted SPECT is coregistered with an SPGR MRI of the patient’s whole brain. In most cases, the error ranges of SPECT-MRI registration for clinical use are within 5 mm (O’Brien et al. 1998a).
39.3 Interpretation of SISCOM
Ictal hyperperfusion and hypoperfusion in subtracted SPECT are generally considered significant when the difference of rCBF in each pixel is greater than two SD. The location of significant ictal hyperperfusion is visually decided on MRI by SPECT-MRI coregistration. For the determination of significant rCBF changes, only brain regions showing three and over three voxels (3.56 mm × 3 = 10.68 mm) with significantly different intensity values between ictal and interictal SPECT images are included. Because subtracted SPECT may reflect the perictal or postictal state when the injection of radioisotope was delayed or seizures were very short lasting, subtracted SPECT should be interpreted with considering the interval between radioisotope injection and seizure onset, duration of seizure, and time of seizure end. The propagation pattern of ictal EEG discharges at the time of radiotracer injection is also very important because it may affect the final result of subtracted SPECT. Frontal lobe seizures show a tendency of rapid propagation compared to temporal lobe seizures. The interpretation of SISCOM should include careful simultaneous review of seizure semiology, sequences of ictal EEG patterns, injection time in relation to seizure duration, structural lesion, and other clinical information. SISCOM reflects only cerebral perfusion changes (significantly different from the interictal state) at the time of tracer injection, not always the zone of seizure onset.
39.4 Clinical Significance and Research Applications of SISCOM
The first study using subtracted SPECT was published by Zubal et al. (1995). From this difference image technique, the epileptic focus was localized in five of six temporal lobe focus patients and in four of six for extratemporal seizure patients. This result was superior to visual analysis, and the difference images provided more precise information regarding location of the seizure focus.
Subtraction of interictal from ictal SPECT coregistered to 3-dimensional MRI (SISCOM) is an improved and better validated technique for ictal and interictal SPECT subtraction. Various clinical studies have been performed using this SISCOM technique in the field of epilepsy (O’Brien et al. 1998a, b, 1999; Lee et al. 2000). In the first study on patients with intractable partial epilepsy (O’Brien et al. 1998a), SISCOM was able to localize the epileptic focus in 45 out of 51 (88.2 %) patients, while the traditional side-by-side inspection of ictal and interictal SPECT images localized 20 out of 51 (39.2 %). However, late injection of the radiotracer (>45 s after seizure onset) but not secondary generalization was associated with a falsely localizing or nonlocalizing SISCOM. To overcome the problem of delayed injection, automated equipment for self-injection was developed which improved the sensitivity of ictal SPECT (Van Paesschen et al. 2000). To circumvent the difficulty of early injection during seizures, a postictal SPECT study was performed (O’Brien et al. 1999). The combined interpretation of hyperperfusion (positive values) and hypoperfusion (negative values) of SISCOM showed a better concordance rate with the final diagnosis than the analysis of either the hyperperfusion or hypoperfusion SISCOM image alone. In a similar study (Lee et al. 2000), the sensitivity of the combined hyperperfusion and hypoperfusion SISCOM (91.8 %) was superior to only hyperperfusion SISCOM (85.2 %) and visual inspection of ictal SPECT (68.9 %). Ictal hypoperfusion at the epileptic focus was first reported in that study. Figure 39.2e demonstrated that a patient with an epileptic focus at the left posterior lateral temporal cortex showed ictal hypoperfusion at the epileptic focus, while ictal hyperperfusion was seen at left anterior temporal region where ictal discharges propagated rapidly at the time of radiotracer injection. Rapid propagation of ictal discharges to other brain regions with early postictal state of the epileptic focus despite persistence of clinical seizures is the probable explanation for ictal hypoperfusion. In cases where early radiotracer injection is difficult, postictal SPECT subtraction can also be helpful in the evaluation and localization of the epileptic focus (Zubal et al. 1999).
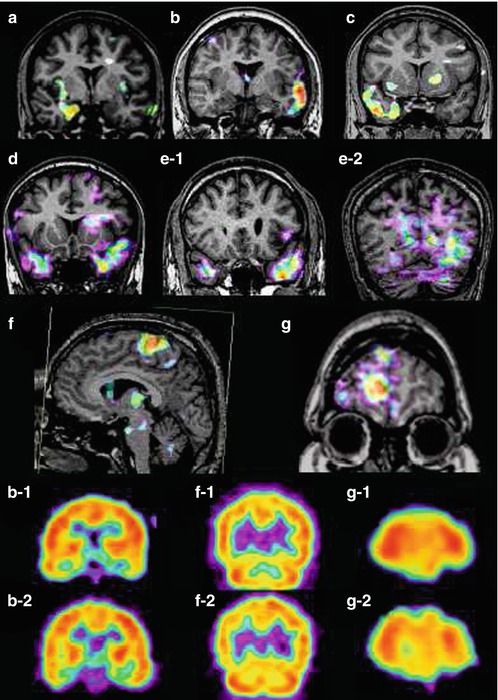
Fig. 39.2
Various perfusion patterns of subtracted SPECT in TLE (temporal lobe epilepsy) and ETLE (extratemporal lobe epilepsy) patients. The perfusion patterns of subtracted SPECT in TLE are (a) hyperperfusion in only mesial temporal region of the right mesial TLE, (b) hyperperfusion in lateral temporal region of the left neocortical TLE, (c) hyperperfusion in both mesial and lateral temporal areas in the right mesial TLE, and (d) hyperperfusion-plus pattern of subtracted SPECT: bilateral temporal hyperperfusion with left predominance in the left neocortical TLE. (e-1 and e-2) Combined hyperperfusion–hypoperfusion pattern of subtracted SPECT in a patient with an epileptic focus at the left posterior lateral temporal cortex; e-1 is a positive image showing hyperperfusion in the left anterior temporal region, and e-2 is a negative image showing hypoperfusion in the left posterior lateral and basal temporal cortex from the same interictal and ictal SPECT images. (f and g) Perfusion patterns of subtracted SPECT in ETLE patients: (f) focal hyperperfusion in a left supplementary motor area seizure and (g) focal hypoperfusion in the right frontal lobe epilepsy. b-2, f-2, and g-2 are conventional ictal SPECT of patients b, f, and g, while b-1, f-1, and g-1 are conventional interictal SPECT of patients b, f, and g. All images are presented in radiological view
Other study compared the ability of MSI, FDG-PET, and ictal SPECT to predict seizure-free outcome after epilepsy surgery with intracranial EEG monitoring. The odds ratios of MSI (magnetic source imaging), FDG-PET, and ictal SPECT for prediction of seizure outcome were 4.4, 7.1, and 9.1, respectively, although the number of patients who had MSI, FDG-PET, or ictal SPECT was different (Knowlton at al. 2008).
Another study compared different diagnostic tools in the prognostic factors for surgical outcome in neocortical epilepsy patients. Diagnostic sensitivities of interictal EEG, ictal scalp EEG, FDG-PET, and subtraction ictal single photon emission computed tomography were 37.1 %, 70.8 %, 44.3 %, and 41.1 %, respectively. Localization by FDG-PET and interictal EEG was correlated with a seizure-free outcome. Concordance with two or more presurgical evaluations was significantly related to a seizure-free outcome. But this study showed lower sensitivity of SISCOM compared to other studies (Lee et al. 2005). So there are many factors affecting the result of ictal SPECT and SISCOM including seizure type and duration, radiotracer type, injection time, epilepsy monitoring unit setting, experience of technicians, and the method of SISCOM.
Ahnlide et al. (2007) analyzed SISCOM in 26 patients who had intracranial EEG monitoring and epilepsy surgery. SISCOM findings altered and extended the strategy for electrode placement at invasive recording in 15 patients. In this study, SISCOM was a prerequisite for seizure outcome in all six patients with favorable outcomes, and SISCOM is valuable for the identification of the epileptogenic zone in patients with drug-resistant epilepsy scheduled for invasive video-EEG.
Other two studies also indicated that SISCOM may have an impact on surgical decision (Tan et al. 2008; von Oertzen et al. 2011) (Fig. 39.3).
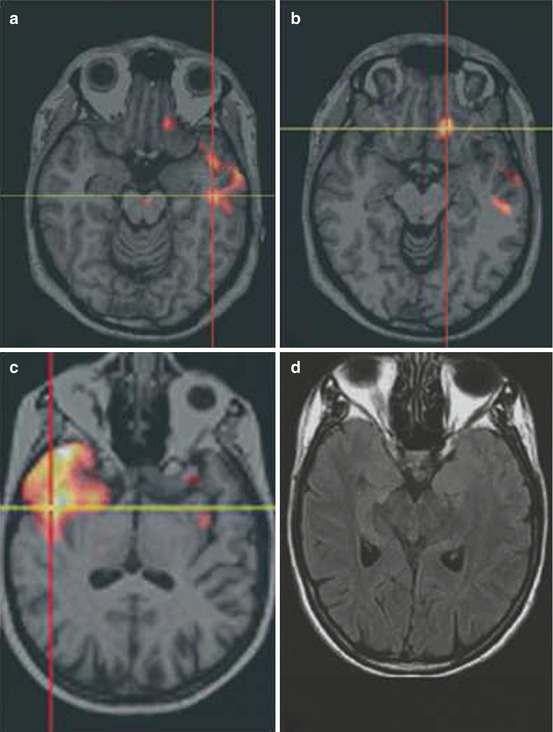
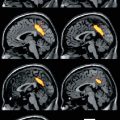
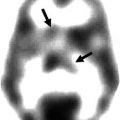
Fig. 39.3
 Impact of the IWG/Dubois Criteria for Alzheimer’s Disease in Imaging Studies
 PET and SPECT Studies of Ageing and Cardiovascular Risk Factors for Alzheimer’s Disease
 Gliomas
 Whiplash, Real or Not Real? A Review and New Concept
 Linking Molecular Neurobiology to Therapeutic Approaches for Alzheimer’s Disease with PET
 Radionuclide Imaging Studies in Pediatric Neurology


(a, b) Example of widespread SISCOM hyperperfusion and concordant multifocal ECoG seizure onset: 22-year-old male patient with drug-refractory epilepsy had two types of seizures. (c, d) Example of nonlesional MRI with SISCOM concordant to site of surgery and seizure-free outcome
Related posts:
Impact of the IWG/Dubois Criteria for Alzheimer’s Disease in Imaging Studies
PET and SPECT Studies of Ageing and Cardiovascular Risk Factors for Alzheimer’s Disease
Gliomas
Whiplash, Real or Not Real? A Review and New Concept
Linking Molecular Neurobiology to Therapeutic Approaches for Alzheimer’s Disease with PET
Radionuclide Imaging Studies in Pediatric Neurology
Stay updated, free articles. Join our Telegram channel
Full access? Get Clinical Tree
