Presentation and Presenting Images
A 57-year-old female with a family history of breast cancer (paternal aunt diagnosed at age 39). Her Gail model risk assessment estimates a 5-year risk for breast cancer of 1.3% with a lifetime risk of 9.3%. She presents for routine screening mammography.
69.2.1 Breast Tissue Density
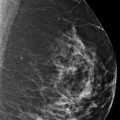
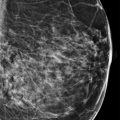
There are scattered areas of fibroglandular density.
69.2.2 Imaging Findings
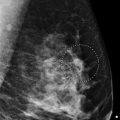
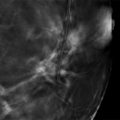
There are two adjacent oval masses in the posterior upper outer region of the left breast ( ▶ Fig. 69.3 and ▶ Fig. 69.4). Both masses are in the posterior depth at the 3 to 4 o’clock location. One mass (broken arrow) is 10 cm from the nipple and the other mass (solid arrow) is 12 cm from the nipple.
69.3 BI-RADS Classification and Action
Category 0: Mammography: Incomplete. Need additional imaging evaluation and/or prior mammograms for comparison.
69.4 Diagnostic Images 1
( ▶ Fig. 69.5, ▶ Fig. 69.6, ▶ Fig. 69.7, ▶ Fig. 69.8, ▶ Fig. 69.9, ▶ Fig. 69.10)
69.4.1 Imaging Findings
Digital breast tomosynthesis (DBT) shows the masses to be well circumscribed and low density ( ▶ Fig. 69.8, ▶ Fig. 69.9, and ▶ Fig. 69.10). A fatty cleft suggestive of a fatty hilum is not seen within either mass. Sonography is necessary to further characterize the masses.
69.5 Diagnostic Images 2
( ▶ Fig. 69.11, ▶ Fig. 69.12, ▶ Fig. 69.13)
69.5.1 Imaging Findings
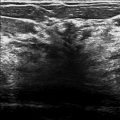
Ultrasound imaging demonstrates mammographic-sonographic correlation and characterizes both as fibrocystic changes.
69.6 BI-RADS Classification and Action
( ▶ Fig. 69.11, ▶ Fig. 69.12, ▶ Fig. 69.13)
Category 2: Benign
69.7 Differential Diagnosis
Fibrocystic changes: On mammography, solid and cystic masses may have a similar appearance. Sonography demonstrates features consistent with fibrocystic changes.
Lymph nodes: This is an excellent location for lymph nodes; however, sonography does not support this diagnosis. A fatty hilum is absent from both masses.
Breast cancer: This would be an example of a multifocal malignancy; however, sonography does not support this diagnosis. The sonographic features are benign.
69.8 Essential Facts
DBT shows the masses to be well circumscribed and low density. A fatty cleft suggestive of a fatty hilum is not seen within either mass on conventional mammography or on DBT imaging. Sonography is necessary to further characterize the masses.
Cysts result from distension of the terminal duct lobular units (TDLU) due to progressive filling with fluid.
Breast clustered microcysts are relatively common, seen in about 6% of breast sonograms. Clustered microcysts may be followed with annual surveillance (BI-RADS Category 2), or, if the diagnosis is uncertain, short-interval follow-up (BI-RADS Category 3) may be performed. At our institution we consider them a BI-RADS Category 2 finding.
69.9 Management and Digital Breast Tomosynthesis Principles
DBT is considerably more dose-efficient than tomography, due to the fact that a complete three-dimensional (3D) image can be reconstructed from a single scan.
On two-dimensional (2D) mammograms, findings may be difficult to see because of the anatomical noise from objects above and below. This is because the signal detected at a location on the film cassette or digital detector is dependent upon the total attenuation of all the tissues above the location.
DBT technology compiles 3D images of the breast and can therefore detect masses masked by overlapping tissue.
69.10 Further Reading
[1] Berg WA. Sonographically depicted breast clustered microcysts: is follow-up appropriate? AJR Am J Roentgenol. 2005; 185(4): 952‐959 PubMed
[2] Berg WA, Sechtin AG, Marques H, Zhang Z. Cystic breast masses and the ACRIN 6666 experience. Radiol Clin North Am. 2010; 48(5): 931‐987 PubMed
[3] Souchay H, Carton A-K, Iordache R. Boosting dose efficiency with digital breast tomosynthesis. GE white paper. Accessed 12/25/2015. Available at: https://www.google.co.in/url?sa=t&rct=j&q=&esrc=s&source=web&cd=1&cad=rja&uact=8&ved=0ahUKEwiA587BpuPMAhXLgI8KHe9HC3IQFggcMAA&url=http%3A%2F%2Fwww3.gehealthcare.com.br%2F~%2Fmedia%2Fdownloads%2Fbr%2Fsenoclaire_dose_white_paper_-_doc1403841.pdf%3FParent%3D%257B10196544–07D9–4A31–95BB-DD2D94F05C16%257D&usg=AFQjCNEZqb51t7uNyS1TGyT2S_kzhrHkJA&bvm=bv.122129774,d.c2I

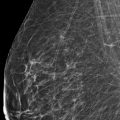
Fig. 69.1 Left craniocaudal (LCC) mammogram.
Related posts:
Stay updated, free articles. Join our Telegram channel

Full access? Get Clinical Tree


