Renal cell
Metanephric
Mesenchymal
Mixed epithelial and mesenchymal
Oncocytoma
Metanephric adenoma
Angiomyolipoma
Cystic nephroma
Papillary adenoma
Metanephric adenofibroma
Leiomyoma
Mixed epithelial and stromal tumor
Metanephric stromal tumor
Hemangioma
Lymphangioma
Juxtaglomerular cell tumora
Fibroma
Schwannoma
Nephroblastic tumors
Neuroendocrine
Nephrogenic restsb
Somatostatinoma
Table 2
World Health Organization (WHO) histological classification of malignant neoplasms of the kidney
Renal cell | Mesenchymal | Mixed epithelial and mesenchymal |
|---|---|---|
Clear cell renal cell carcinomaa | Occurring mainly in infants | Synovial sarcoma |
Papillary renal cell carcinoma | Clear cell renal cell sarcoma | |
Chromophobe renal cell carcinoma | Rhabdoid tumor | |
Hereditary cancer syndromes | Congenital mesoblastic tumor | |
Multilocular cystic renal cell carcinoma | Ossifying renal tumor of infants | |
Collecting duct carcinoma of Bellini | ||
Medullary carcinoma | Occurring mainly in adults | |
Other formsb | Leiomyosarcoma | |
Angiosarcoma | ||
Rhabdomyosarcoma 8900/3 | ||
Malignant fibrous histiocytoma | ||
Hemangiopericytoma | ||
Osteosarcoma | ||
Renomedullary interstitial cell tumor | ||
Solitary fibrous tumor | ||
Hematopoietic and lymphoid tumors | Neuroendocrine | Germ cell tumors |
Lymphoma | Carcinoid | Teratoma |
Leukemia | Neuroendocrine carcinoma | Choriocarcinoma |
Plasmacytoma | Primitive neuroectodermal tumor | |
Neuroblastoma | ||
Pheochromocytoma |
Recent advances in imaging technology, and in particular the wide use of ultrasonography (US) and computed tomography (CT), have led to an increase in the numbers of incidentally discovered renal masses in seemingly asymptomatic patients. Although renal cell carcinoma (RCC) is by far the most lethal urologic malignancy, benign tumors constitute a significant proportion of incidental solid renal masses (Prasad et al. 2008b; Silverman et al. 2008; Berland et al. 2010). As benign solid renal masses are increasingly found, characterization of the lesion, especially as benign vs. malignant, as well as the decision of optimal treatment method, has been increased and become more important. In fact, a significant proportion of the surgically removed solid renal masses are histologically benign (Kutikov et al. 2006; Beland et al. 2007; Maturen et al. 2007; Vasudevan et al. 2006; Silverman et al. 2008), especially lesions <3 cm in diameter, and unnecessary surgery is performed.
According to the American College of Radiology Incidental Findings Committee (Berland et al. 2010), when a solid renal mass is incidentally identified, pseudotumors (e.g., pyelonephritis) and fat-containing angiomyolipomas should be excluded. Incidental solid renal masses <1 cm in diameter should undergo follow-up (CT or MR imaging at 3–6 months, 12 months, and then yearly) until 1 cm or 1.5 cm in patients with comorbidities or limited life expectancy. Incidental solid renal masses 1–3 cm in diameter should undergo surgery in the general population or surgery or observation in patients with comorbidities. In particular, if the solid renal mass is hyperattenuating and homogeneously enhancing, MR imaging and/or percutaneous biopsy should be considered to diagnose angiomyolipoma with minimal fat. In incidental solid renal masses > 3 cm, again surgery in the general population, or surgery or observation in patients with comorbidities is suggested. In particular, biopsy should be considered to exclude angiomyolipoma with minimal fat and to confirm renal cell carcinoma.
Incidental cystic renal masses with a Bosniak I or II pattern (Bosniak 1986), corresponding to simple cysts with hairline thin wall or with fine wall calcifications or with short segment of slightly thickened calcifications in the wall or septa or also hyperdense cysts <3 cm, should be ignored (Berland et al. 2010). Incidental cystic renal masses classified as Bosniak IIF, with minimal smooth thickening of wall or septa that may show perceived (not measureable) enhancement, and with thick calcifications and no enhancing soft-tissue components, should undergo follow-up by CT or MR imaging at 6 and12 months, then yearly for 5 years. The other incidental cystic renal masses should undergo surgery provided that cystic masses ≤1.5 cm that are not clearly simple cysts or that cannot be characterized completely may not require further evaluation in patients with comorbidities and in patients with limited life expectancy.
Anyway, the relatively high incidence of benign masses removed at surgery warrants a change in the management algorithm for patients with suspicious RCC, and proceeding to surgery, even with a minimally invasive approach such as partial nephrectomy, should be avoided whenever possible. Anyway, benign and malignant tumors may be impossible to differentiate by imaging. Moreover, pathologists advise caution when interpreting tumors, specifically those with oncocytic features or hybrid or collision tumors (Rowsell et al. 2007). Under these clinical circumstances, the need for less invasive and less extensive treatment strategies, such as careful follow-up with CT, US, or percutaneous biopsy, becomes critical treatment issues.
Different strategies have been proposed for the clinical management of enhancing renal masses. Percutaneous image-guided renal mass biopsy is suggested to preoperatively characterize renal masses and to establish definitive diagnoses (Silverman et al. 2006). Based largely on advances in cytological techniques, percutaneous biopsy can now be used to diagnose benign neoplasms and thus prevent them from being treated unnecessarily (Sahni and Silverman 2009). Percutaneous biopsy has been suggested also for renal masses without radiologic evidence of malignancy (Lebret et al. 2007). Minimally invasive management, such as partial nephrectomy, cryotherapy (Gill et al. 2000), or radio-frequency ablation (Fotiadis et al. 2007), should be considered for tumor removal, while conserving unaffected normal renal parenchyma.
Benign and malignant renal tumors may present a similar vascular architecture at color and power Doppler US and similar appearance on CT. In order to characterize a solid renal mass, the contrast-enhanced CT examination should be multiphasic including the unenhanced scan, the corticomedullary phase scan to recognize the vascularization of the tumor, and the nephrographic phase scan to recognize the enhancement level and all the outline of the lesion. The most important aspect in analyzing a renal mass is to show the presence or absence of enhancement within it (Israel et al. 2006), even though it is not considered a sign of malignancy. An increase of 20 HU attenuation (Israel and Bosniak 2005) within a renal lesion after the intravenous administration of contrast agent has been generally accepted as a threshold for contrast enhancement. If the change in lesion density is between 10 and 20 HU (equivocal enhancement) or if the change in lesion density is <10 HU (absent enhancement), the lesion may be solid benign or malignant (typically papillary-cell carcinoma) or cystic.
In this case the renal lesion should be considered indeterminate, and further evaluation with magnetic resonance (MR) imaging with image subtraction technique (Hecht et al. 2004) should be performed. MR imaging examinations are performed with a phased-array body coil. Each examination should include coronal and transverse T2-weighted turbo spin-echo (TSE) sequence; T2-weighted turbo spin-echo sequence with fat suppression including spectral presaturation with inversion recovery (SPIR), or spectral adiabatic inversion recovery (SPAIR), or short-tau inversion recovery (STIR) sequences; axial dual-echoin-phase and opposed-phase gradient echo (GRE) T1-weighted sequence; and axial or coronal 3D fat-suppressed spoiled GRE (SPGR)T1-weighted sequence obtained before and after the intravenous administration of contrast material. Dual echo in-phase and opposed-phase gradient echo (GRE) T1-weighted sequence; and axial or coronal 3D frequency-selective fat-suppressed fast spoiled GRE (SPGR) T1-weighted sequence obtained before and after the intravenous administration of contrast material. Dual-echo inphase and opposed-phase GRE T1-weighted sequence is helpful in assessing for the presence of intratumoral fat. Images are obtained at specific echo times at which water and fat protons are inphase and out of phase with each other (at 1.5 T, 4.2 and 2.1 ms, respectively). A loss of signal intensity on the opposed-phase images in comparison with the in-phase images occurs when both fat and water are present within a voxel as in the case of microscopic fat.
Except for angiomyolipoma, MR imaging sequences are not sensitive or specific in the characterization of renal masses as benign or malignant. In most cases, a renal solid enhancing mass corresponds to a malignancy, even though many benign lesions may present a hypervascular pattern after contrast administration. Image subtraction consists in the subtraction of the unenhanced from the gadolinium-enhanced fat-suppressed T1-weighted images, and it represents a reliable method of showing enhancement within a renal mass (Hecht et al. 2004). If subtraction is not available or image misregistration is present, the percentage of enhancement can be calculated. If a renal mass or a portion of a renal mass enhances more than 15 % after a scan delay of 2–4 min, it is highly likely to be a solid mass (Ho et al. 2002). It is also possible to identify enhancement visually within a renal mass with a side-by-side comparison of the unenhanced and contrast-enhanced images (Israel et al. 2006). This is straightforward in hypervascular masses, while in hypovascular masses and in those masses that are hyperintense on unenhanced T1-weighted images, side-by-side comparison is usually not reliable.
In this chapter we will describe the most frequent benign renal tumors, while the more rare histotypes are described in chapter “Rare and secondary tumors of the kidney and renal pseudotumors.”
1 Angiomyolipoma
Angiomyolipomas are the most frequent mesenchymal benign neoplasms of the kidney with a prevalence of 0.3–3 % and occur more commonly in women than men. The other mesenchymal benign neoplasms are described in chapter “Rare and secondary tumors of the kidney and renal pseudotumors.”.
Angiomyolipomas, particularly when small, warrant no treatment, while they are resected only when over 4 cm or symptomatic due to risk of bleeding. Angiomyolipomas are rare in children as isolated lesions but are found in up to 80 % of children with tuberous sclerosis, then usually being bilateral, small, and multifocal. The tumor appears usually as an expansive unifocal large mass which is yellowish on section when the fat component is prevalent, white if the muscular component is prevalent, or red when the vascular component is prevalent which may present a hemorrhagic pattern. Angiomyolipoma rarely may become locally aggressive, with invasion into adjacent nodes or within the inferior vena cava. Angiomyolipoma contains smooth muscle, vascular, lipomatous, and myeloid elements in different proportions. When encountering an incidental solid renal mass, angiomyolipoma should be excluded (Silverman et al. 2008). To the pathologist, the most suggestive feature of angiomyolipoma is the vessels. An interesting aspect of angiomyolipoma is the association with tuberous sclerosis, an autosomal dominant phakomatoses syndrome, and with lymphangioleiomyomatosis, a progressive disease which usually affects the lungs of young women and which is also related to tuberous sclerosis.
Small angiomyolipoma (<3 cm in diameter). Angiomyolipomas smaller than 3 cm appears typically as hyperechoic, sharply marginated, and homogeneous lesions at gray-scale ultrasound (US), with hypovascular appearance at contrast-enhanced US after microbubble contrast agent injection (Li et al. 2009) (Figs. 1 and 2). The presence of posterior acoustic shadowing may suggest angiomyolipoma. The CT diagnosis of angiomyolipoma is related to the identification of macroscopic (bulk) fat within the lesion in the absence of calcifications, and angiomyolipoma represents the most commonly imaged renal tumor containing macroscopic fat (Fig. 2). Most angiomyolipomas can be diagnosed immediately by identifying regions of macroscopic fat (Fig. 2) frequently commixed with angiomatous enhancing component (Fig. 3) within a noncalcified renal mass at unenhanced CT (Bosniak et al. 1988; Silverman et al. 2008).
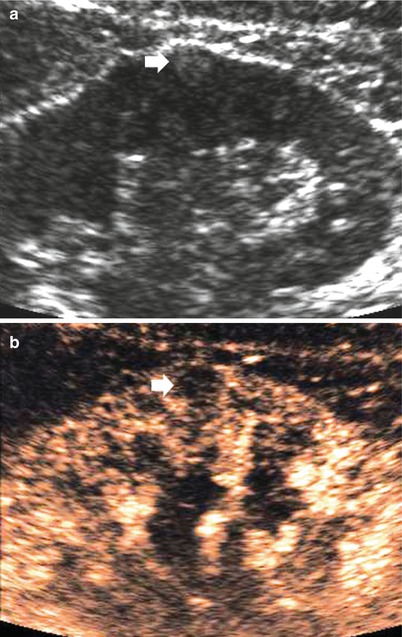
Fig. 1
Small angiomyolipoma (arrow) scanned at unenhanced (a) and contrast-enhanced US (b). The angiomyolipoma typically appears as a small subcapsular tumor homogeneously hyperechoic at unenhanced US. After sulfur hexafluoride-filled microbubble injection (b), the small angiomyolipoma (arrow) appears persistently hypovascular in comparison to the adjacent renal parenchyma
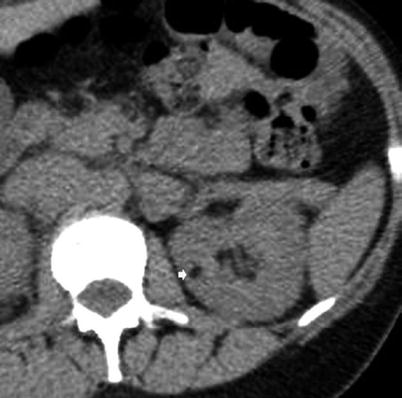
Fig. 2
Small angiomyolipoma scanned by unenhanced CT. The lesion (arrow) appears hypodense with a fatty density
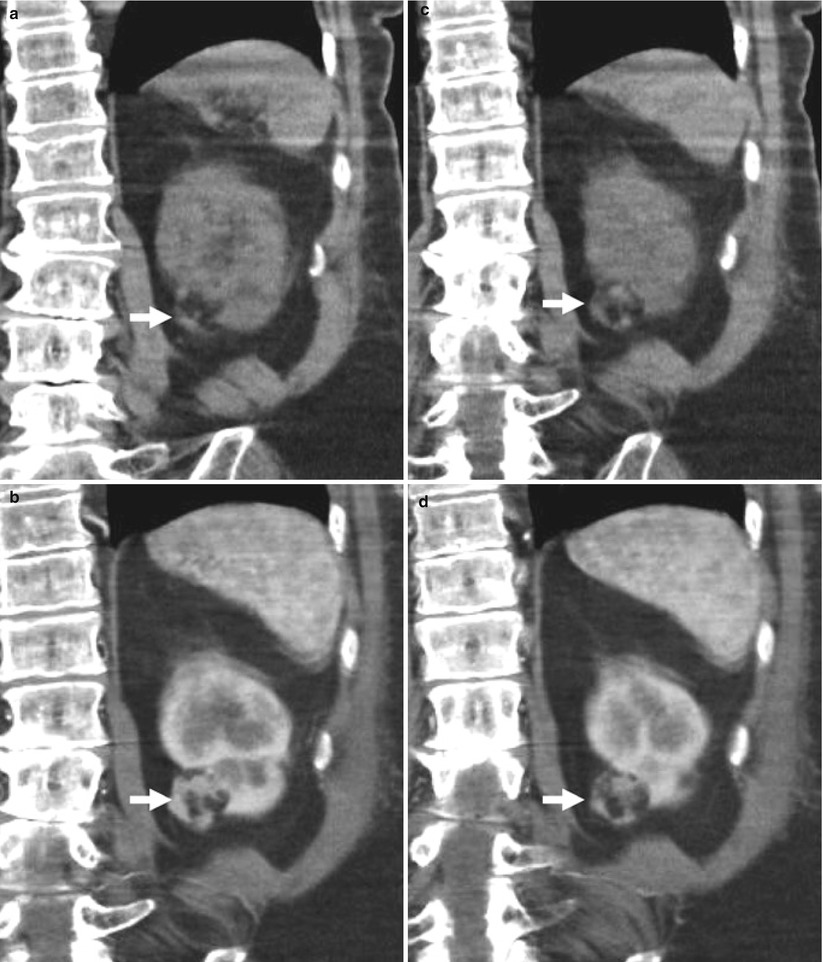
Fig. 3
Small angiomyolipoma of the left kidney scanned by unenhanced and contrast-enhanced CT. (a, b) Unenhanced CT and (c, d) contrast-enhanced CT on corticomedullary phase. The lesion (arrow) presents a hypodense fatty component evident on unenhanced CT scan commixed with an enhancing angiomatous component
On MR imaging, the fatty and angiomyomatous solid components of angiomyolipoma appear, respectively, hyperintense and hypointense on T1-weighted sequences. On T2-weighted sequences, the fat component appears hyperintense, with fat signal suppression on T1-weighted or T2-weighted sequences with fat saturation (Fig. 4). To establish the presence of macroscopic fat within a renal mass, obtaining fat-suppressed MR sequences such as STIR (Fig. 4) or frequency-selective fat-suppressed T1-weighted images and comparing them with nonfat-suppressed T1-weighted images are necessary (Israel et al. 2005).
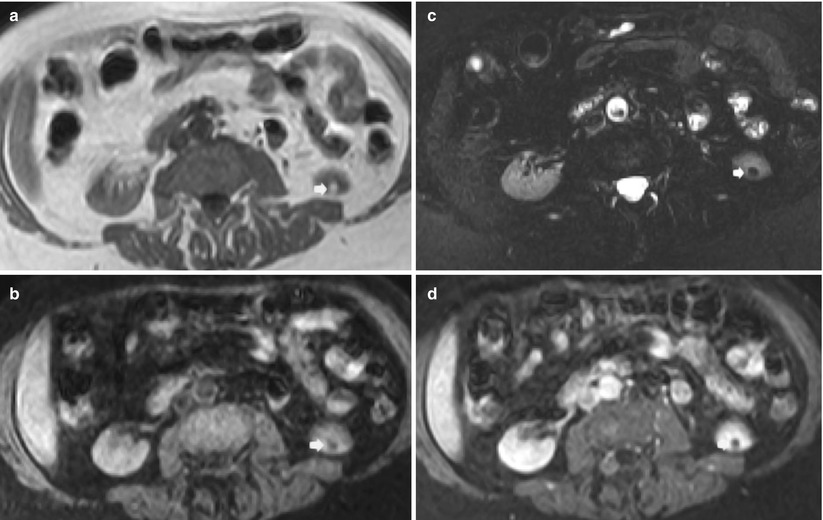
Fig. 4
Small angiomyolipoma (arrow) scanned by unenhanced and contrast-enhanced MR imaging. (a) T1-weighted turbo spin-echo sequence. A small hyperintense lesion is identified on the lower pole of the left kidney. (b) Short-tau inversion recovery (STIR). The same lesion appears hypointense with suppression of the signal related to macroscopic fat. (c, d) T1-weighted breath-hold spoiled gradient echo (SPGR) before (c) and after (d) gadolinium-based agent injection during nephrographic phase. The fat lesions do not present any contrast enhancement
Large angiomyolipoma (≥3 cm in diameter). Large angiomyolipomas may reveal homogeneous (Fig. 5) or heterogeneous bright appearance at US due to solid, adipose, and hemorrhagic components. Frequently large angiomyolipomas present an extrinsic development and a wedge-shaped connection with the renal parenchyma resulting in a parenchyma defect, also with evidence of posterior acoustic shadowing (Yamashita et al. 1993; Hélénon et al. 1997, 2001; Jinzaki et al. 1997). Color Doppler US reveals penetrating, peripheral or mixed peripheral, and intratumoral vessel distribution, with a prevalence of mixed distribution in atypical hypervascular angiomyolipomas.

Fig. 5
Large angiomyolipoma with overt fat component on CT. (a) Baseline gray-scale US. Hyperechoic and homogeneous large renal mass (calipers). (b) Unenhanced CT. The same renal mass (arrow) appears hypodense with a fatty density. (c) Contrast material-enhanced CT, corticomedullary phase. Hypodense appearance of the lesion which maintains a fat-density appearance
The evidence of a small amount of macroscopic fat is enough to suggest angiomyolipoma diagnosis. Angiomyolipomas larger than 3 cm prevalently reveal a prevalent hypodense macroscopic fat component at nonenhanced CT in varying proportions (Figs. 5 and 6), hypervascular soft tissue (Fig. 6), and intralesional aneurysms (Fig. 7 and 8). Contrast enhancement is heterogeneous on the solid peripheral or central component sparing the fat component after iodinated contrast agent injection. Thin-section CT may be needed for small angiomyolipomas and those angiomyolipomas that contain only small amounts of fat (Silverman et al. 2008). The identification of macroscopic fat is most reliable on unenhanced CT scan or by pixel map and represents the most important imaging features to diagnose renal angiomyolipomas. CT findings of more than 20 pixels with attenuation less than −20 HU and more than 5 pixels with attenuation less than −30 HU have a positive predictive value of 100 % in detection of angiomyolipoma, but most angiomyolipomas with minimal fat cannot be reliably identified on the basis of an absolute pixel count (Simpfendorfer et al. 2009). Bilateral multiple renal angiomyolipomas are seen in patients who have tuberous sclerosis (Fig. 9). Simultaneous occurrence of angiomyolipoma with RCC and oncocytoma in the same kidney has been reported (Silpananta et al. 1984; Bahrami et al. 2007).
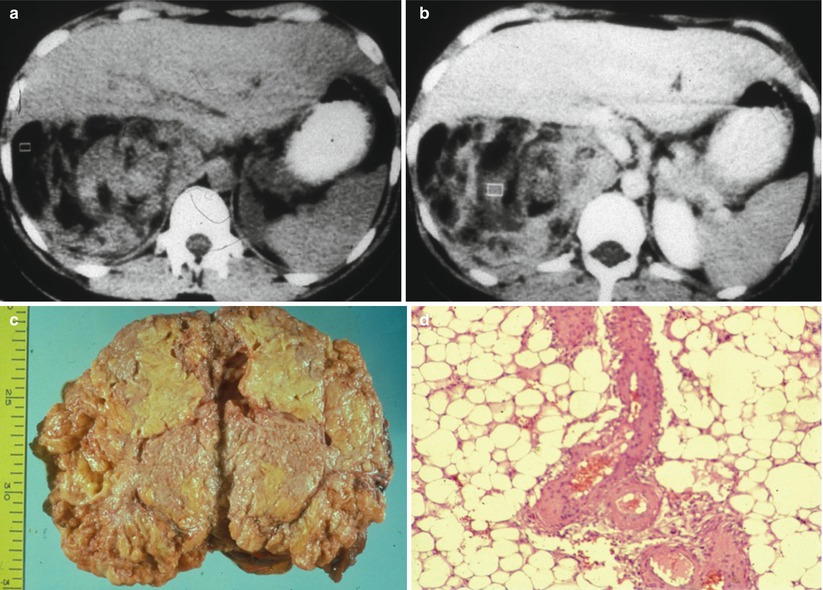
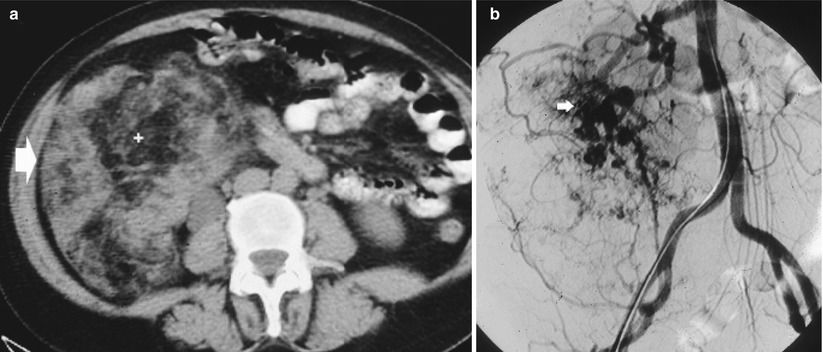
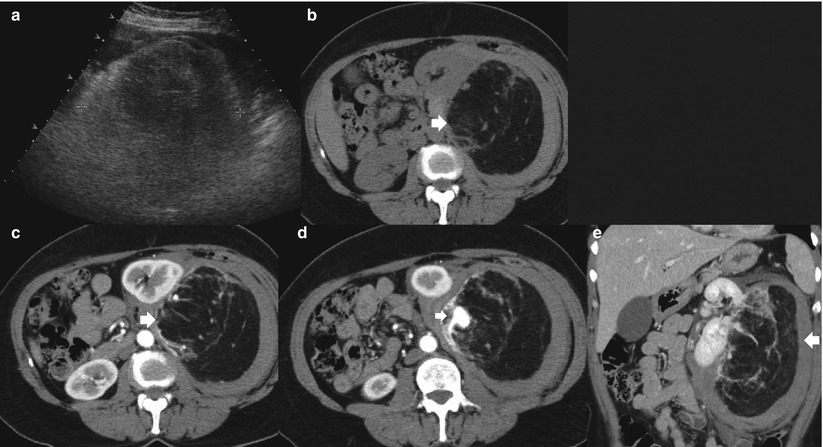
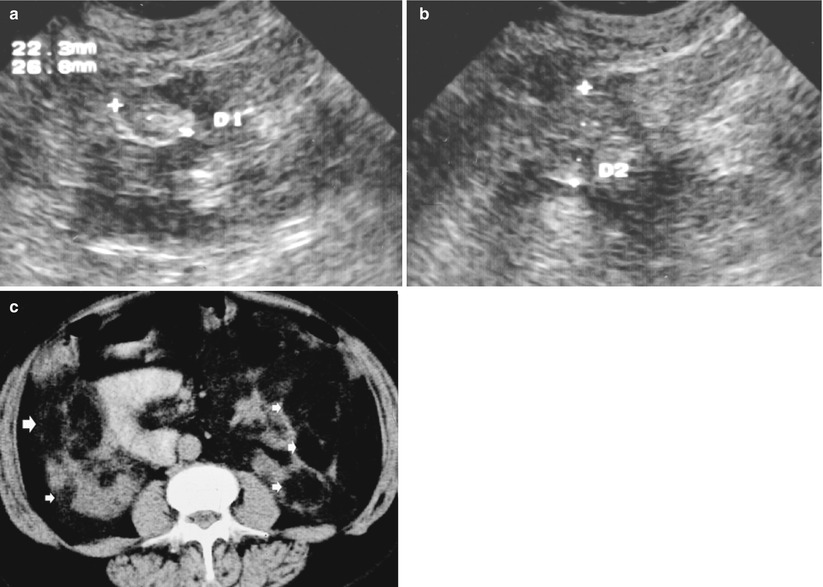
Fig. 6
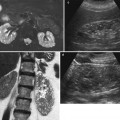
Large angiomyolipoma with prevalent macroscopic fat and solid component at CT. Renal angiomyolipoma presents a prevalent macroscopic fat component hypodense at unenhanced CT (a) with heterogeneous contrast enhancement at contrast material-enhanced CT and evidence of hyperdense soft tissue (b). The gross specimen (c) reveals the adipose yellowish component. The microscopic specimen (d; hematoxylin and eosin, original magnification ×40) confirms the prevalent adipose component consisting of large foamy cells
Fig. 7
Giant angiomyolipoma. (a) Renal angiomyolipoma (arrow) presents a prevalent fat macroscopic component hypodense at nonenhanced CT. (b) Multiple intralesional aneurysms are evident on digital subtraction angiography
Fig. 8
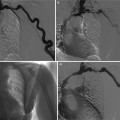
Giant angiomyolipoma. (a) Renal angiomyolipoma (calipers) appears hyperechoic on gray-scale US due to the prevalent fatty component. (b) The angiomyolipoma (arrow) presents a prevalent fatty macroscopic component hypodense at nonenhanced CT. (c–e) The same lesion (arrow) presents an intralesional aneurysm (small arrow) on contrast-enhanced CT without any other significant enhancement both on the transverse (c, d) and coronal planes (e)
Fig. 9
Bilateral angiomyolipomas (arrows) of different sizes in a 25-year-old patient with tuberous sclerosis. Gray-scale US, transverse (a) and longitudinal scan (b). Multiple hyperechoic lesions (calipers) are evident on both kidneys. (c) Contrast-enhanced CT. Multiple hypodense lesions (arrows) on both kidneys with an evident fat density
On MR imaging, the fatty portion of an angiomyolipoma is hyperintense to the renal parenchyma on T1-weighted images, while the angiomyomatous solid component is hypointense (Israel 2006). According to the prevalence of the different intratumoral components, frequently evident on angiomyolipomas ≥3 cm in diameter, renal angiomyolipomas may appear hyper-, iso-, or hypointense to the adjacent renal parenchyma on T2-weighted sequences and hypointense on T1- and T2-weighted sequences with fat saturation – SPIR, SPAIR, or STIR sequences (Figs. 10, 11 and 12). However, other renal masses including hemorrhagic–proteinaceous cysts and RCCs that contain hemorrhage may have similar signal characteristics and may appear hyperintense on T1-weighted images (Israel et al. 2005). Therefore, to establish the presence of macroscopic fat within a renal mass, obtaining frequency-selective fat-suppressed T1-weighted images and comparing them with nonfat-suppressed T1-weighted images are necessary. The most reliable demonstration of macroscopic fat within an angiomyolipoma can be achieved by comparing images obtained with the same imaging parameters before and after applying a selective fat-suppression pulse (Pedrosa et al. 2008) (Figs. 10, 11 and 12).
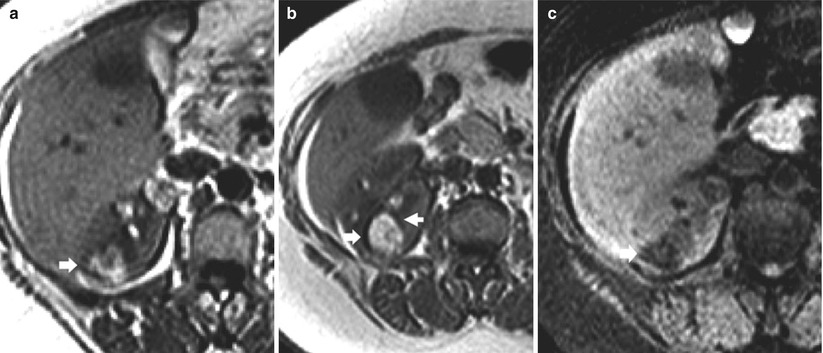
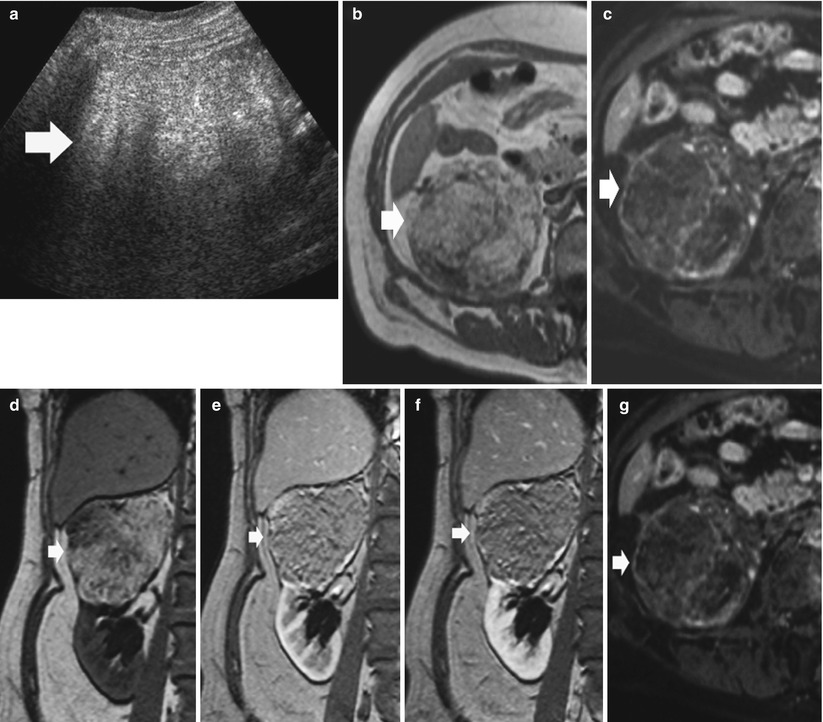
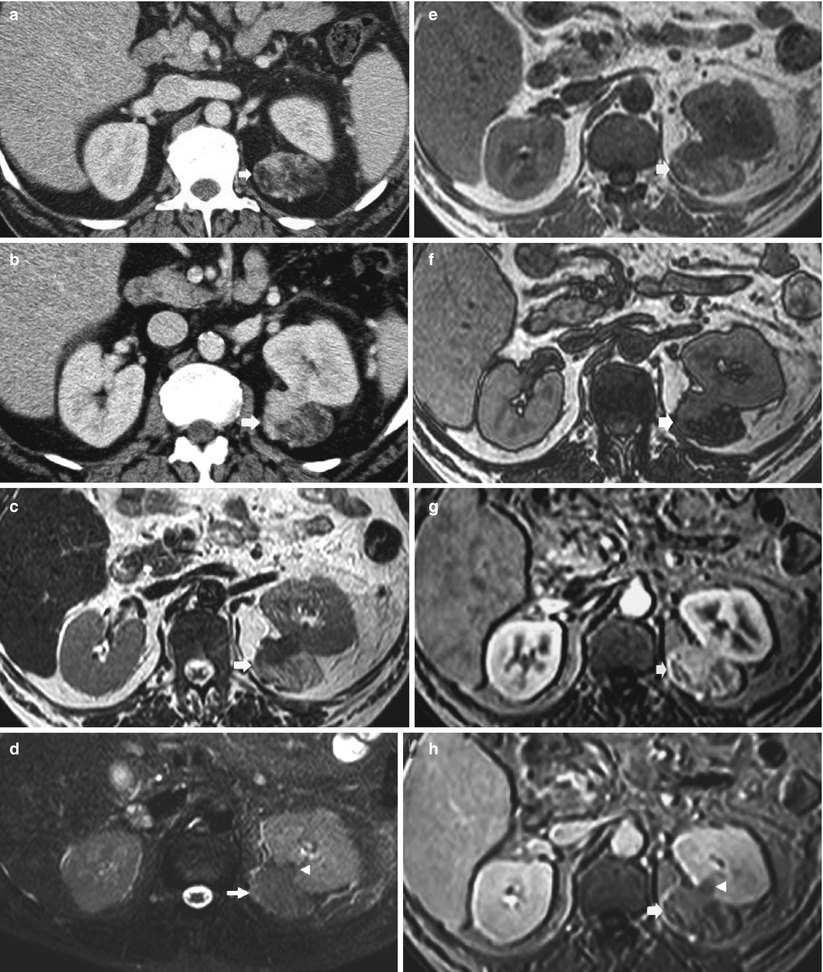
Fig. 10
Large angiomyolipoma with macroscopic fat component on MR. (a) Axial T1-weighted turbo spin-echo sequence. A large hyperintense renal mass (arrow) is identified on the right kidney. (b) Axial opposed-phase T1-weighted MR image. India ink artifact (arrows) is present at interface of the renal mass in the kidney, diagnostic of angiomyolipoma. (c) Frequency-selective fat-suppressed T1-weighted sequence, spectral presaturation with inversion recovery (SPIR). The renal mass shows a clear decrease in signal intensity due to the suppression of the macroscopic fat component
Fig. 11
Giant angiomyolipoma with prevalent macroscopic fat component at MR imaging. (a) Gray-scale ultrasound shows an homogeneous hyperechoic renal mass on the upper pole of the right kidney. (b) T1-weighted turbo spin-echo sequence. Transverse plane. The renal mass appears hyperintense (arrow). (c) Frequency-selective fat-suppressed T1-weighted SPIR sequence. The renal mass shows a clear decrease in signal intensity due to the suppression of the macroscopic fat component. (d–f) Breath-hold frequency-selective fat-suppressed spoiled gradient echo (SPGR) T1-weighted sequence obtained before (d) and after Gd-based agent injection (e, f). Low contrast enhancement is identified. (g) T1-weighted SPIR sequence after Gd-based contrast agent injection. The renal mass shows a clear decrease in signal intensity due to the suppression of the macroscopic fat component with evidence of contrast enhancement in the vascular component
Fig. 12
Large angiomyolipoma with fatty and solid tissue intratumoral components visible on CT and MR imaging. (a, b) Contrast-enhanced CT, nephrographic phase. A solid exophytic renal mass (arrow) is evident on the left kidney. The renal mass presents a prevalent fatty component and a solid enhancing component. (c–h) MR imaging, axial plane. The signal of the macroscopic fatty component appears hyperintense on T2-weighted turbo spin-echo sequence (c) and is suppressed on T2-weighted spectral adiabatic inversion recovery (SPAIR) sequence with fat suppression (d). The microscopic fat component appears hyperintense on inphase (e) and hypointense on opposed-phase (f) T1-weighted gradient recalled echo sequence. (g, h) Gadolinium-enhanced frequency-selective fat-suppressed spoiled gradient echo (SPGR) T1-weighted sequence during corticomedullary (g) and nephrographic phase (h). The solid component presents diffuse contrast enhancement, while the fatty tissue component presents low contrast enhancement. There is also the evidence of wedge-shaped connection (arrowhead) of the renal mass with the renal parenchyma
The use of inphase and opposed-phase chemical shift MR imaging is helpful in the diagnosis of angiomyolipoma (Israel et al. 2005). The india ink artifact can be recognized on opposed-phase MR images as a characteristic sharp black line in fat–water (fat–muscle or fat–solid organ) interfaces (Earls and Krinsky 1997) (Fig. 13). Because most angiomyolipomas contain macroscopic fat, the india ink artifact will appear at the interface of the angiomyolipoma with the kidney (Fig. 13) or at the interface of the fatty and nonfatty portions of the mass (Fig. 14). The india ink artifact is due to the presence of fat and water protons within the same imaging voxel, resulting in signal loss at the periphery of areas of macroscopic fat. It occurs along the entire border of fat–water interfaces and not only in the frequency-encoding direction because it is a result of fat and water proton phase cancelation in all directions.
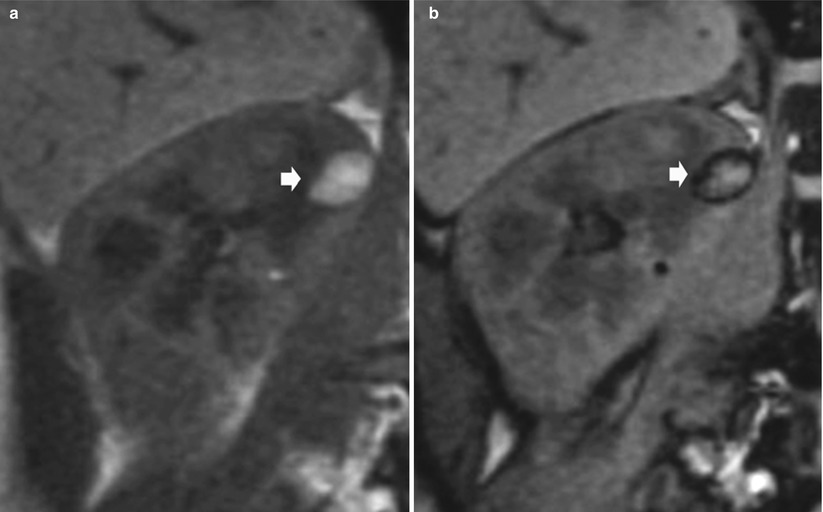
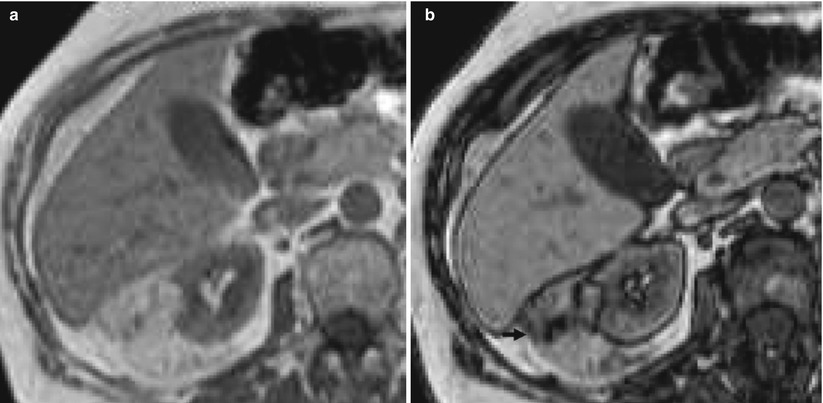
Fig. 13
Evidence of india ink artifact on inphase (a) and opposed-phase (b) chemical shift MR imaging in an angiomyolipoma with macroscopic fat component. The india ink artifact (arrow) appears at the interface of the angiomyolipoma with the kidney (Courtesy of Nicolas Grenier, Bordeaux)
Fig. 14
Evidence of india ink artifact on inphase (a) and opposed-phase (b) chemical shift MR imaging in an angiomyolipoma with macroscopic fat component. The india ink artifact (arrow) appears at the interface of the fatty and nonfatty portions of the mass (Courtesy of Catherine Roy, Strasburg)
Anyway, a signal intensity loss on out-of-phase MR images, indicative of microscopic intra-voxel fat, is not characteristic of angiomyolipomas, and a renal mass cannot be diagnosed as an angiomyolipoma solely on the basis of signal loss on out-of-phase MR images (Cohan et al. 2006; Pedrosa et al. 2008) since microscopic fat is present also in clear cell RCC. In fact, some renal cancers, particularly those of clear cell type, contain abundant intracellular lipid in addition to water which determines signal loss on out-of-phase (Outwater et al. 1997). However, by evaluating the location of the india ink artifact on opposed-phase chemical shift MR imaging, characterizing angiomyolipomas without the use of frequency-selective fat-suppressed T1-weighted images is possible (Israel et al. 2005). On opposed-phase chemical shift MRI, the presence of the india ink artifact at the interface of a renal mass with the renal parenchyma or within the renal mass is indicative of an angiomyolipoma, while the evidence of india ink at interface of mass with perinephric fat, indicating the absence of macroscopic fat, is more characteristic of RCC (Israel et al. 2005).
Opposed-phase chemical shift MRI has some advantages over frequency-selective fat-suppression techniques. At times, frequency-selective fat-suppressed sequences may have nonuniform fat suppression, and in this instance, the loss of signal within an angiomyolipoma may not be evident. In addition, at low field strengths, frequency-selective fat-suppressed sequences cannot be performed during a comfortable breath hold. Opposed-phase chemical shift MRI can be performed at low field strengths without adding to the examination time and is not dependent on field homogeneity; therefore, an angiomyolipoma can still theoretically be diagnosed with confidence (Israel et al. 2005). Contrast enhancement after gadolinium-based contrast agent injection is heterogeneous on the solid peripheral or central component sparing the fatty component (Figs. 11 and 12


Related posts:
Stay updated, free articles. Join our Telegram channel
Full access? Get Clinical Tree
