Specialized Imaging
DUAL-ENERGY X-RAY ABSORPTIOMETRY
Primer on Digital Imaging
The great majority of today’s imaging modalities construct digital information from the examinations. Traditional analog modalities such as x-ray use an image receptor composed of film and screen combinations housed in a cassette requiring chemical processing to procure images. Digital systems have numerous advantages. Digital data are stored on computers, which can be accessed from any location through secure networks, thus allowing for off-site and long-term storage. The portability of digital data allows patient images to be forwarded directly or carried to other physicians on data discs. A significant advantage of digital data is that it allows postprocessing, such as changing grayscale, edge enhancement, and image reconstruction.
The fundamental unit of digital information is the binary digit, or “bit.” A bit refers to the ones and zeros that make up a binary number. A single one or zero makes one bit of information, which is a binary or base 2 system. Eight bits make up a “byte” of information. Two or more bytes make up a “word” of information. Commonly encountered word lengths are 16 bits (a 2-byte word), 32 bits (a 4-byte word), and 64 bits (a 4-byte word). The large numbers of bits, bytes and words of information that a computer manipulates results in prefixes such as kilobyte, megabyte, and terabyte. Using the base 2 system, a kilobyte of data is 2 raised to the 10th power (210 ) or 1024 bytes of information. Similarly, a megabyte of data is 2 raised to the 20th power (220). Most radiology departments use terabyte computer drives that store 240 bytes of data.
Digital graphical information is displayed as picture elements, or “pixels.” Each pixel is assigned a single numerical value denoting a shade of gray if a black and white image is stored or color if a color image is stored. The pixel values represent image attributes such as x-ray attenuation, echo intensity, and magnetization for imaging system such as x-ray, computed tomography (CT), ultrasonography, and magnetic resonance imaging (MRI), respectively. This data is located in an XY coordinate system which is ultimately displayed on a computer monitor. The number of bits in each pixel (referred to as bit depth) indicates the amount of information (or brightness levels) contained within each pixel. The more bits per pixel, the more possible gray shades. Whereas an image with 8-bit depth (28) will have 256 shades of gray, an image with 14-bit depth (214) will have 16384 shades of gray. The matrix of the image is the number of pixels in the x, y dimension of the image. Image resolution can be pictured as placing a mesh over an image with each square representing a pixel. As the number of pixels increases within a given field of view (image), image resolution improves. A CT image is typically composed of a matrix of 512 × 512 pixels with a bit depth of 10, or 1024 shades of gray. To store this image requires 0.5 megabytes of space. A typical digital x-ray image composed of 3000 × 4000 pixels with a bit depth of 12 requires 22.88 megabytes of space.
Magnetic Resonance Imaging
History
Magnetic resonance imaging was developed from nuclear magnetic resonance (NMR) technology that chemists originally used to evaluate the composition of laboratory chemical samples. Use of NMR began in 1946 when Felix Bloch proposed that nuclei could behave as small magnets in the presence of a strong magnetic field.1 Nearly three decades later, Raymond Damadien used similar technology as an imaging device when he produced a crude image of a rat tumor.2 Damadien later produced a successful body image on July 3, 1977, with his MRI equipment, Indomitable, now housed in the Smithsonian.
Further developments in MRI occurred when Lauterbur in 1973 proposed that using magnetic field gradients would be helpful in constructing data from NMR signals. The clinical application of MRI was rapid. General Electric introduced the first high-field (1.5 tesla [T]) in the early 1980s. By the mid 1990s, there were in excess of 10,000 MRI scanners worldwide. From statistics published by the Organization for Economic Cooperation and Development (OECD) 91.2 MRI scans are performed per 1000 population in the United States, leading to approximately 28,000 MRI scans each year.
Magnetic resonance imaging offers significant advantages over other diagnostic imaging modalities. In particular, MRI provides superior tissue contrast compared with CT and conventional radiography. Whereas the image contrast achieved in x-ray and CT is based on x-ray attenuation properties, MRI analyzes the magnetic spin properties of tissue nuclei, principally hydrogen. Analysis of this information results in improved sensitivity to subtle differences among tissue types than is possible with imaging systems based on x-ray attenuation. MRI is not only used to evaluate anatomy and pathology, but with appropriate hardware and software technology, it can also investigate organ function, biochemistry, and real-time brain function.
Notably, MRI does not use ionizing radiation and therefore is not associated with its related potential harmful effects. MRI instead uses high magnetic fields and suitable radiofrequencies to analyze magnetic spin properties of hydrogen nuclei. During the past century, the potential ill effects of magnetic and radiofrequency (RF) fields have been a great concern. The specific issues raised by investigators have focused on changes in enzyme kinetics, nerve conductivity, effect on macromolecules and subcellular components, cardiac function, magnetohydrodynamic effects, membrane transportation, blood sedimentation, genetic effects, and other bioeffects. Reviews of this literature are available for interested readers.3–5 In general, MRI examination is without significant health risks, although the research has not categorically shown that MRI is absolutely safe. Consequently, MRI examinations are only conducted on patients when there is an appropriate need.
Magnetic Resonance Imaging Principals and Equipment
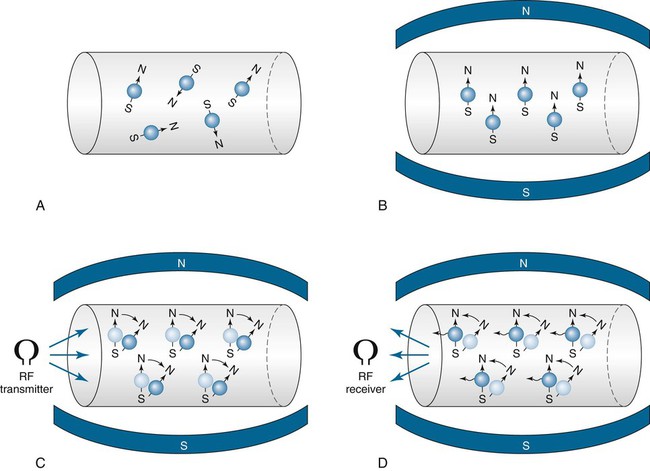
Electromagnetism causes a wire carrying an electrical current to produce a magnetic field about it. Similarly, a magnetic field forms about atoms such as hydrogen because they are composed of electrons in motion about a nucleus. These small magnetic fields create a magnetic moment but have no established orientation. When nuclei are placed in a strong magnetic field, the magnetic moments associated with the hydrogen proton align with the large external magnetic field. This results in a small net magnetization of tissue in the direction of the main magnetic field.
Two broad categories of MRI magnets exist. An electromagnet is created when a current is conducted through coils of wire. Conversely, a permanent magnet is composed of ferromagnetic materials.
On casual observation, an MRI scanner appears similar to a CT unit. Each is composed of a gantry, a couch for the patient, and is controlled by a computer system. The gantry of an MRI unit is longer than that of a CT scanner and contains a large magnet that creates magnetization of the hydrogen nuclei within the patient. Other MRI components include RF coils and magnetic field gradients that collect and spatially organize data into slices.
The MRI suite is specially designed to house this equipment. The computers are usually placed in an air-conditioned room. The MRI room, doors, and patient viewing window are specially shielded with a copper mesh (Faraday cage) to prevent aberrant RF from degrading image quality. Magnetic field shielding may also be used.
Three principal types of magnets are used to generate the magnetic fields for MRI6:
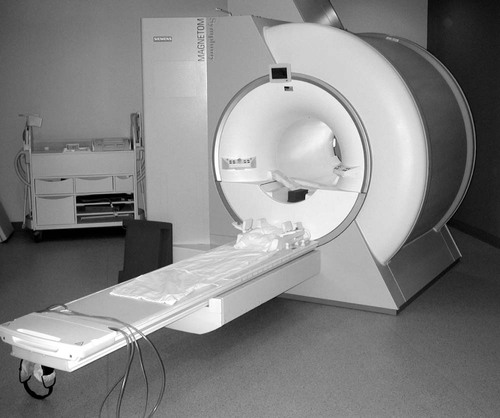
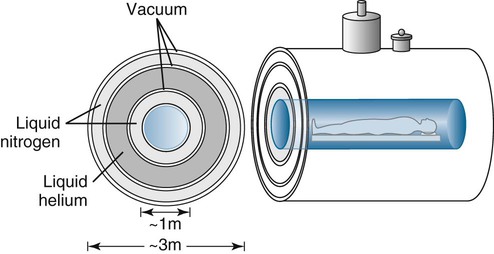
1. Superconducting magnets. Superconducting magnets (Fig. 2-1) consist of magnetic coils supercooled by cryogens such as liquid helium or liquid nitrogen to temperatures as low as 4° Kelvin (Fig. 2-2). Supercooling the magnets dramatically decreases electrical resistance, which decreases operational temperatures. The primary advantage of using superconductive magnets is that they can attain high and stable magnetic field strengths. At such low temperatures, the primary magnet no longer requires a constant power supply, which means that the magnetic field can only be interrupted by ramping down the magnet by expelling (quenching) the cryogens. The cryogens must be periodically replenished, representing an ongoing cost. Superconducting magnet systems are the most popular because they achieve good signal-to-noise ratio (SNR). They also tend to have a large peripheral (fringe) field, which can be a safety issue. Superconducting magnets are generally used in MRI scanners of 0.5 T and greater.
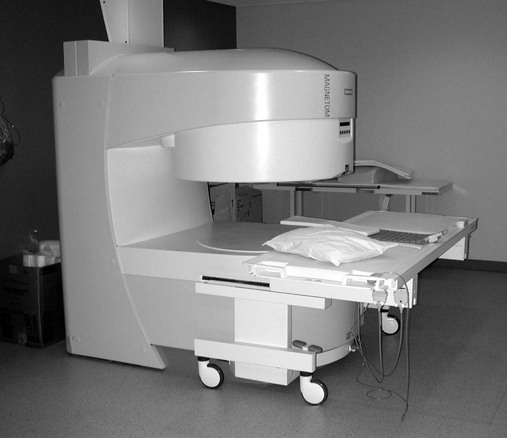
2. Permanent magnets. Permanent magnets (Fig. 2-3) are constructed from individual bricks of ferromagnetic material. These scanners can be constructed with an open design (open MRI), helping patients feel less claustrophobic. These systems are not able to attain the high magnetic fields of superconductive systems and have average field strengths of approximately 0.2 T or less. Besides lessened claustrophobia, other advantages of low-field MRI include a small peripheral (fringe) magnetic field, minimal power consumption, and no need for cryogens.
3. Resistive electromagnets. This MRI system is an electromagnet in which large amounts of power are conducted through solenoidal loops of wire but is not supercooled. These systems tend to have magnetic field strengths of 0.3 T or less. Although these systems may be of lower initial cost than superconducting magnets and of lower weight than permanent magnets, the power consumption is high. These systems tend to be the least popular of the MRI designs.
Magnetic field strengths are measured in units of gauss (G) and T. One tesla is equal to 10,000 gauss. In comparison, the earth’s magnetic field is approximately 0.5 gauss. Consequently, a 1.5-T MRI magnet is about 30,000 times the strength of the earth’s magnetic field. The strength of electromagnets used to pick up cars in junkyards (1.5–2 T) generally is the same field strength of an MRI magnet.
Magnetic resonance imaging equipment is available with varying field strengths. Generally, low-field MRI is equipment that has a magnetic field strength under 0.2 T. Mid-field MRI is between 0.2 and 0.6 T. High-field MRI is 1 T and above. Considerable discussion can be found in the literature as to which magnet system (low-field versus high-field) is “better.” High-field MRI equipment does produce high-resolution images with improved SNR; however, advances in computer technology and imaging sequences have made mid- and low-field MRI competitive, especially for musculoskeletal imaging. Furthermore, high-field systems are prone to motion and chemical shift artifacts. “Open MRI” facilities are of the low-field variety because the architecture of these systems is most compatible with permanent magnet designs (see Fig. 2-3). Newer high-field MRI bore magnets are allowing “semi-open” designs, which also decreases claustrophobia. MRI systems have also been designed to allow upright examinations, which is helpful in evaluating such conditions as dynamic spinal canal stenosis and the effects of weight bearing on disc herniations.
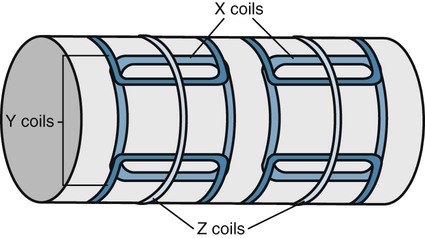
Gradient magnetic coils are located within the gantry and allow “slicing” of the patient’s anatomy along sagittal, coronal, or transverse planes (Fig. 2-4). By simultaneously activating two coils, oblique imaging can also be accomplished. This represents a significant advantage of MRI in cross-sectional imaging because any slice direction can be obtained directly from the patient. This is not usually accomplished with CT, which primarily provides transaxial sequences that require image reconstruction for other plane lines of image presentation. The gradient coils switch on and off very rapidly during the examination, producing the characteristic, sometimes quite loud, tapping noise associated with an MRI scan.
Radiofrequency coils are placed on the patient’s anatomy under investigation. The coils transmit and receive RF information, localizing the hydrogen nuclei. The RF coils come in various designs adapted to image specific regions of anatomy (Fig. 2-5). A body coil is integrated into the scanner and is not seen. Head and surface coils, being smaller in size and closer to the anatomy being imaged, provide improved SNR.
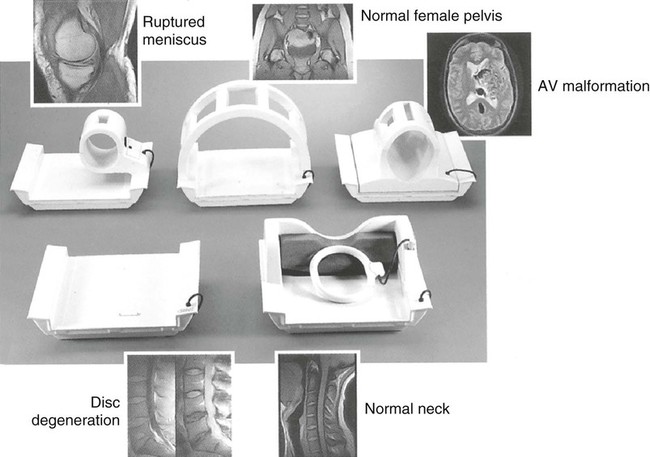
Image Production
Magnetic resonance imaging depends on four principle steps: creating a transient state of magnetism within the body, pulsing the imaging region of interest with a defined RF, ceasing the RF pulses, and recording the RF transmissions from the region of interest and constructing cross-sectional imaging data.
Magnetic resonance image production requires spatial localization of hydrogen atoms within body tissues. Certain atomic nuclei, including hydrogen, contain an odd number of protons or neutrons, which in the presence of an external magnetic field exhibit magnetic properties (magnetic moment) and produce a phenomenon known as a gyromagnetic ratio. It is these properties that make hydrogen amenable to imaging. Hydrogen is particularly suitable because it is plentiful, representing 80% of all atoms found in the body.
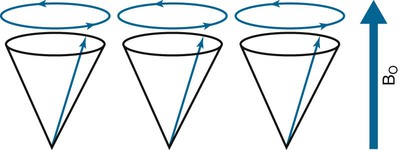
Hydrogen protons have magnetic properties (nuclear spin) such that they behave like tiny rotating magnets. In the presence of a strong external magnetic field, the hydrogen magnetic field either aligns parallel to or opposite to the direction of the external magnetic field producing a net magnetization of tissue. Not only do the hydrogen magnetic fields align to the main magnet, but they also spin about the magnetic field like gyroscopes. This behavior is termed precession. The rate or frequency of precession is intimately dependent on the element (in this case hydrogen) and the strength of the external magnetic field. This is referred to as the gyromagnetic ratio and is measured in megahertz/Tesla (MHz/T). When hydrogen is placed in a magnet of 1 T, it assumes a characteristic precessional frequency of 42.6 MHz. The relationship between the gyromagnetic ratio and magnetic field strength is described by the Larmor equation and forms the basis for MRI. The following is the Larmor equation:
Frequency of precession=Gyromagnetic ratio×Strength ofthe external magnetic field

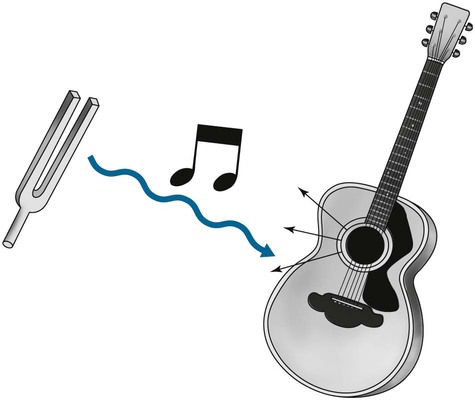
To obtain images, an RF pulse identical to the Larmor frequency of precession is directed into the patient. For instance, if the hydrogen nuclei have precession frequency of 42.6 MHz, then these nuclei magnetic fields can only be “excited” (absorb energy) by a 42.6-MHz RF pulse. A similar but more easily understood phenomenon occurs if an appropriately keyed tuning fork (e.g., in the key of D) is placed next to a guitar. The vibration from the tuning fork propagates through air to cause selective vibration of just the D string of the six strings (Fig. 2-6). This is the concept of resonance.
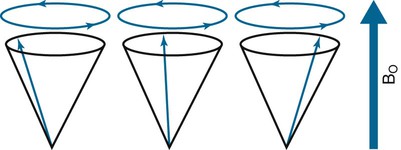
When pulses are transmitted from the RF coils, the hydrogen proton magnetic fields deviate from the plane of the main magnetic field and begin to precess with the same frequency and in phase (see Figs. 2-7 and 2-8). When the RF pulse is turned off, the excited nuclei undergo relaxation back to equilibrium. During relaxation, the hydrogen nuclei lose energy by emitting the absorbed energy as RF, which is detected by the surface coils (antennae) and which transmits the data to the MRI computers. Essentially, tissue containing hydrogen becomes a RF source that can be detected. This information is measured and processed to obtain an MR image.7 The dynamics of MRI can be summarized in four steps: resting, magnetism, excitation, and relaxation (Fig. 2-9).
Obtaining cross-sectional anatomy slices is accomplished by energizing the gradient magnets. The gradient magnets place a variable magnetic field (gradient) across the patient in an X, Y, or Z direction. Ultimately, images are constructed through use of highly complex mathematical formulae known as Fourier transformations.
Imaging Techniques
As presented in Chapter 1, the production of a radiographic image depends on two principal controls. These controls are kVp (peak kilovoltage) and mAs (milliampere-seconds), which the radiographer can use to alter the appearance of an image.
In MRI, image appearance is manipulated by controlling the timing of the RF pulses sent from the imaging coil (repetition time [TR]) and by detecting the echo of the signal emanating from the patient (echo time [TE]). This particular technique represents one of the most commonly used sequences and is known as spin echo. These pulse sequences occur over milliseconds of time. Typically, the RF pulses are designed to “flip” or reorient the hydrogen magnetic field vectors to 90 or 180 degrees from the resting position such that the associated emitted radiofrequencies can be detected by the antenna system within the RF coils. The emitted MRI signal received by the surface coil is used to construct an image of the tissues under study. The appearance of the image reflects the intensity of the emitted signal from the examined body tissues. High signal intensity appears bright on the image; low signal intensity appears dark.
Signal intensity depends on multiple factors, including the population of hydrogen atoms and the environment in which the hydrogen are found. How hydrogen is “bound” within tissue also influences the MRI signal. Hydrogen that is tightly bound (e.g., within ligament) emanates minimal signal. Hydrogen that is loosely bound (e.g., within fluid) has the potential to exhibit a very bright signal with the appropriate MRI technique. The capacity to evaluate hydrogen within varying chemical and structural environments is accomplished by manipulating T1 and T2 relaxation times and represents one of the most significant advantages of MRI.
T1, T2, and Proton Density Sequences
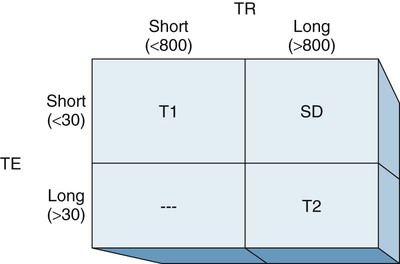
A significant advantage of MRI compared with other imaging techniques is that tissue contrast is a prominent component of the images. This occurs both as a result of the differences in hydrogen content within tissues and also relates to a phenomenon known as T1 and T2 relaxation. It is the significant differences in relaxation that creates pronounced differences in organ and tissue contrast. These relaxation times are created by varying the repetition of RF pulses (TR) and the recording time of the emitted signal (TE). Overall, the MRI image can be associated with the population of hydrogen (proton density) or emphasized to either the T1 or T2 relaxation properties of the tissue (Figs. 2-10 and 2-11; Table 2-1).
Medium
Dark
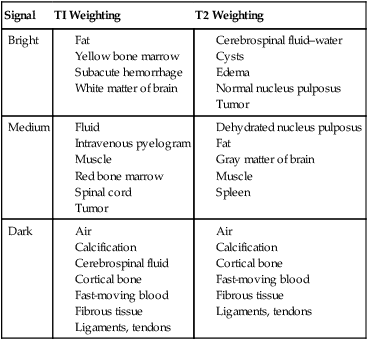
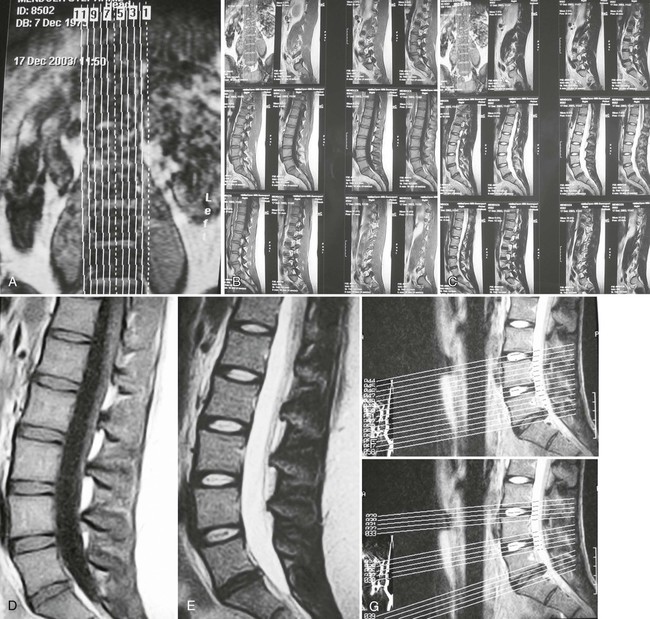
T1 and T2 sequences are most commonly derived from spin-echo techniques and constitute the most commonly used technique in MRI. These images can be recognized because T1 images typically demonstrate high signal from fat and low signal from fluid. Conversely, T2 images present high signal from fluid. Because the T1 sequences are constructed with relatively low TR and TE times, these images are less noisy than T2 sequences; subsequently, the anatomy presentation is high detail. The T2 sequences are ideal for localizing pathology with commonly associated collections of edema and resulting high signal.
For illustration purposes, a long TR is one that lasts 800 to 1000 msec, and a long TE exceeds 30 to 50 msec. Conversely, a short TR is often less than 800 msec, and a short TE is often less than 30 msec.
Proton density images, also known as balanced images, are an intermediate image between T1 and T2 with the tissue contrast being a function of the number of protons within each tissue. These images are constructed from long TR and short TE sequences.
Conventional spin-echo techniques (T1, T2, proton density) take moderate time to complete. Fast spin-echo sequences (FSE) allow for images to be obtained in less time.
Alternative pulse sequences also are available and are used in certain clinical circumstances to enhance the delineation of pathologic processes. Among these are:
1. Gradient echo. A pulse sequence in which protons are “flipped” less than 90 degrees. As the flip angle tends toward 0 degrees, the images create an increase in signal intensity from fluids, appearing with more T2-weighted emphasis. Because traditional spin-echo imaging requires a 90-degree pulse, these low flip angle sequences are considerably faster than conventional spin-echo sequences, especially when high fluid signal intense images are needed. Variations on the gradient echo sequences are also helpful in acquiring three-dimensional data sets from which multiplanar images can be formatted. Although the sequences are particularly useful in localizing collections of edema, they are less useful in delineating bone marrow pathology. With the advent of FSE techniques, gradient echo sequences are being used less frequently.
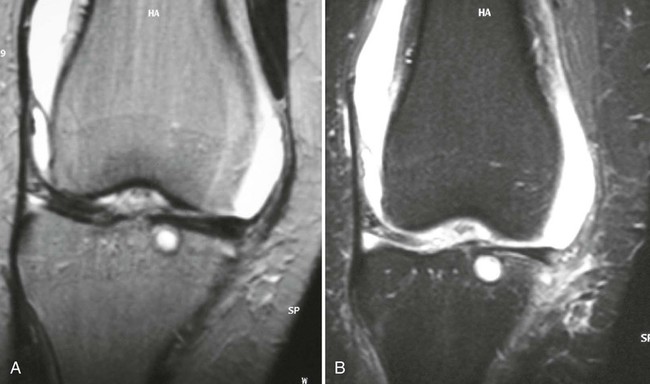
2. Fat suppression techniques. These are variously known as STIR (short tau inversion recovery), fat saturation, and fat suppression pulses. Pulse sequences used for fat suppression, are those in which a relatively short inversion time is used to null the signal from fat while maintaining water and soft-tissue signal. These imaging sequences are particularly helpful in evaluating bone marrow pathology, including subchondral cysts (Fig. 2-12). Subtle bone pathology can be masked by the relatively high intensity of fat both on TI and T2 sequences. When the fat signal is suppressed, small collections of bone marrow edema are more readily evident. Fat suppression sequences are almost routinely obtained when examining musculoskeletal joints for bone marrow pathology such as avascular necrosis or tumor.
Patient Preparation
The length of the MRI examination can vary from 30 to 90 minutes. The length of the examination depends on the imaging sequences, which are gathered over 2- to 10-minute periods. Because of these prolonged examination times, it is critical that patients lie absolutely still for the duration of each imaging sequence. Referring physicians may find it beneficial to visit the MRI facility so they can adequately explain the procedure to their patients. A well-informed patient is less likely to be overly anxious about the examination.
Patients should be asked to dress in comfortable clothing (e.g., a sweat suit) and without metal artifacts (e.g., jewelry, watches, keys). These objects can result in suboptimal image quality because they disturb the quality of the magnetic field. Credit cards should not be brought into the MRI facility because the large magnetic field erases the magnetic codes. The patient may be asked to don a hospital gown, particularly with high-field scanners to reduce risk associated with metallic artifacts. Unlike CT examinations, which are commonly conducted with contrast media, there is usually no need for special preparations or diet restrictions.
The patient is placed on the MRI table at the beginning of the examination. Surface coils, which transmit and receive RF data, are placed on the patient in the region to be examined. After this is accomplished, the patient is glided into the MRI gantry. The technologist indicates to the patient when each of the examination sequences is to begin. The patient recognizes that the examination is ongoing by hearing a tapping noise coming from the MRI equipment. This comes from the gradient coils that are intermittently energized to create the cross-sectional images. Some MRI facilities also provide earphones for noise suppression, with a choice of music.
Claustrophobia is the most common concern of those undergoing MRI examination and may occur in up to 5% of patients. Although reassurance and positive interaction with the technologist works for most patients, a mild tranquilizer can be effective in alleviating high anxiety. Sometimes placing the patient within the scanner in a prone rather than supine position also reduces claustrophobia.
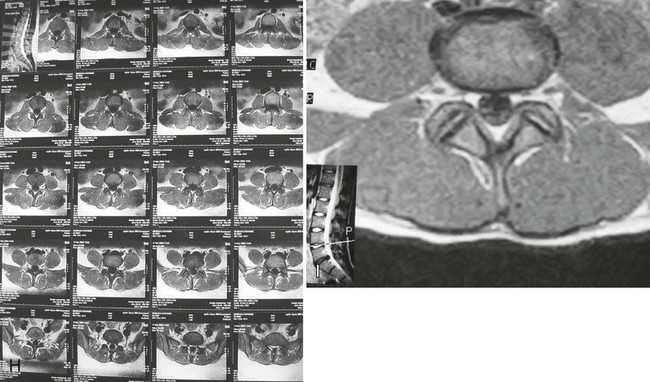
A typical lumbar spine MRI examination begins with a coronal preliminary image, termed a scout, localizer, or plan scan (see Fig. 2-11). On this image, localizer lines are superimposed, corresponding to the subsequent sagittal T1 and T2 sequences. The sagittal sequences usually extend from the left to the right neuroforamen depending on the MR equipment and the radiologist’s preference. The direction of the sagittal slices always needs to be cross-checked before beginning interpretation. The middle sagittal sequence is used to “plan” the subsequent axial images. Axial images can be presented in two formats. One format is to have each slice parallel to each of the disc interspaces, most commonly at L3, L4, and L5, with the slices being angled to each disc plane line individually. The other format is to have a contiguous set of sequences extending from approximately the L3 through S1 levels. As depicted in the enclosed examples, whereas the T1 sequences are noncontiguous, the T2 sequences are contiguous. The number of slices obtained is time dependent; therefore, it is not common to evaluate the upper lumbar discs unless there is a probability of pathology specific to these regions. Similar protocols are used to evaluate other joint regions, including the shoulder and knee.
Safety
The MRI examination is one of the least invasive studies in diagnostic imaging because there is no radiation dose. Safety issues, however, can be related to the high magnetic fields, generation of noise, claustrophobia, and complications arising from administration of MRI contrast agents.8
Many medical and biostimulation implants can be contraindications or relative contraindication to an MRI examination. A thorough history must be obtained from the patient before the MRI examination commences, with particular attention to a history of surgical intervention or exposure to metals (Box 2-1). Generally, patients with pacemakers or other implanted electronic devices (including cochlear implants) cannot be examined. Many intracranial aneurysm clips can torque or twist in a magnetic field; therefore, MRI examinations are contraindicated in patients with vascular clips within the brain. Some types of heart valves are affected as well; however, this torque is usually less than the stress that normally occurs as a result of blood flow. As a result, the presence of heart valves is not necessarily an absolute contraindication for an MRI examination. Frequently published literature, texts, and websites are available as resources to MRI facilities as a means of identifying biomedical implants that may place patients at risk during examination.9
Orthopedic devices, although not usually contraindications to an MRI examination, can lead to considerable image degradation by causing alteration to magnetic field homogeneity. In all circumstances, the presence of surgical devices should be made known to the MRI staff and radiologist. Especially with musculoskeletal MRI, patients should be encouraged to supply radiographs of the region to be examined because correlation of the MRI examined with the x-rays can be extremely helpful to exclude metallic foreign bodies and aid in image interpretation.
Another potential hazard relating to MRI examinations relates to ferromagnetic objects being attracted with high velocity to the MRI unit, creating a projectile effect. This has received attention in circumstances in which ferromagnetic objects, including oxygen tanks, have been attracted to the MRI magnet.10 These objects may be able to reach lethal speeds by the time they intercept the magnet. Reports include cleaning crews inadvertently entering the MRI suite with floor polishers that were dramatically wrested from the operator and pulled into the magnet bore. This represents an expensive situation in a high-field scanner both from the damage and also from the need to quench the magnet. Magnet quenching requires draining the cryogens to decrease the magnetic field in an attempt to remove ferrous artifacts. A somewhat unusual issue for concern relates to tattoos. Tattoos with metallic or ferromagnetic pigments can distort MRI images. Skin heating can result from electromagnetic induction across the tattoos from the RF pulses.11
Substantial noise can be created through activation of the gradient magnets, especially with high-field MRI units. Noise can be alleviated through technology improvement on newer MRI units. Some facilities provide ear protection inclusive of especially designed magnetic and RF field shielded stereo music headsets.12
Cryogens, including liquid helium and nitrogen, are used to enable superconducting capabilities of the electromagnetic coils. A relatively rare event, known as quenching, occurs when the cryogen is rapidly vented from the MRI unit, external to the MRI building as a process of automatically shutting down the magnetic field. An even rarer event is for the cryogens to be vented into the MRI suite, which may result in asphyxiation of the occupants. MRI facilities are now designed with pressure relief mechanisms and oxygen monitors in addition to the quench piping.
Although a commonly discussed issue with MRI, claustrophobia is a relatively rare cause of failed examinations. Importantly, claustrophobia can be significantly controlled through patient education before the examination.13 Newer MRI high-field systems are available with substantially wider and shorter bores, which contributes to patient comfort and a reduction in claustrophobic events.14 On rare occasions, patients may require sedation. Overall patient satisfaction with the MRI examination can be enhanced by the referring physician and the imaging facility thoroughly explaining the clinical need for the examination and outlining the experience the patient is most likely to undergo.
Magnetic Resonance Imaging Contrast Agents
Magnetic resonance imaging can display human anatomy by relying on the inherent contrast of the body’s tissues afforded by the Tl and T2 relaxation times. On occasion, however, and under certain clinical circumstances, an artificial contrast medium may be necessary.
Gadolinium-based pharmaceuticals are the most frequently used contrast agents in MRI examinations. Most commonly, the contrast agent is delivered by injection. Gadolinium functions by shortening the T1 relaxation of tissues, resulting in pathologic tissue presenting with relatively high signal intensity on these T1 sequences.15 Gadolinium is especially useful in detecting various central nervous system pathologies such as tumors, infection, and multiple sclerosis in which there is a breakdown of the blood–brain barrier. Patients with failed low back surgery commonly require gadolinium to differentiate recurrent disc herniation from scar formation. As a free ion, gadolinium is highly toxic but is considered generally safe when chelated. Chelated gadolinium, however, is associated with a relatively unusual but severe complication, nephrogenic systemic fibrosis (NSF).16 Patients with poor renal function are considered to be higher risk for NSF. Generally, MRI contrast media has proven safer than the iodinated contrast agents used with radiography and CT.
Magnetic Resonance Arthrography
Magnetic resonance imaging provides significant detail regarding joint anatomy. Limitations of the procedure include an inability to resolve small intraarticular abnormalities. On occasion, pathologic and normal anatomy present with similar signal intensity. Postoperative anatomy can also be confusing on conventional MRI sequences. Although effusion from the joint abnormality can improve ability to discern internal joint anatomy, intraarticular joint enhancement is often needed.
Magnetic resonance imaging arthrography is an examination of a joint after the injection of gadolinium contrast media and is referred to as direct MRI arthrography. Gadolinium improves delineation of the internal joint anatomy through the distension of the joint and by providing contrast of the synovial fluid. The intraarticular pressure associated with the distension also forces the contrast medium into pathologically abnormal recesses, sometimes not delineated with routine MRI examinations. Common indications for MRI direct arthrography include evaluation of shoulder and hip labral tears and of articular cartilage lesions. On occasion, MRI arthrography can help in differentiating rotator cuff partial from full-thickness tears when the contrast can be seen to enter the subacromial–subdeltoid bursa. Direct arthrography is also commonly used to evaluate the joint compartments of the wrist. Complications of direct arthrography are uncommon, with the most common being postprocedural decreased range of motion and pain.
Indirect joint arthrography involves delivering the contrast intravenously and then beginning the MRI examination at least 30 minutes later, sometimes after exercising the joint. This examination does not distend the joint, resulting in some limitation of joint evaluation. Additionally the degree of arthrographic effect depends on the volume of synovial fluid within the joint.
Magnetic Resonance Angiography
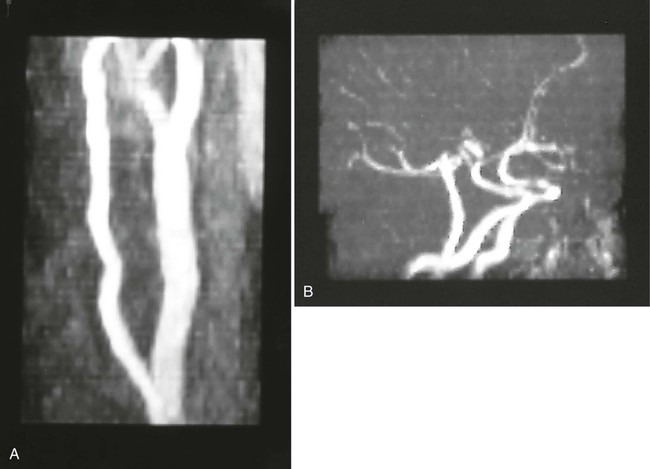
Magnetic resonance angiography (MRA) is an alternative to conventional angiography for evaluating vascular disease. A variety of specialized MRI techniques are used, including two- and three-dimensional time-of-flight sequences. Other techniques such as phase contrast angiography can also be used to generate flow velocity maps. Importantly, these types of MRI angiographic examinations can be done without intravascular contrast media (Fig. 2-13).
Functional Magnetic Resonance Imaging
Functional MRI (fMRI) is a procedure that measures neurologic activity within the brain. This is accomplished by evaluating oxygen levels through signal intensity alteration associated with deoxygenated hemoglobin in a techniques known as blood oxygen level–dependent (BOLD) contrast. In a typical fMRI examination, the patient is subjected to a series of repetitive tasks intermingled with rest during which the MRI images are repeatedly acquired. Appropriate computer processing highlights image pixels representing regions of neuronal activity.
Magnetic Resonance Imaging Comparison with Computed Tomography
Computed tomography acquires data by virtue of the inherent atomic number (density) of the tissue being examined. Compared with conventional plain film imaging, CT images do provide exquisite cross-sectional anatomy. Because CT image contrast depends on tissue atomic numbers, differences between anatomy, particularly of soft tissue, may be limited. In such circumstances, iodinated contrast administration is needed to differentiate such tissues. In MRI, tissue contrast is related to variations in tissue hydrogen density and rates of T1 and T2 relaxation. As a result, most MRI examinations do not require artificial contrast. MRI examinations of the lumbar spine for evaluation of disc herniation are usually accomplished with routine T1 and T2 axial and sagittal sequences without additional contrast. The T1 sequences create high-resolution images with the high signal epidural fat outlining the contents of the spinal canal and the T2 sequences generate high signal from cerebrospinal fluid (CSF) forming a myelographic effect adjacent to a disc herniation. Before MRI, CT examinations for disc herniation particularly of the cervical spine were almost routinely accomplished with an intrathecal administration of iodinated contrast (CT myelography).
Computed Tomography
Background
Computed tomography is a diagnostic imaging procedure that constructs a cross-sectional image using a combination of x-ray systems and computer technology (Fig. 2-14). This overcomes a significant disadvantage of conventional x-ray in which three-dimensional anatomy is superimposed on a two-dimensional image receptor surface. Although early attempts to construct CT equipment occurred during the late 1950s, the first practical working model of a CT unit was developed by Godfrey Hounsfield in 1972. Hounsfield, a computer engineer, who worked at the Central Research Laboratory for Electric and Music Industry (EMI) in England, the company also notable for producing the works of the Beatles. Hounsfield won the Nobel Prize for Medicine and Physiology in 1979 for his work leading to the development of CT. Hounsfield’s original CT scan took hours to acquire a single slice of image data and more than 24 hours of computer time to reconstruct these data into a single image. By contrast, today’s CT systems acquire multiple slices images of a body part in seconds. Further advances in the technology resulted in the helical or spiral CT scanner, introduced in 1989, allowing the bed to move while the detector continually rotates about the patient. This technology also resulted in volume acquisition CT from which complex three-dimensional data could be readily constructed. In 1998, the next major advancement was multidetector CT (MDCT) with more than one row of detectors and up to 256 rows of detectors giving a corresponding number of slices for each rotation of the CT tube. Advancements in CT technology have also given rise to CT fluoroscopy, CT angiography, and virtual endoscopy.
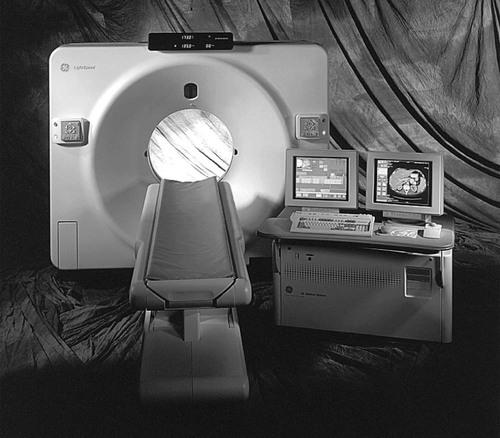
Image Production
The CT scanner uses a high-capacity radiographic tube contained within a gantry emitting a cone x-ray beam as it rotates about the patient while the table moves at a designated speed (Fig. 2-15). An array of detectors on the opposite side of the tube intercept the x-rays transmitted through the patient. The primary function of the detector array is to convert the attenuated x-ray beam into electrical signals, which ultimately becomes digital information. The information from the attenuated x-ray beam is processed by a computer system that constructs cross-sectional data corresponding to the axial plane line of the acquisition. These image data are digitally constructed and are composed of pixels representing a volume of anatomical data (voxels). The degree to which the anatomy attenuates the x-ray beam provides the associated voxels with a unit of density called CT numbers or Hounsfield units
Stay updated, free articles. Join our Telegram channel

Full access? Get Clinical Tree


