Abstract
Blood oxygenation level dependent functional magnetic resonance imaging (BOLD fMRI) is widely used by the neuroimaging community for studies of the brain, but remains controversial in the spinal cord despite demonstrations of technical feasibility. As yet the majority of motor studies have focussed on hand movement or finger tapping, while painful and non painful thermal, brushing and electrical stimuli have been used in sensory studies. These studies face challenges relating to the location and anatomy of the spinal cord, magnetic field inhomogeneities, motion, reduced receiver coil sensitivity relative to the brain, and even a lack of tailored tools for the post-processing chain. Overcoming these obstacles have been a major topic for activity in the field, with advanced shimming techniques, refined sequences, enhanced coil designs and tools for co-registration and physiological noise reduction emerging to address various issues. Those looking to undertake spinal fMRI should perform a careful preliminary investigation in order to appropriately design their study for robust results, some guidance on which is provided in this chapter.
Keywords
fMRI, spinal cord, BOLD, motor, sensory
4.1.1
Blood Oxygenation Level Dependent
4.1.1.1
Basic Principles
Functional magnetic resonance imaging (fMRI) allows noninvasive detection of neuronal activity. fMRI based on the blood oxygenation level dependent (BOLD) contrast mechanism was first introduced in 1990. The basic principle behind the BOLD effect is that following neuronal activation, metabolic demand for oxygen induces a local increase in blood flow and blood volume. However, this blood supply far exceeds actual oxygen requirements, yielding a transient increase of oxyhemoglobin in the venous compartment and thus a relative decrease in the concentration of deoxyhemoglobin (HbR). Given that deoxyhemoglobin has paramagnetic properties, its presence induces local variations of the magnetic field imposed by the MR scanner, yielding a faster transverse relaxation mechanism (here we focus on the so-called T 2 ∗ decay, but T 2 decay is also implicated, see, e.g., Bandettini et al. ). Since deoxyhemoglobin concentration is reduced following neuronal activation, there is less distortion of the local magnetic field, so local protons will experience slower transverse dephasing, resulting in a higher T 2 ∗ -weighted MR signal.
Signal changes arising in BOLD fMRI are relatively small, typically less than 5% of the resting MR signal level in the brain, but may be detected by repeating stimulation (so-called “blocks” or “events”) and rest periods several times, followed by statistical analysis (or inference) to distinguish task-correlated responses from noise.
The BOLD effect is widely used in the neuroimaging community, with more than 20,000 papers having been published to date using this technique (MEDLINE search, April 2013). Several reviews of the BOLD effect and its application in brain fMRI are available. FMRI was applied for the first time in the spinal cord at 1.5 T using a motor task, and has since been shown to be technically feasible in both humans and animals. However, results from the spinal cord remain controversial due to their low reproducibility.
4.1.1.2
Neurovascular Coupling
Given that fMRI relies on hemodynamic changes to infer neuronal activity, it is worth understanding some basic properties of blood regulation (see also Chapter 4.3 ). BOLD signal exists because oxygenated blood supply far exceeds the actual demand of activated neurons. Two theories explain this phenomenon. The first suggests that the enzymes responsible for metabolizing the oxygen to produce adenosine triphosphate (ATP) saturate, leaving residual oxygen (i.e., nonmetabolized) to be washed out in the venous compartment where BOLD signal is recorded. The second theory suggests that the low rate of oxygen diffusion through the blood brain barrier necessitates a disproportionate increase of blood flow compared to the amount of consumed oxygen. An implication of the first theory is that one should observe a saturation of metabolic rate of oxygen (MRO 2 ) when blood flow is increased. According to the second theory, one should observe a proportional relationship between the two parameters. Hoge et al. have demonstrated the existence of a linear relationship between cerebral blood flow and MRO 2 using hypercapnia, thereby supporting the hypothesis of restricted oxygen diffusion.
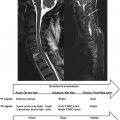
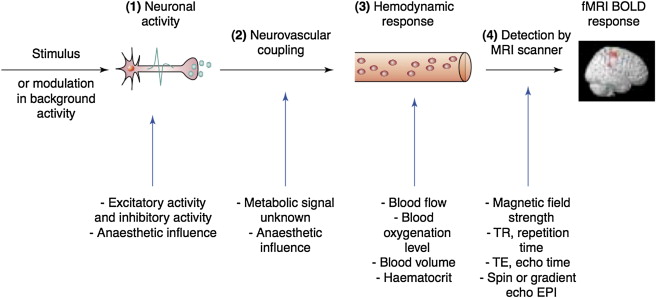
Given the strong dependence of the BOLD signal on vascular parameters (blood flow, blood volume), fMRI does not provide an absolute measure of metabolic changes associated with neuronal activity. Percentage BOLD signal changes should be interpreted with care, as they do not directly relate to neuronal activity ( Figure 4.1.1 ).
4.1.1.2.1
Neurovascular Coupling in the Spinal Cord
As in the brain, spinal neurons require energy supplied by ATP and so are dependent on the delivery of oxygen via blood flow. To study this relationship, Marcus et al. induced a metabolic response in the lumbosacral spinal cord following stimulation of the femoral and sciatic nerves in dog, lamb, and sheep. They concurrently measured blood flow using microelectrodes, detecting a 50% local blood flow increase in the ipsilateral gray matter but no significant blood flow increases in the ipsilateral white matter nor in the whole contralateral region. The authors therefore concluded that the hemodynamic response following a metabolic stimulus is extremely localized in terms of vascular reaction close to the activated neurons. This observation has since been confirmed by intrinsic optical imaging studies in the cervical and lumbar spinal cord of rats.
Complementary insight into blood flow control comes from a study by Nix et al., who compared vascular reactivity between the spinal cord and the brain in the rat. They used microelectrodes to measure arterial partial pressure of O 2 <SPAN role=presentation tabIndex=0 id=MathJax-Element-1-Frame class=MathJax style="POSITION: relative" data-mathml='(PO2)’>(PO2)(PO2)
( P O 2 )
changes to a CO 2 challenge (“hypercapnia”). A brisker vascular response was observed in the cord compared to the brain, leading the authors to conclude that “spinal cord blood flow regulation is somewhat more sensitive to CO 2 than is that in the brain cortex”. We could hypothesize that vascular coupling is tighter in the spinal cord than that in the brain, yielding less washout of deoxyhemoglobin and therefore lower BOLD effect.
4.1.1.2.2
Hemodynamic Response Function
The timing of the BOLD response depends on the coupling between oxygen demand from neurons and the vascular response. The temporal profile of this response is characterized by a hemodynamic response function (HRF), whose height, shape, and phase (relative to the onset of oxygen demand) are a fundamental component in the modeling process commonly used in fMRI analysis. A canonical HRF, available in most fMRI processing packages (e.g., SPM, FSL, AFNI) is typically used for analyzing brain fMRI data. Despite this common usage, the HRF is known to vary across brain regions, and one human study has demonstrated a slower HRF in the spinal cord compared to the brain canonical HRF. Given the contradictory results from human in vivo studies using fMRI and more direct experimental animal studies using e.g., laser Doppler blood flow, characterizing the HRF in the spinal cord in response to various stimuli warrants further investigation.
4.1.1.3
Different Tasks—Different Neuronal Systems in the Spinal Cord
Both motor and sensory neuronal systems are of interest as targets for fMRI studies of the spinal cord. As yet, the majority of motor studies have focused on hand movement or finger tapping, while painful and nonpainful thermal, brushing, and electrical stimuli have been used in sensory studies (see Table 4.1.1 ). There remains considerable scope to develop appropriate paradigms for the full range of movements and variety of sensory receptors that involve the spinal cord.
| Type | Task/Stimulus | Pulse Sequence | TE | Orientation | References |
|---|---|---|---|---|---|
| Motor | Fist clenching | FLASH (GE) | 40 ms | Axial | Yoshizawa et al. |
| Motor | Fist clenching (squeezing ball) | FLASH (GE) | 30 ms | Sagittal, axial | Stroman, Nance & Ryner |
| Motor | Forearm, wrist, and finger flexion | GE-EPI | 50 ms | Sagittal, axial | Madi et al. |
| Motor (voluntary + stimulated) | Fist clenching, finger flexing | Multishot GE-EPI | 50 ms | Sagittal, axial | Backes, Mess & Wilmink |
| Motor, sensory | Tongue flexion, Smiling, Puckering lips (motor), touch (sensory) | GE-EPI | 60 ms | Coronal, sagittal | Komisaruk et al. |
| Motor | Finger flexing | GE-EPI | 50 ms | Axial | Govers et al. (2007) |
| Motor | Finger tapping | GE-EPI | 15 ms | Axial | Ng et al. (2008) |
| Motor | Finger tapping | GE-EPI | 32 ms | Sagittal | Maieron et al. |
| Motor | Finger flexing | TSE GE-EPI | 35 ms 20 ms | Sagittal | Bouwman et al. |
| Motor | Fist clenching (squeezing rubber ball) | GE-EPI | 40 ms | Transverse | Giulietti et al. |
| Motor, monitoring of physiological processes | Fist clenching, effect of cardiac cycle | GE-EPI | 40 ms | Sagittal | Piché et al. |
| Sensory | Application of pressure on fingertip | GE-EPI | 50 ms | Sagittal | Stracke et al. |
| Sensory, monitoring of physiological processes | Noxious thermal, effect of cardiac and respiratory cycle | GE-EPI | 45 ms 24 ms | Axial | Brooks et al. |
| Sensory | Noxious thermal | GE-EPI | 40 ms | Axial | Eippert et al. |
| Sensory | Noxious thermal, brushing (nonpainful) | GE-EPI | 23 ms | Axial | Summers et al. |
| Sensory | Touch (contact with object) | 1-shot GE-EPI 4-shot GE-EPI | 27.6 ms 23 ms | Axial | Giuletti et al. |
| Sensory | Noxious thermal, punctate (nonpainful) | GE-EPI | 39 ms | Axial | Brooks et al. |
| Sensory, monitoring of physiological processes | Noxious thermal, punctate (nonpainful) | GE-EPI | 39 ms | Axial | Kong et al. |
| Manipulation of physiological parameters | Hypercapnia | GE-EPI | 30 ms | Axial | Cohen-Adad et al. |
4.1.1.3.1
Motor Tasks
The hand has been the preferred target for motor tasks as it can be used with relatively little co-motion of more proximal muscles that might result in bulk movement of the spinal cord. Fist clenching may be expected to yield a functional response over a large extent of the spinal cord due to its involvement of the muscles of the forearm and all the digits of the hand and their coordinated motion. Unsurprisingly, it was used in the first spinal fMRI study and has been the basis for characterizing the temporal features of the spinal BOLD response. It should be noted that motor tasks will inevitably involve both a motor and a proprioceptive/sensory component. Through finger tapping experiments, researchers have investigated spinal cord responses specific to the complexity and speed of performing finger movements. Both greater complexity and higher rate were associated with greater BOLD responses.
Leg movements are of particular interest for spinal cord injury studies and locomotor rehabilitation but are difficult to achieve without inducing task-related movement that may induce false positive results.
4.1.1.3.2
Sensory Stimulation
Different classes of afferent nerve fibers convey sensory information from the body surface, muscles, and viscera to the spinal cord. These fibers are specialized, in that some respond preferentially to light touch, vibration, stretch, moving stimuli, or temperature and others to potentially tissue-damaging stimuli (so called nociceptors).
The role of the spinal cord in the processing of painful stimuli has been an active area of investigation with electrical, laser, and thermal stimuli being applied in imaging experiments. Studies comparing noxious and non-noxious electrical stimuli in rats have shown notably higher reproducibility and sensitivity of BOLD responses to noxious stimuli. A similar distinction has been observed in humans between noxious laser heating and innocuous brush strokes to the dorsum of the hand. These findings correspond well with prior reports in animal models using autoradiography and invasive measurements. In agreement with known neuroanatomical pathways, increased BOLD signal has been observed primarily ipsilateral to the side of nociceptive stimulation. A first investigation of the influence of placebo modulation of spinal responses to painful sensory stimuli has been reported by Eippert et al. Rather limited effort has gone into BOLD studies of non-nociceptive stimuli in their own right. Tactile stimulation (vibration at the finger tips at 3 Hz) has been shown to produce activation of the cervical cord in humans.
4.1.2
Challenges in fMRI of the Spinal Cord
FMRI of the spinal cord is much more challenging than that in the brain. While investigations reporting successful results have been published, the reproducibility of these data is questionable. In this light, it seems worth understanding why detecting the BOLD effect is so challenging in the spinal cord, given that neuroscientists have used this technique in the brain for more than 20 years.
4.1.2.1
Spatial Localization of the BOLD Signal
For a given paradigm (motor, sensory), where should you expect BOLD signal to occur? This question is important, as it helps to validate fMRI results by assessing the sensitivity and spatial specificity of statistical maps. To address this question we need to consider several aspects of the anatomy and physiology.
4.1.2.1.1
Cross-Sectional Distribution of Gray Matter Specialization
The primary synaptic connections in the motor and sensory systems of the spinal cord are distributed as illustrated in the Annex (Figures 7–14). In general the cell bodies and synapses of motor neurons are located in the ventral horn. In contrast, sensory neurons have their cell bodies located in the dorsal root ganglion outside the spinal cord and rely on interneurons, with which they form synaptic connections in the dorsal horn, to relay sensory information to supraspinal regions. From the spinal cord, the motor system gives rise to the ventral nerve roots, while sensory information is carried via the dorsal nerve roots.
4.1.2.1.2
Vertebral/Spinal Nerve Equivalence
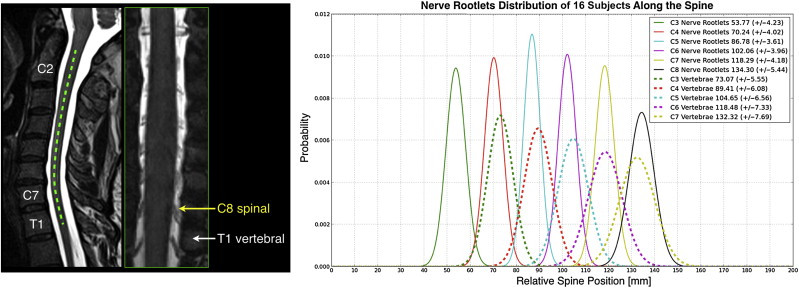
Motor stimulation paradigms involving a particular muscle or muscle group (collectively known as a myotome) or sensory stimulation of a particular region of the skin (served by a single spinal nerve, and referred to as a dermatome) will be associated with cord activity corresponding to the representative nerve root (ventral—motor, dorsal—sensory). It is thus established neurophysiological practice to describe the position of such spinal cord responses in terms of the corresponding spinal nerve root (“spinal” or “segmental” level). Unfortunately, an important discrepancy has emerged in that spinal cord fMRI results are typically analyzed and interpreted relative to the vertebral level. This can be problematic as the spinal and vertebral levels are not anatomically matched. Although there is a gross model for finding spinal nerve entries relative to vertebral levels (see Annex), this correspondence is not entirely accurate as there is intersubject variability. In short, the human spinal column (vertebral bones, ligaments, and intervertebral discs) grows at a more rapid pace and in response to different forces than the human spinal cord. As a result the spinal cord is considerably shorter than the spinal column in adults (less so in infants), and the nerve roots tend to exit the spinal canal considerably lower than the position of their entry/exit from the spinal cord. Concerning the cervical cord, it is worth noting that the nerve roots for the 2nd to 7th spinal nerves exit at or above the level of their corresponding vertebral bodies, but the 8th cervical nerve root is not associated with a vertebral body and exits immediately below the 7th cervical and above the 1st thoracic vertebral body. Thereafter the spinal nerves exit below, and sometimes some distance from, the level of their associated vertebral body.
Recent studies have investigated this issue by performing structural imaging of nerve rootlets and by finding the correspondence between spinal and vertebral levels. Moreover, the spinal nerves are not comprised of a single unit but rather as a series of rootlets fanning out over some rostral-caudal extent. A consequence of this structural formation is that a given nerve root can be expected to form synapses across a relatively extended segment of the spinal cord ( Figure 4.1.2 ). For any given subject, the exact distribution of spinal rootlets is rarely known and is likely to vary across subjects, leading to variability in response location along the spinal cord within the territory of a given nerve root.
4.1.2.1.3
Distribution of Neuronal Activity in Response to Sensory/Motor Stimulus
The spatial distribution of neuronal activity in the axial and rostro-caudal dimensions is likely to further vary across individuals as the location of dermatome boundaries and polysynaptic pathways differ slightly between individuals. The contribution from descending modulation was also shown to vary, hence motor tasks can elicit variable distribution of activity across subjects.
Moreover, most motor tasks are not “purely motor” as they also involves sensory inputs. For example, a ball-squeezing task also involves sensory inputs from the palm and fingers as well as proprioceptive inputs.
4.1.2.1.4
Ipsi/Contralaterality
Although consistent ipsilateral activation has been reported, its poor reproducibility has also been noted. Ipsilateral neurons of the spinal cord are expected to activate predominantly when performing motor or sensory tasks. However, contralateral motorneurons and interneurons are also involved through various crossed spinal pathways. Thus, lateralization of activity is not a clear-cut issue.
Further complicating the differentiation of ipsi- and contralateral activity are partial volume effects (voxels can include both right and left sides). To minimize the effect of partial volume effect, axial acquisition with high in-plane resolution is recommended.
Previous studies in the brain have also raised possibility of a “blood stealing” effect in which “negative BOLD” signal is recorded in an inactive area near the site of increased metabolic demand. This effect is caused by the reduction in blood supply (hence decrease of T 2 ∗ -weighted signal), due to an increase of blood flow in a neighboring vasculature area where neuronal activation occurs. As the anterior arterial supply to the spinal cord is carried by a midline vessel, the scope exists for steal even in the contralateral cord, as well as distal to the cord along the longitudinally running posterior arteries. However, intrinsic optical imaging techniques applied in the rat spinal cord, which directly measure the relative proportions of deoxygenated and oxygenated blood through light reflectance, revealed a predominantly ipsilateral response to right and left forepaw electrical nerve stimulation. Furthermore, Sasaki et al. did not find any evidence for vascular stealing, suggesting that in the anesthetized rat normal neurovascular coupling leads to ipsilateral increased blood flow following stimulation, without apparent compensatory changes in the contralateral cord.
4.1.2.1.5
Venous Drainage
At first sight, studies reporting BOLD responses “outside” the spinal cord may be a concern. Curiously, however, the venous organization of the spinal cord, coupled with the use of gradient echo EPI, may in fact favor such results, at least as far as those responses adjacent to the cord surface.
A number of brain fMRI studies have shown that BOLD signal changes are greatest in large venules and superficial draining veins. This effect is illustrated in Figure 4.1.3 , which compares BOLD activation map and susceptibility-weighted imaging in the same subject: larger BOLD responses are detected at the location of big veins. Because the spinal cord gray matter is surrounded by white matter, large activation signals could therefore be detected several millimeters from the gray matter activation site.
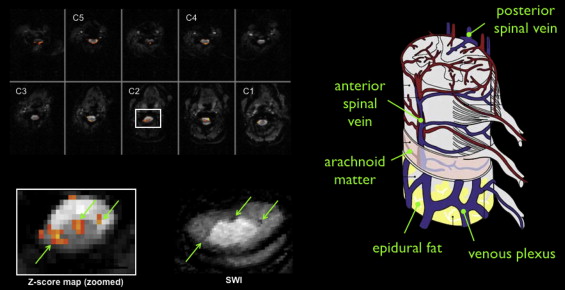
It has been argued that the BOLD response in superficial veins should be attenuated because of their orientation parallel to the static magnetic (B 0 ) field, while radicular veins running perpendicular to B 0 should exhibit a maximal response. This argument neglects the role of crossing elements in the venous plexus linking the draining veins and collecting blood from the emergence of the radicular veins at the cord surface. Whether anastomotic connections are the sole cause of these task-correlated signals at the periphery of the spinal cord remains to be established. If indeed these anastomotic connections do have a significant role, differences in their distribution may further exacerbate intersubject variability in fMRI response localization. This could also explain why the spatial location of cardiac-related signal was shown to be invariant within subjects but highly variable across subjects.
Although these large-vessel BOLD responses are not false positives per se, the interest in them is limited in standard fMRI studies, where we aim to map neuronal activity with high spatial specificity. Although some have advocated excluding such large vein activations, doing so is not routine practice in brain fMRI. The combination of voxel sizes (typically 27 mm 3 ) and smoothing kernels (FWHM ∼5–8 mm) used in brain studies, coupled with the presence of cortical gray matter immediately below the brain surface, means that responses in draining veins tend to be included and give an apparent co-localization of the activation epicenter and BOLD signal. In spinal cord fMRI, the in-plane resolution of voxels is commonly 1 mm, the gray matter is generally separated from the surface, and little or no smoothing is typically applied. Thus, BOLD signal changes in large pial draining veins will tend to be more clearly separated from the source gray matter than in brain studies.
One pragmatic approach to minimizing the influence of draining veins would be to exclude tissues outside the cord, however, it is likely that the imaging point spread function and any applied spatial smoothing could introduce superficial activity in draining veins back into the cord. Perhaps of more practical use would be the combination of both cord segmentation and group analysis techniques (see following as well as Chapter 4.2 ), both of which would tend to reduce the influence of surface draining veins.
Methods to achieve better spatial specificity include the use of other contrast mechanisms such as blood flow and MION-based volume measurements in animals, the use of higher magnetic field and spin echo sequences, as they are more specific to the microvascular compartment and hence reveal responses closer to the activation epicenter. However, spin echo sequences are also less BOLD sensitive than gradient echo sequence, which is problematic for spinal cord fMRI where high image noise makes detection of small signal changes more difficult.
4.1.2.2
Signal Change and Sensitivity
The process used to identify sites of activation relies on statistically distinguishing a task-related signal change from the inherent noise in the signal as repeated images are made over time. The smaller the signal change relative to the noise, the lower sensitivity to BOLD responses. A number of factors have been implicated in reducing the BOLD sensitivity of fMRI in the spinal cord relative to the brain: (1) neurovascular coupling; (2) signal and noise properties of the images; and (3) confounding factors such as task-related motion.
4.1.2.2.1
Neurovascular Coupling
The basic process of an increase in local oxygen metabolism in response to an increase in neuronal activity, with consequent increase in blood flow and blood volume, have been shown to mirror in the spinal cord the events that give rise to a BOLD response in the brain. That is not to say, however, that the degree of blood flow and blood volume changes, or the extent of BOLD signal changes are the same as in the brain. It may be, in fact, that BOLD signal changes are lower in the spinal cord.
As noted earlier, a brisker vascular response was observed in the cord compared to the brain, which could imply that there is a tighter coupling between oxygen demand and perfusion increase in the spinal cord, and therefore lower relative decrease of HbR (and therefore less BOLD signal increase).
Other factors not specific to the spinal cord but that could also affect BOLD responses are:
- •
Baseline perfusion and vascular reactivity strongly determine the dynamic range of the BOLD signal. They may notably be influenced by age, general vascular health, and caffeine intake.
- •
Level of arousal and task performance, e.g., subject doesn’t properly perform the requested task.
- •
Habituation effects, which implies less neuronal firing after repeating the same task during an experimental paradigm.
4.1.2.3
Signal and Noise Properties of the Images
A basic fMRI experiment involves creating a temporal series of images in which some images are acquired during rest and others during the task. The analysis then treats each voxel in the images individually so we can consider the statistical analysis as one of distinguishing the signal change (the contrast) from the noise fluctuations over time in the signal of a voxel. What is important in fMRI is, therefore, the so-called “contrast-to-noise ratio” (CNR) between the mean signal from the set of time points obtained during rest ( S rest ) and those obtained during activity ( S active ) relative to the noise in the time series. The BOLD signal change (Δ S = S active − S rest ) in response to the task is typically expressed as a percentage of the resting signal intensity (%Δ S ), which can be divided by 100 to give the fractional signal change:
% Δ S = 100 × Δ S / S rest
The CNR can be expressed as follows:
CNR = Δ S / σ tNoise
From the above, it is clear that the signal and noise characteristics of an fMRI image have an important impact on the sensitivity to detect BOLD activations. In rapid imaging techniques such as EPI, the image signal-to-noise ratio (SNR 0 ), also called static SNR, is primarily associated with system and thermal noise intrinsic to the MR signal. It represents the SNR of individual images reflecting the condition of the system at the time the image is acquired.
In a study comparing BOLD responses in the spinal cord versus in the brain, SNR 0 was 67 ± 8 in the brain and 39 ± 4 in the spinal cord (mean ± SD across subjects), using an EPI acquisition with voxel size equal to 1.5 × 1.5 × 4mm 3 . The significantly lower SNR 0 in the spinal cord may contribute to the lower BOLD sensitivity encountered at the spinal level (see also Chapter 2.1 ).
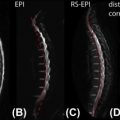
Chief amongst the factors contributing to the lower SNR 0 in the spinal cord is the lower sensitivity of receiver coils in this region (see Chapter 2.1 ). Further notable contributions to low SNR 0 are susceptibility artifacts due to the differing tissues (airways/lungs, bone, muscle, and CSF) that lie in close proximity to the spinal cord. Magnetic susceptibility differences between these structures produce inhomogeneities in the static magnetic field in and around the spinal cord that may induce distortions and signal dropout in gradient echo images. Strategies to increase SNR 0 therefore include better coils, and maximizing the shim quality prior to scanning. The choice of imaging parameters can also play an important role (e.g., voxel size, slice thickness, choice of imaging bandwidth).
4.1.2.3.1
Temporal SNR and Physiological Noise
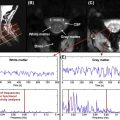
Temporal SNR (tSNR) is defined as the ratio of a voxel’s average signal over a period of time divided by its standard deviation : tSNR = S rest / σ tNois (see Figure 4.1.4 ). In addition to the factors that contribute to SNR 0 , the tSNR encompasses noise due to factors that change over time. Some of these relate to instrumental factors and physiological variations (see Chapter 4.2 ) over the period of the fMRI time series. Low tSNR in the spinal cord results both from low image SNR 0 and large signal variability due to physiological noise (arising from CSF, spinal cord and blood pulsation, swallowing, cardiac and respiration-induced susceptibility effects, etc. see chapter 4.2 ). Given that the goal of fMRI is to detect subtle signal variations across time, the level of tSNR is a good indicator of the sensitivity to detect BOLD signal change in an fMRI experiment. We therefore recommend calculating tSNR at the earliest possible opportunity (i.e., in preliminary data) and reporting it along with BOLD fMRI results. This allows a prospective power analysis to be performed for study design, and allows other researchers to assess the level of significance of the results.
How to Calculate Temporal SNR (tSNR)?
- •
Motion correct (using spline interpolation, otherwise smoothing introduced by trilinear interpolation will overestimate the tSNR)
- •
Detrend (high pass filtering)
- •
Compute the mean and standard deviation (std) over time for each voxel and generate a spatial map of tSNR (mean/std)
- •
Draw an ROI in the cord (either the whole cord or the gray matter if distinguishable), and then calculate the mean tSNR within the mask (spatial average)
Stay updated, free articles. Join our Telegram channel

Full access? Get Clinical Tree


