Jason Handwerker, MD
INTRODUCTION
Magnetic resonance imaging (MRI) has become the examination of choice for imaging the spine and its contents. Although diseases of the spine are very common, clinical syndromes may mimic each other, necessitating imaging such as MRI for diagnosis and patient management. When considering performing and interpreting imaging of the spine, it is important to first understand the clinical context. The most common symptom is back pain. While back pain is epidemic and associated with great disability, back pain without neurologic compromise is usually not an emergency. Fever or history of malignancy should raise suspicion and urgency. Patients with spine disorders may also present with radiculopathy and myelopathy. Radiculopathy results from mechanical compression or irritation of a spinal nerve, often within a lateral recess or neural foramina. This results in specific sensory deficits and muscle group weakness. However, myelopathy is caused by mechanical spinal cord compression or by intrinsic lesions of the spinal cord. Classic symptoms of myelopathy include bladder and bowel incontinence, spasticity, weakness, and ataxia. As the spinal cord has limited healing ability, an acute myelopathy is an emergency and should prompt urgent imaging, preferably with MRI given its superior evaluation of the spinal cord and canal.
ANATOMY AND TECHNIQUE
Given its complex anatomy and length, the spine remains one of the most difficult parts of the skeletal system to evaluate. The spine is composed of multiple vertebrae, which protect the spinal cord and proximal spinal nerves. The spine is composed of seven cervical, twelve thoracic, and five lumbar vertebrae as well as the fused sacrum and coccyx vertebral elements. Except for the first and the second cervical vertebrae, the vertebrae share a similar structure including a vertebral body containing trabecular bone. The posterior elements include the articulating processes, lamina, and spinous process. Intervertebral discs separate the vertebrae and serve as shock absorbers.
The standard spine MRI protocol includes imaging in the sagittal and axial planes using T1- and T2-weighted sequences (Figures 14-1 and 14-2). Additional coronal images may be helpful especially in the setting of scoliosis. Short tau inversion recovery (STIR) or fat-saturated T2-weighted sequences are also invaluable for increased sensitivity of marrow edema. In the adult, the normal vertebral marrow generally has intermediate to high signal intensity on the T1-weighted images and low signal intensity on T2-weighted images. The intervertebral disc is normally high signal intensity on T2-weighted images because of its high water content but frequently loses signal over time with loss of water content. Contrast-enhanced T1-weighted sequences are helpful for evaluation of suspected neoplasm, infection, and inflammatory diseases. Proton density (PD) sequences may be useful in detecting cord signal abnormalities associated with demyelinating diseases such as multiple sclerosis (MS). Gradient-recalled echo (GRE) sequences are helpful for detecting blood products associated with cord hemorrhage in the setting of trauma.
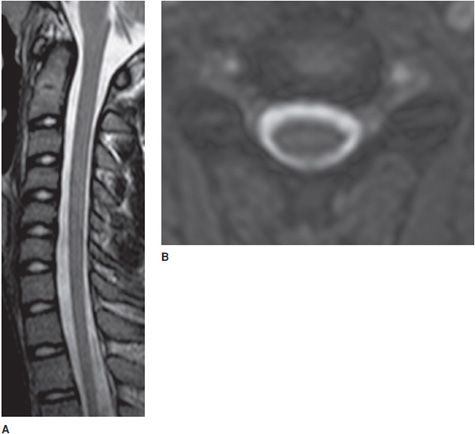
Figure 14-1. Normal cervical spine. (A) Sagittal fat-saturated T2-weighted image shows well-hydrated intervertebral disc spaces and normal cervical cord signal. (B) Axial GRE image shows normal canal and neural foramen.
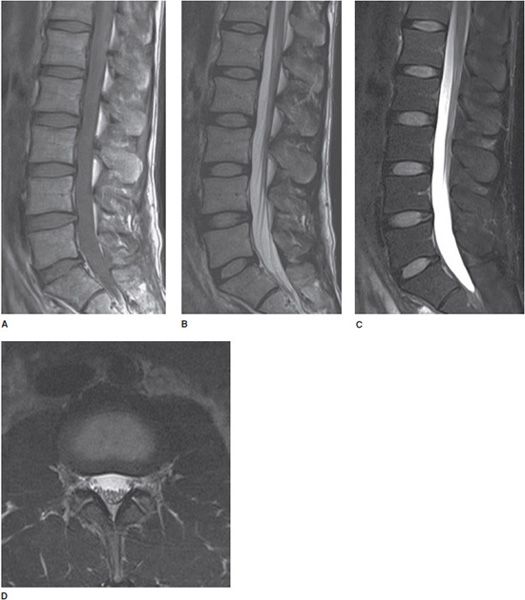
Figure 14-2. Normal lumbar spine. (A) Sagittal T1-weighted image shows normal marrow signal, alignment, and vertebral body heights. (B) Sagittal T2-weighted image shows well-hydrated intervertebral disc spaces. (C) Sagittal fat-saturated T2-weighted image shows no marrow edema and normal lower spinal cord. (D). Axial T2-weighted image shows normal cauda equina nerve roots and paraspinal soft tissues.
When viewing MRI images, one should first become familiar with the normal imaging appearance of the spine. A systematic approach includes appreciation of the spinal alignment, marrow signal, vertebral elements, spinal cord, spinal canal, neural foramen, and paraspinal soft tissues. Identifying transitional anatomy (most often occurring at the lumbosacral junction) is helpful when communicating the correct level of pathology. One should also appreciate artifacts and limitations of MRI technique. For example, metallic artifacts are frequently a problem in the setting of postoperative instrumentation, which may preclude evaluation of areas obscured by the hardware.1
TRAUMA
While computed tomography (CT) remains the mainstay for rapid trauma imaging and depicting fractures, MRI can provide additional information regarding the acuity of findings and demonstrate additional occult injuries, such as spinal cord contusion, epidural hematoma, disc herniation, and ligamentous injury (Figure 14-3). MR can be helpful to assess for ligamentous injury in patients with negative radiographs and CT who have persistent neck pain or who are comatose.2 In addition, MRI may be used for preoperative planning in patients with known unstable injuries (Figure 14-4). The spinal ligaments normally appear as contiguous linear hypointense structures on all MR pulse sequences. The sagittal view is especially useful for depicting injury to the anterior and posterior longitudinal ligaments, ligamentum flavum, and interspinous ligaments. Fat-saturated T2-weighted or STIR sequences are useful for demonstrating edema to distinguish acute from chronic compression fractures, especially when there is background demineralization or fractures lines are not evident (Figure 14-5). These sequences are also useful for detection of subtle osseous injuries, such as in the setting of repetitive injury and stress reaction involving the pars inter-articularis (Figure 14-6).2,3
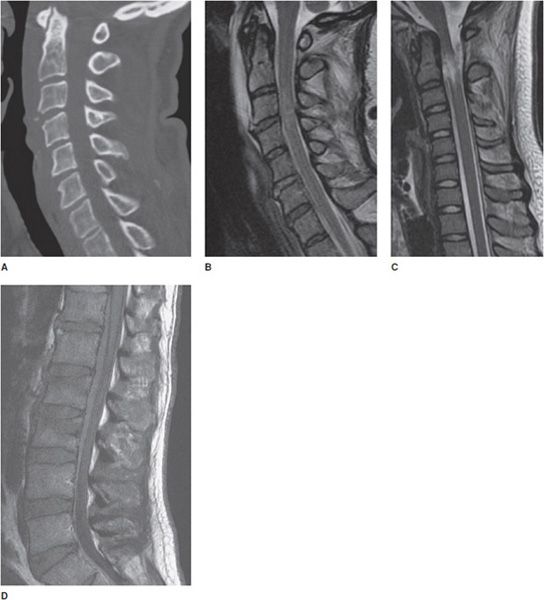
Figure 14-3. Trauma. (A) Sagittal CT image of the cervical spine shows a subtle teardrop fracture involving the anterior–inferior corner of the C3 vertebral body as well as prevertebral soft tissue swelling. (B) Sagittal T2-weighted image shows additional injury to the adjacent anterior longitudinal ligament and a C3-4 cord contusion shown by increased signal in the cord. (C) Sagittal T2-weighted image in a different patient shows traumatic cord transection at the C2 level. (D) Sagittal T1-weighted image in another patient shows mild L2 and L3 compression fractures. There is also a large T1 isointense ventral epidural hematoma that was not evident on CT.
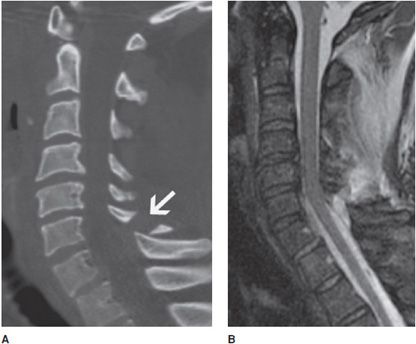
Figure 14-4. Ligamentous injury. (A) Sagittal CT scan reveals a displaced fracture (arrow) involving the C7 spinous process as well as distraction of the spinolaminar line. (B) Sagittal MR short tau inversion recovery (STIR) image reveals underlying ligamentous injury involving the posterior longitudinal ligament (PLL) and ligamentum flavum.
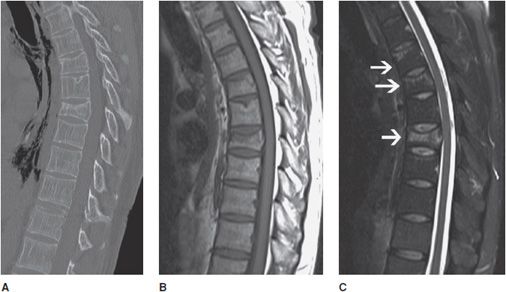
Figure 14-5. Demineralization and acute compression fracture. (A) Sagittal CT of the thoracic spine shows decreased bone density with thinning of the cortex and decreased number of thin coarsened trabeculae characteristic of osteopenia. There are varying degrees of age indeterminate loss in vertebral body height at multiple levels without fracture lines representing partial compressions. (B) Sagittal T1-weighted image shows varying degrees of loss in height of multiple vertebral bodies consistent with low edematous signal. (C) Sagittal T2-weighted fat-saturated image shows multiple vertebral body compression fractures (arrows) with accompanying high T2 signal corresponding to edema indicating acuity.
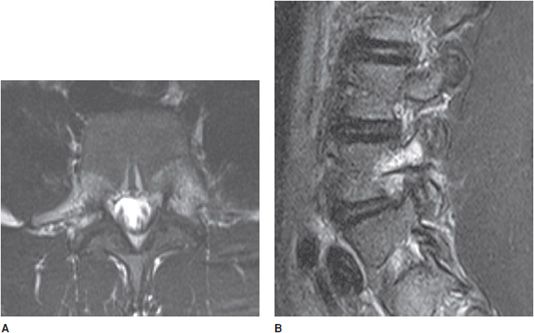
Figure 14-6. Pars interarticularis edema and stress reaction. (A) Axial T2 image shows edematous signal around the pedicles and surrounding soft tissues seen with stress reaction or spondylolysis. (B) Sagittal T2 depicts the edema as a bright signal along the pedicle.
DEGENERATIVE DISEASE
The intervertebral disc undergoes degenerative changes with age, tending to lose hydration. The disc becomes more fibrous and loses height. The adjacent endplates also take effect, as the disc loses its shock-absorbing ability (Figure 14-7). Progression of degenerative changes can contribute to disc material extending beyond the margins of the annulus fibrosis called a herniation. A standardized nomenclature of disc pathology has been defined by multiple medical societies.4 In brief, a herniation is defined as a localized displacement of disc material beyond the limits of the intervertebral disc space. Symptoms arise when they impinge upon the nerve roots or compress the spinal cord. Herniated discs may further be described as protrusions or extrusions. Protrusions are present if the herniated disc material does not extend beyond the superior and inferior margins of the disc space (Figure 14-8). Extrusion is present when herniated disc material extends beyond the superior or inferior margins of the disc space (Figures 14-9 and 14-10). Sequestration is present when the displaced disc material has lost completely any continuity with the parent disc.
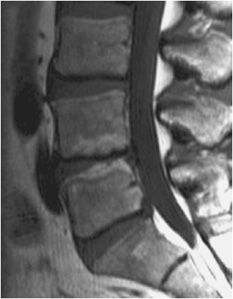
Figure 14-7. Disc and endplate degeneration. Sagittal T1-weighted image demonstrates loss of disc height and fatty marrow signal parallel to the L4-5 endplates, characteristic of Modic type 2 changes.
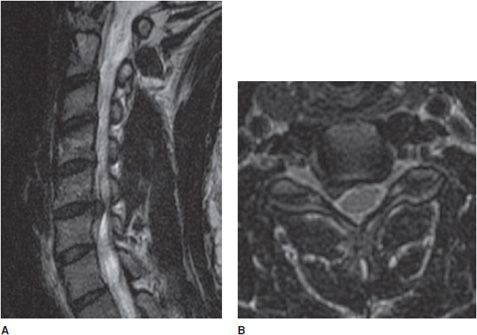
Figure 14-8. Cervical disc protrusion. (A) Sagittal T2 images show a large disc protrusion that extends posterior to the C5-6 interspace. (B) The axial T2-weighted image demonstrates that this disc protrusion extends laterally toward the right neural foramen, where it can especially affect the exiting C6 nerve.
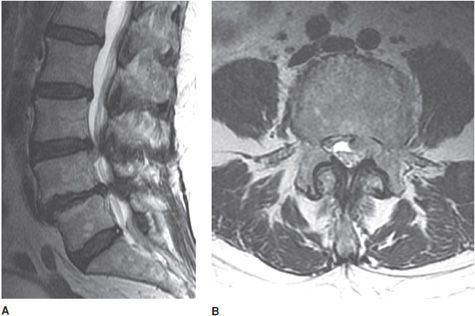
Figure 14-9. Disc extrusion. (A) Sagittal T2-weighted image shows disc extrusion extending inferiorly from the L3-L4 interspace. (B) Axial T2-weighted image shows a focal left paracentral extrusion with subarticular extension into the left lateral recess, impinging the traversing nerve root.
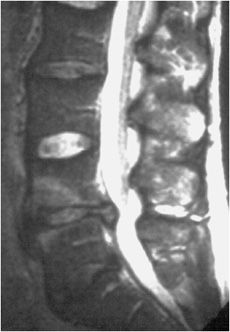
Figure 14-10. Disc extrusion. Sagittal T2-weighted image shows disc extrusion at L4-5 disc space.
Surgical treatment includes laminectomy and discectomy. Recurrent symptoms known as “failed back surgery” syndrome (FBSS) lead to search for an underlying cause such as recurrent of residual disc versus scar. Postcontrast MRI is able to depict these complications accurately (Figure 14-11).
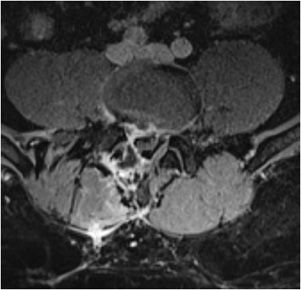
Figure 14-11. Postoperative residual or recurrent disc and scar. Axial T1 postcontrast image shows small right paracentral disc protrusion after discectomy surrounded by enhancing scar tissue.
In addition to disc pathology, MR is useful to evaluate other degenerative processes including ossification of the posterior longitudinal ligament (OPLL) to better assess spinal cord compression, severity of stenoses, and determine any cord signal abnormality (Figure 14-12).4–7
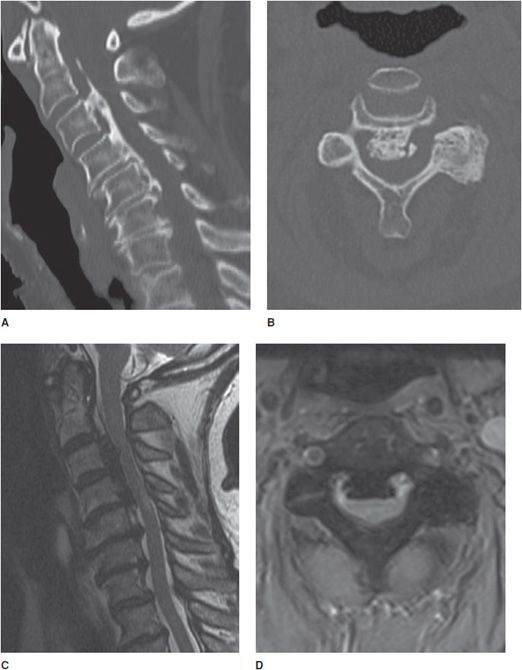
Figure 14-12. Ossification of the posterior longitudinal ligament (OPLL). (A) Sagittal CT image shows extensive flowing ossification along the PLL causing narrowing of the central canal. (B) Axial CT image shows large ossification from OPLL. (C) Sagittal T2-weighted image shows prominent low signal ossification along the PLL. (D) Axial GRE shows low signal PLL ossification in a typical “bowtie” configuration.
INFECTION
In the setting of fever and back pain, one should have a strong suspicion for infection, as a delay in diagnosis can lead to increased morbidity and mortality. MRI plays an especially important role in the early diagnosis of infection as radiographs and CT can be unrevealing in the early stages of infection. Infection of the spine often involves both the disc space and the adjacent vertebral body, termed spondylodiscitis or discitis–osteomyelitis (Figure 14-13). Infection is usually via hematogenous spread. In the child, the infectious agent first settles upon the vascular disc, however, in the adult, it first settles onto the endplate of the vertebral body. The most common agent remains Staphylococcus. MR is the imaging modality of choice and should include fat-suppressed T2-weighted image or STIR and gadolinium-enhanced fat-suppressed T1-weighted image.
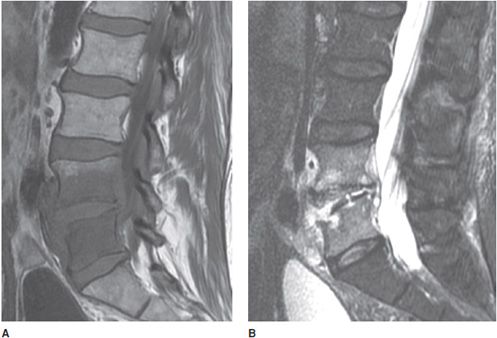
Figure 14-13. Spondylodiscitis (discitis–osteomyelitis). (A) T1-weighted image showing disc and vertebral end-plate infection with decreased signal in the L4-5 vertebral body and paravertebral soft tissues. (B) T2 fat-saturated image shows disc and vertebral body infection with paravertebral infection. Note erosion of lower L4 and upper L5 endplates.
An epidural abscess may form via spread from adjacent vertebral infection or via hematogenous spread. The abscess is most often located in the posterior epidural space (Figure 14-14). Detection is of urgent importance as the abscess may cause compression of the spinal cord. CT may be limited in detection compared with MR (Figure 14-15).
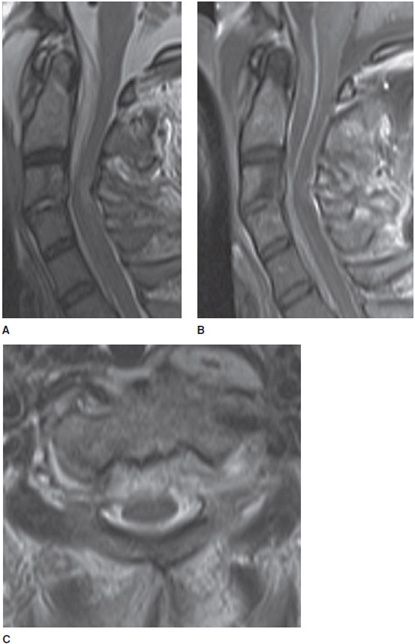
Figure 14-14. Epidural abscess. (A) Sagittal T2-weighted image shows large ventral epidural fluid collection of T2 hyperintensity with mass effect on the cord. Note discitis at the C3-C4 level. (B) Sagittal T1 postcontrast image shows large ventral collection with peripheral enhancement causing mass effect upon the cord. (C) Axial T2-weighted image shows the ventral epidural high T2 collection indenting the ventral thecal sac and abutting the cord.
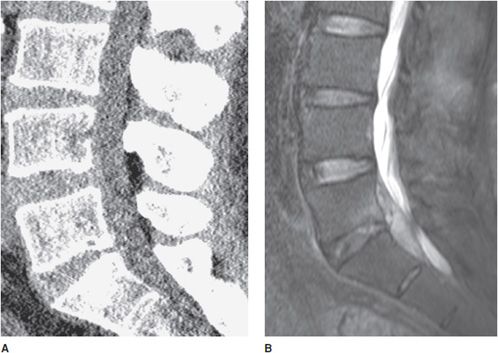
Figure 14-15. Epidural abscess not well seen on CT. (A) Sagittal noncontrast CT of lumbar spine shows no definite abnormality. (B) Sagittal T2-weighted image shows a large ventral epidural mixed fluid collection compressing the cauda equina nerve roots.
Atypical infections can also be diagnosed by MRI. Spinal cysticercosis is a rare infection caused by the pork tapeworm, Taenia solium. Within the spine, intradural cyst formation is the most common manifestation. Symptoms arise when the cyst causes compression upon nerve and surgical decompression becomes necessary. MR becomes essential to depict location and any degree of cord compression (Figure 14-16).8–10
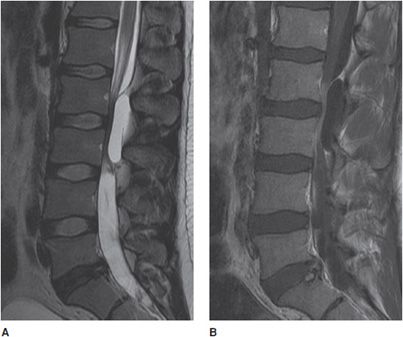
Figure 14-16. Spinal neurocysticercosis. (A) Sagittal T2-weighted image shows a large cystic mass in the dorsal thecal sac causing mass effect on the cauda equina nerve roots. (B) Sagittal T1 postcontrast fat-saturated sequence shows thin peripheral enhancement.
INFLAMMATORY DISEASE
Transverse myelitis is an inflammatory condition of the spinal cord associated with rapidly progressive neurologic dysfunction. The cord appears enlarged with an elongated area of high signal on T2-weighted images (Figure 14-17). In the acute setting, there is often associated contrast enhancement.
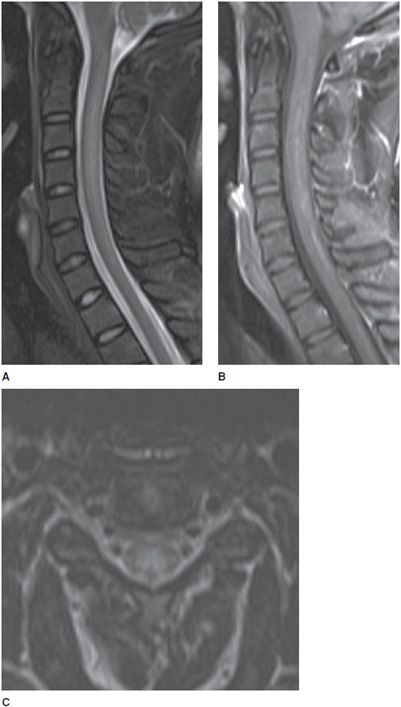
Figure 14-17. Transverse myelitis. (A) Sagittal T2-weighted image demonstrates elongated high signal and expansion of the cervical cord. (B) Sagittal T1 postcontrast image shows associated patchy cervical cord enhancement. (C) Axial T2-weighted image demonstrates the signal abnormality within the cord.
MS is a debilitating and multiphasic disease. Spinal MS is often associated with brain lesions. MRI is the most sensitive imaging modality for detecting spinal MS. MS plaques are most often located posterior–lateral within the cord and typically do not span more than two vertebral body lengths (Figure 14-18). Enhancement is suggestive of active disease. Over time, the spinal cord may appear small in size with focal areas of myelomalacia.
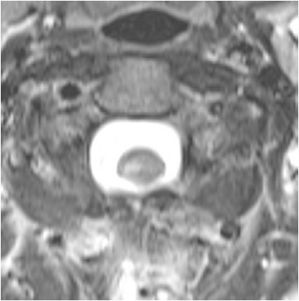
Figure 14-18. Multiple sclerosis. Axial T2-weighted image demonstrates a small high signal plaque within the right dorsolateral cervical cord.
Guillain–Barré syndrome (acute inflammatory demyelinating polyradiculoneuropathy) is often associated with a postinfectious or postvaccinal history. Patients present with an ascending paralysis. MR aids in the diagnosis with characteristic findings of enhancement of the cauda equina nerve (Figure 14-19).
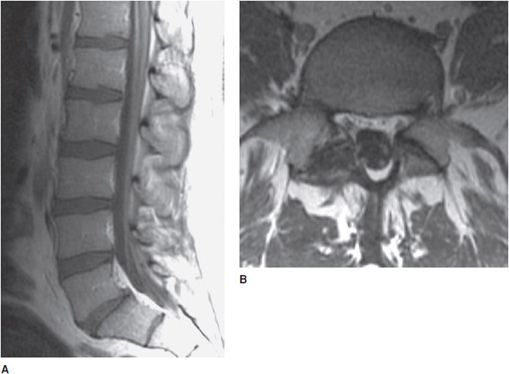
Figure 14-19. Guillain–Barré syndrome. (A) Sagittal postcontrast T1-weighted image shows enhancement along the conus medullaris and cauda equina. (B) Axial postcontrast T1-weighted image shows enhancement of the cauda equina nerve roots.
Sarcoidosis is an inflammatory disease in which abnormal collections of chronic inflammatory cells (granulomas) form as nodules in multiple organs. Granulomas most often arise in the lungs or the lymph nodes, although any organ system may be affected. It presents in the spine in less than 10% of the cases. The cervical region is the most common site. Findings usually present with leptomeningeal linear–nodular or mass-like enhancement (Figure 14-20).
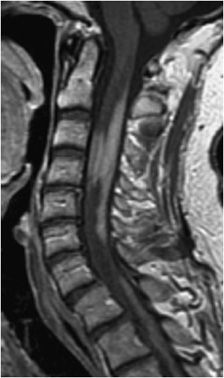
Figure 14-20. Sarcoidosis. Sagittal T1 postcontrast image demonstrates extramedullary mass-like enhancement as well as enhancement within the cord.
Ankylosing spondylitis is an inflammatory disease that affects the axial skeleton, particularly the spine and sacroiliac joints. Manifestations include symmetric syndesmophytes and ankylosis (bony fusion). Early changes may be detected first on MR (Figure 14-21).
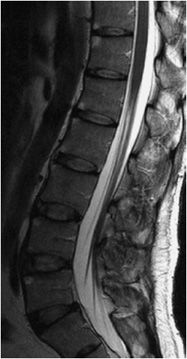
Figure 14-21. Ankylosing spondylitis. Sagittal T2-weighted image demonstrates triangular-shaped, sharply marginated high signal (“shiny corner sign”) at the superior and inferior corners of the vertebral body characteristic of the early manifestations of inflammation.
A rare inflammatory process is acute calcific tendinitis of the longus collis. It usually presents with neck pain and odynophagia. CT will often show swelling of the retropharyngeal soft tissues with amorphous calcification along the longus colli (Figure 14-22). MR will show the calcification to be low in signal on T1- and T2-weighted sequences with surrounding edema (Figure 14-22C).11–17
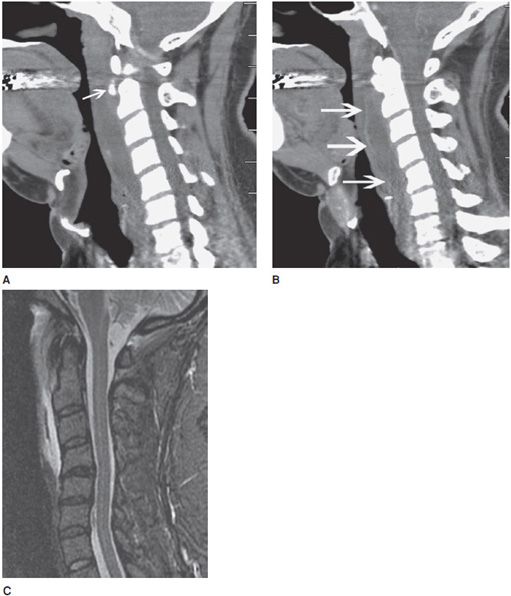
Figure 14-22. Calcific tendinitis and bursitis of the longus collis. (A) Sagittal CT image of cervical spine shows calcification anterior to the C2 vertebra (arrow). (B) Sagittal CT image of the cervical spine postcontrast shows contrast enhancement of the synovial margin (arrows) of the retropharyngeal bursa of the longus collis. (C) Sagittal T2 fat-saturated weighted sequence demonstrates retropharyngeal fluid and edema with linear low signal in the longus colli tendon consistent with calcification.
NEOPLASM
Neoplasm of the spine most frequently involves osseous metastases including secondary to breast, prostate, and lung cancer (Figure 14-23). One should be aware of frequently encountered benign lesions, including osseous hemangiomas, which may simulate a metastasis but usually demonstrates distinctive high signal on T1-weighted images (Figure 14-24). An important point to remember is that tumors often preserve the intervertebral discs, while infection often destroys the intervertebral discs and vertebral endplates.
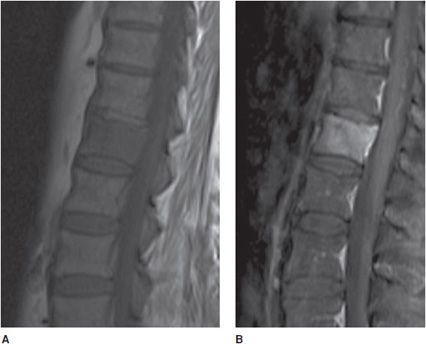
Figure 14-23. Breast cancer bone metastasis. (A) Sagittal T1-weighted image shows diffuse hypointense marrow replacement of a thoracic vertebral body. (B) On the fat-saturated postcontrast image, there is corresponding diffuse enhancement of the metastasis.
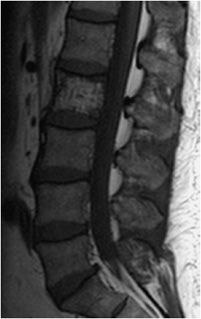
Figure 14-24. Hemangioma. Sagittal T1-weighted image shows increased signal within the L2 vertebral body with vertical striations compatible with coarsened trabecula.
Spinal canal tumors are classified into three categories by the anatomic compartment of origin:
1. Intramedullary: Lesions in the spinal cord.
2. Intradural extramedullary: Lesions in the dura but outside the spinal cord.
3. Extradural: Lesions outside the dura.
Intramedullary tumors include astrocytoma, ependymoma, and hemangioblastoma. Virtually all present with cord enlargement. Additional findings may include cystic components, hemorrhage, calcification, and syrinx formation (Figure 14-25).
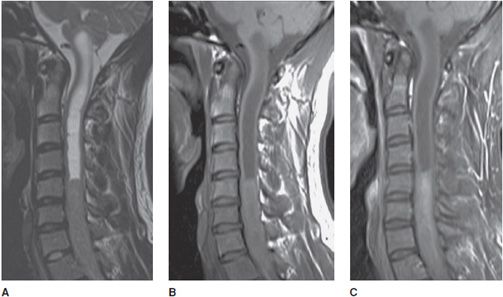
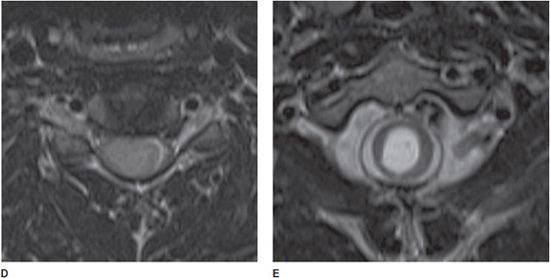
Figure 14-25. Ependymoma. (A) Sagittal T2-weighted image shows a large intramedullary mass within the lower cervical cord with expansion and syrinx superiorly extending into the brain stem. (B) Sagittal T1-weighted image shows an isointensity of the mass relative to the cord. (C) Sagittal T1 postcontrast image shows enhancement of the solid portions of the mass. (D) Axial T2-weighted image shows the centrifugal growth with cord expansion. (E) Axial T2-weighted image at the level of the syrinx shows central canal dilation.
Intradural extramedullary tumors of the spine include meningiomas and nerve sheath tumors such as schwannomas and neurofibromas. They typically expand the CSF space above and below the lesion on the side where the tumor is located and can cause mass effect upon the cord. Meningiomas are usually well circumscribed. A typical dural tail is frequently seen. Calcification is not an uncommon finding.
Nerve sheath tumors appear similar and will grow into the neural foramen commonly producing a classic dumbbell appearance. Multiple neurofibromas are known to be associated with neurofibromatosis type 1 (Figure 14-26), while multiple schwannomas, ependymomas, and meningiomas are known to be associated with neurofibromatosis type 2. Schwannomas may also present as an isolated dumbbell-shaped mass expanding the neural foramen that extends in the spinal canal (Figure 14-27).
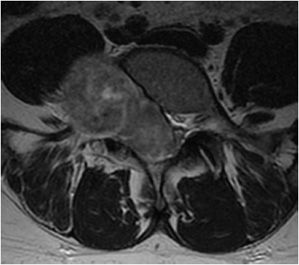
Figure 14-26. Schwannoma. Axial T2-weighted image shows a large mass that markedly widens the neural foramen and narrows the central canal.
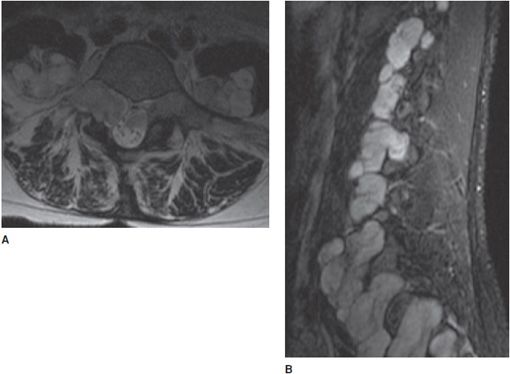
Figure 14-27. Neurofibromatosis type I. (A) Axial T2-weighted image shows a large right paraspinal mass causing characteristic expansion of the right neuroforamen. (B) Sagittal STIR shows neurofibromas at every spinal level.
Additional more malignant intradural extramedullary lesions include metastasis or leptomeningeal carcinomatosis (Figure 14-28). A search for a primary malignancy should be sought. Benign intradural extramedullary lesions include lipomas (Figure 14-29) and arachnoid cysts (Figure 14-30).
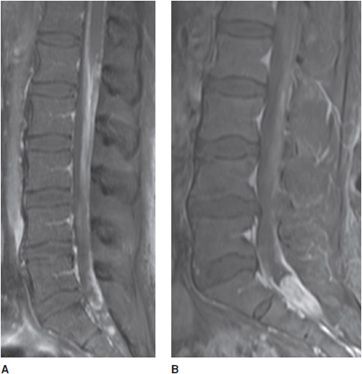
Figure 14-28. Leptomeningeal carcinomatosis. (A) Sagittal T1 postcontrast image shows linear and nodular enhancement along the distal cord, cauda equina, and distal thecal sac. (B) Sagittal T1 postcontrast image shows solitary focal mass at the bottom of the thecal sac, a common place for drop metastasis (in this case from intracranial glioblastoma multiforme.
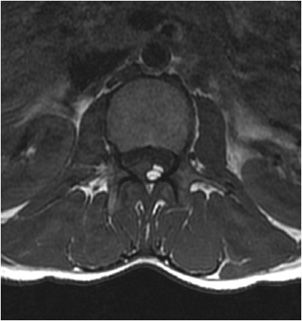
Figure 14-29. Lipoma. Axial T1-weighted image shows a small fatty mass dorsolateral to the cord toward the left. Note the chemical shift artifact.
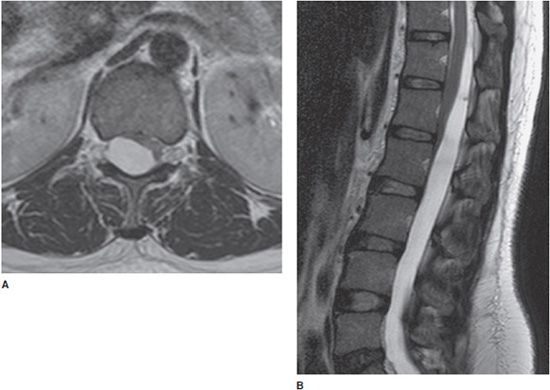
Figure 14-30. Arachnoid cyst. (A) Axial T2-weighted image demonstrates an intradural extramedullary mass of CSF intensity displacing the cord anteromedially within the canal. (B) Sagittal T2-weighted image demonstrates the extent posteriorly within the canal spanning multiple thoracolumbar levels.
Extradural lesions usually arise from bone, disc, or the surrounding soft tissues. Malignant lesions include metastasis, lymphoma (Figure 14-31), or primary bone tumors such as chordoma, osteosarcoma, or myeloma. Additionally, the effects of radiation on spinal bone marrow can become quite obvious (Figure 14-32). Benign extradural masses include epidural lipomatosis (Figure 14-33).18–26
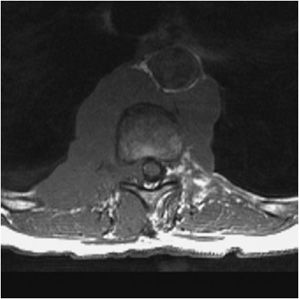
Figure 14-31. Lymphoma. Axial T1-weighted image shows a large low-to-intermediate signal paraspinal and retroaortic, extending into the right neuroforamen.
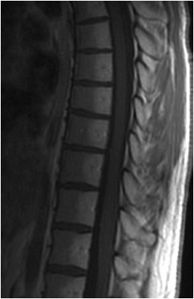
Figure 14-32. Marrow radiation change. Sagittal T1-weighted image shows high signal within the posterior half of the thoracic vertebral bodies, corresponding to the radiation treatment port causing fatty changes with a bright signal in the marrow.
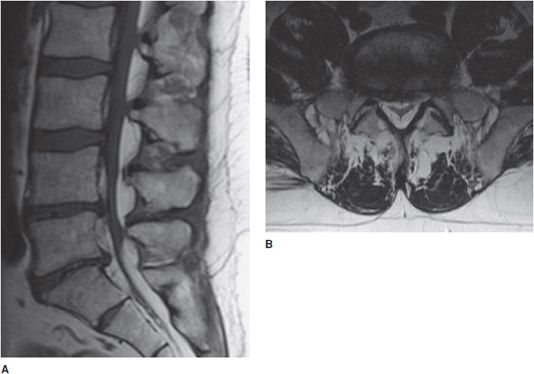
Figure 14-33. Epidural lipomatosis. (A) Sagittal T1-weighted image shows prominent fat of high signal circumferentially around the lower lumbar thecal sac with dorsal epidural lipomatosis, extending cranially to the upper lumbar levels. (B) Axial T1-weighted image shows the compressed thecal sac with the typical Y-shaped appearance.
VASCULAR DISEASE
Infarction of the spinal cord is rare but can result from arterial disease involving the aorta or vertebral arteries. On MRI, the cord demonstrates high signal on T2-weighted images and will often expand slightly. In the acute setting, diffusion-weighted images (DWI) can also be performed in the spine, which may show high signal in the cord earlier than conventional T2-weighed images. An additional clue is that bone infarcts may occur adjacent to an area of cord infarct.
Vascular malformations of the spine are also rare but should be considered in the differential diagnosis of patients presenting with unexplained progressive myelopathy or hemorrhage. Spinal dural arteriovenous fistulas are characterized by an abnormal communication between a radicular artery and vein via a nidus that is most often found within the dura of the nerve root sleeve. This results in elevated pressure and enlargement of the draining spinal veins (Figure 14-34). Diagnosing these lesions is important as they may be potentially treated by surgery or image-guided embolization.27,28
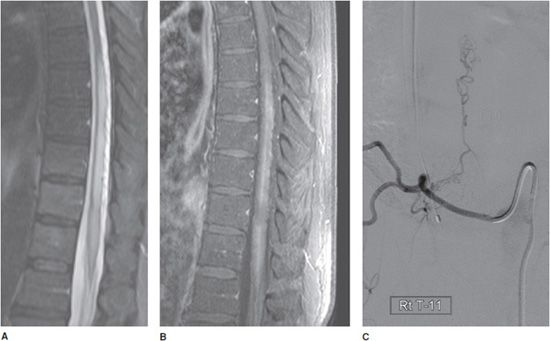
Figure 14-34. Spinal dural arteriovenous fistula. (A) Sagittal fat-saturated T2-weighted image. There is intrinsic thoracic cord T2 hyperintensity representing edema. There is subtle adjacent vascular flow voids along the dorsal aspect of the cord. (B) Fat-saturated contrast-enhanced T1-weighted image shows enhancement associated with increased vascularity along the cord. (C) Spinal angiogram with injection of the right T11 intercostal artery demonstrates the fistula with early filling of dilated spinal veins superiorly.
CONGENITAL
A tethered spinal cord is a disorder in which the spinal cord is pulled down and stuck to the spinal canal. The cord, in normal patients, is able to freely move with growth or during movements such as stretching or bending. In cases of a tethered cord, the cord is held at the base of the spinal canal and is often associated with deformities such as a thickened filum, lipomas (Figure 14-35), lipomyelomeningocele (Figure 14-36), dermal sinus tracts, and split cord malformations. The tethering causes the spinal cord to stretch as a child grows with low positioning of the conus below the L2-L3 level.29–31
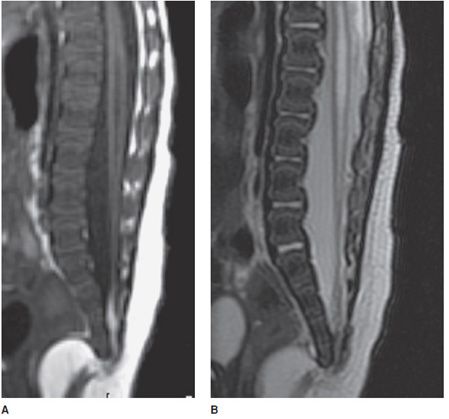
Figure 14-35. Tethered cord. (A) Sagittal T1-weighted image shows a low-lying spinal cord ending in a small terminal lipoma. (B) Sagittal T2-weighted image better depicts associated syrinx.
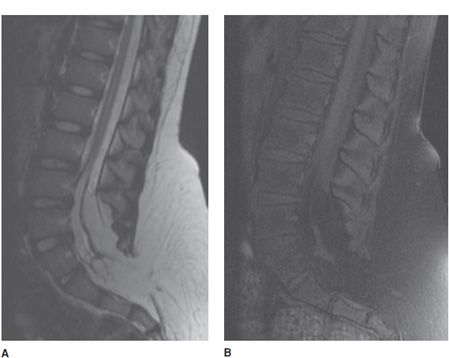
Figure 14-36. Lipomyelomeningocele. (A) Sagittal T1-weighted image shows a lipomyelomeningocele with low-lying cord tethered in a large lipoma that is contiguous with subcutaneous fat. (B) Sagittal T1 fat-saturated image confirms the fatty contents of the lipoma with inversion on this fat-saturated sequence.
Related posts:
Stay updated, free articles. Join our Telegram channel

Full access? Get Clinical Tree


