Standardized Uptake Value

5
Standardized Uptake Value

Eugene C. Lin, Abass Alavi, and Paul E. Kinahan


The standard uptake value (SUV) is also known as


  • SUR (standardized uptake ratio)
  • DUR (differential uptake value, dose uptake ratio)
  • DAR (differential absorption ratio, dose absorption ratio)

image SUV Calculation


  1. Definition. The standardized uptake value is the measured activity normalized for body weight/surface area and injected dose. As a reference, if the dose were uniformly distributed over the entire body, the value everywhere would be SUV ~ 1.0. Thus, SUV is a relative uptake measure.1
  2. Formula

    image


    • Lean body mass or body surface area can be substituted for body weight. This will be more accurate for obese patients (see Pitfalls section).

Pitfalls

The SUV is a semiquantitative measurement. Numerous factors can result in erroneous results.2


  1. Patient size. The SUV has a strong positive correlation with weight if calculated using body weight.


    1. The SUVs in normal tissues of heavy patients can be twice those in lighter patients. This is secondary to the relatively low fluorodeoxyglucose (FDG) uptake in fat. An obese patient who weighs 300 pounds will not have twice the glucose metabolizing mass of a patient weighing 150 pounds, as much of the additional weight is from fat. Thus, using 300 pounds in the SUV equation for an obese patient is inaccurate because the glucose metabolizing mass in this patient is substantially lower than 300 pounds.
    2. If the measured activity in an obese patient is multiplied by body weight, the SUV will be substantially overestimated.
    3. The overestimation of SUVs in obese patients can be avoided by using lean body mass or body surface area rather than weight in the calculation.

  2. Time of measurement. FDG uptake in most lesions increases rapidly in the first 2 hours following the administration of FDG, then increases slowly after that.3


    1. Imaging earlier provides low SUV results.
    2. Conversely, delayed scans provide high SUVs.
    3. Earlier scans are usually subject to greater measurement error because the SUV in lesions has not yet plateaued.
    4. The SUV plateaus earlier following therapeutic interventions.

  3. Plasma glucose levels. Because nonlabeled glucose is competitive with FDG uptake, the higher the plasma glucose, the lower the SUV. Thus, SUVs are underestimated at high glucose levels and should ideally be corrected upward in these situations.


    1. Correction of SUV with the plasma glucose level can be used (e.g., SUV × glucose concentration/100 mg/dL).
    2. This is primarily useful for serial monitoring in the same patient, but inter-study SUV variability in normal tissues will be increased.

  4. Partial volume effects. Small lesions may have artifactually low SUVs from partial volume effects.


    1. Partial volume effects occur when lesions are less than 2 to 3 full-width half-maximum resolution of the scanner (5 to 10 mm in practice for most positron emission scanners [PET] scanners).
    2. On standard PET scanners, partial volume effects will definitely occur below 2 cm. However, any lesion < 3 cm can potentially demonstrate partial volume effects.
    3. Partial volume effects are more prominent for less compact tumors. “Compact” refers to the surface area for a given volume (spheric tumors are most compact). Thus, spheric tumors are least affected by partial volume effects.4

  5. Background activity. Another partial volume effect is “spilling in” of background activity. A lung tumor with equal metabolic activity to a liver tumor may have a lower SUV due to less “spilling in” of background activity.4
  6. Dose extravasation. Dose extravasation results in an underestimated SUV. If dose extravasation is known to have occurred, it is usually better to use a tumor-to-background ratio, as this is not affected by dose extravasation.
  7. Reconstruction parameter. Both reconstruction parameters and attenuation correction methods can affect SUV values.5


    1. Filtered back versus interactive reconstruction. SUVs from images reconstructed with filtered backprojection may be different from images reconstructed with iterative reconstruction.


      • Number of iterations. The SUV of hot spots will increase with more iterations. Most of the increase in average SUV will occur in the first five iterations, with lesser degrees of increase with more iterations. The maximum SUV will increase steadily with more iterations. Thus, the number of iterations will affect the maximum SUV more than the average SUV.6

    2. Attenuation correction. The attenuation correction (AC) method can have more of an effect on SUV than the reconstruction method, particularly if there are artifacts introduced by the AC (e.g., due to patient motion).

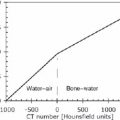
  8. Computed tomography- (CT-) based attenuation correction. SUVs from CT-attenuation corrected studies may vary from those generated with a radionuclide source. In addition, SUV values on PET/CT may be erroneous due to misregistration or truncation artifact.


    1. CT attenuation-corrected SUVs on early PET/CT scanners were reported to be 4 to 15% higher than those calculated by a germanium 68-corrected source.7 However, there was no difference in SUVs between PET and PET/CT in a later study.8


      • The largest difference is seen in the osseous structures.
      • This may be related to errors associated with converting CT attenuation values to 511 keV positron annihilation values.
      • Caution should be used when comparing SUVs between PET/CT and PET studies.

    2. Measured SUVs can be erroneous due to acquiring CT and PET studies at different respiratory phases (see Chapter 7).


      • CT attenuation-corrected SUVs can vary up to 30% in areas of significant respiratory motion (e.g., the lung bases).9

    3. Truncation artifact occurs due to differences in the field of view (FOV) between PET and CT. Obese patients may have part of their anatomy outside the FOV of the CT scan. This truncated portion does not provide data for attenuation correction, resulting in artifactually low SUVs.

Pearls


  1. SUV ROI.10 ROIs placed to measure SUV may vary among centers. However, it is necessary to standardize ROI placement within the same institution and to duplicate the ROI placement method if SUVs from studies at another institution are used for comparison.


    1. Manual definition


      • Automated methods will decrease variability.

    2. Three-dimensional isocontour at a percentage of maximum pixel value


      • This is most accurate for noisy data.
      • Yields information on the metabolically active volume of tumor

    3. Maximum pixel value


      • Used instead of average value for small objects to avoid partial-volume errors.
      • This is most accurate for smoothed (low noise) data and less accurate for noisy data.
      • However, smoothing the data increases partial-volume effect.
      • Uptake is often overestimated at low levels.

    4. Fixed-size ROI centered on maximum pixel value


      • A fixed-size ROI is useful for following tumors that have changed in size, to avoid partial volume effects related to the size change.
      • This is probably the most robust ROI determination method.
      • However, this technique is inaccurate for small tumors.

    5. Volumetric versus two-dimensional (2D) ROI. Volumetric ROIs should be performed if possible. 2D ROIs can result in significant (> 25%) interobserver variability.11 To improve reproducibility with 2D ROIs, the interpreter should remeasure the SUVs on the prior exams rather than relying on prior reports.

  2. Maximum versus mean SUV. Either maximum or mean SUV in a region of interest can be used.


    1. Maximum SUV. This is preferred when using a large region of interest, as areas of necrosis and structures out side the lesion can result in an artifactually low SUV if a mean value is employed. However, maximum SUV is more prone to be artifactually elevated due to noise, and thus is substantially affected by the reconstruction algorithm. Typically, SUV will be overestimated, but occasionally it can be underestimated. The maximum SUV is least affected by partial volume effects.4
    2. Mean SUV. If mean SUV is used, a small region of interest should be placed around the most intense area of the region.

  3. SUV cutoff values. Caution must be taken when using SUV cutoffs from published literature in clinical practice.


    1. The specifics of the data acquisition and analysis used to determine these SUV cutoffs are often not available in the published literature. As already noted, variations in data acquisition and analysis can have substantial effects upon measured SUVs. Also, the patient population varies from center to center.
    2. In general, the reproducibility of SUV measurements between institutions is poor.
    3. Given these factors, it is often advisable to use published SUV cutoffs with caution if at all. Values substantially higher and lower than the cutoff are significant, but values close to the cutoff value may be of questionable value for diagnostic purposes.

  4. Interpretation. SUVs should be just one of many criteria used for interpretation, including visual uptake, lesion size relative to uptake, pattern of uptake, and clinical history. There is no evidence that SUVs in isolation are superior to visual interpretation for optimal diagnosis.
  5. Therapy response. Some form of relative quantitation is necessary for accurately assessing therapy response, and SUV is a practical method for this purpose. Therefore, it is important that the acquisition and analysis schemes for generating PET images are kept the same between exams. Because protocols can be standardized within an in stitution, SUVs may be more helpful for monitoring response to treatment rather than primary diagnosis.10 If SUVs are used for monitoring therapy response, then it is essential to control the factors that influence SUV. In addition, calibration between the scanner and the dose calibrator, as well as the longitudinal stability of the scanner global scale factors, should have rigorous quality assurance/quality control (QA/QC) monitoring procedures. SUVs are most useful in primary diagnosis if the cutoff values are derived from data at the interpreting institution.
  6. Reporting. For patients with cancer, it is important to report SUVs of chosen index lesions, even if these measurements are not used for interpretation of the current study. If the patient is restudied at a later date, the SUVs will be necessary for follow-up interpretation.
  7. Dual time-point imaging.1214 SUV in malignant lesions will usually increase over time, and uptake in benign lesions will usually decrease or will remain stable. Imaging at two time points and evaluating SUV change between early and delayed imaging can improve accuracy. The disadvantage is decreased patient throughput, although this can be minimized if a limited scan is performed after completion of the whole-body scan.


    1. Accuracy improvements have been shown for thoracic and head and neck neoplasms.


      • The primary value of dual time-point imaging in the thorax is in central lesions.

    2. Dual time-point imaging may be less valuable in the abdomen.
    3. A change in lesion configuration between early and delayed images may indicate a benign etiology.
    4. The delay between early and delayed images should be 30 minutes or more.

References


  1. Thie JA. Understanding the standardized uptake value, its methods, and implications for usage. J Nucl Med 2004;45(9):1431–1434
  2. Keyes JW Jr. SUV: standard uptake or silly useless value? J Nucl Med 1995;36(10):1836–1839
  3. Hamberg LM, Hunter GJ, Alpert NM, et al. The dose uptake ratio as an index of glucose metabolism: useful parameter or oversimplification? J Nucl Med 1994;35(8):1308–1312
  4. Soret M, Bacharach SL, Buvat I. Partial-volume effect in PET tumor imaging. J Nucl Med 2007;48(6):932–945
  5. Schoder H, Erdi YE, Chao K, et al. Clinical implications of different image reconstruction parameters for interpretation of whole-body PET studies in cancer patients. J Nucl Med 2004;45(4):559–566
  6. Jaskowiak CJ, Bianco JA, Perlman SB, Fine JP. Influence of reconstruction iterations on 18F-FDG PET/CT standardized uptake values. J Nucl Med 2005;46(3):424–428
  7. Nakamoto Y, Osman M, Cohade C, et al. PET/CT: comparison of quantitative tracer uptake between germanium and CT transmission attenuation-corrected images. J Nucl Med 2002;43(9):1137–1143
  8. Souvatzoglou M, Ziegler SI, Martinez MJ, et al. Standardised uptake values from PET/CT images: comparison with conventional attenuation-corrected PET. Eur J Nucl Med Mol Imaging 2007;34(3):405–412
  9. Erdi YE, Nehmeh SA, Pan T, et al. The CT motion quantitation of lung lesions and its impact on PET-measured SUVs. J Nucl Med 2004;45(8):1287–1292
  10. Boellaard R, Krak NC, Hoekstra OS, Lammertsma AA. Effects of noise, image resolution, and ROI definition on the accuracy of standard uptake values: a simulation study. J Nucl Med 2004;45(9):1519–1527
  11. Marom EM, Munden RF, Truong MT, et al. Interobserver and intraobserver variability of standardized uptake value measurements in non-small-cell lung cancer. J Thorac Imaging 2006;21(3):205–212
  12. Dobert N, Hamscho N, Menzel C, et al. Limitations of dual time point FDG-PET imaging in the evaluation of focal abdominal lesions. Nuklearmedizin 2004;43(5):143–149
  13. Conrad GR, Sinha P. Narrow time-window dual-point 18F-FDG PET for the diagnosis of thoracic malignancy. Nucl Med Commun 2003;24(11):1129–1137
  14. Hustinx R, Smith RJ, Benard F, et al. Dual time point fluorine-18 fluorodeoxyglucose positron emission tomography: a potential method to differentiate malignancy from inflammation and normal tissue in the head and neck. Eur J Nucl Med 1999;26(10):1345–1348

Stay updated, free articles. Join our Telegram channel

Sep 3, 2016 | Posted by in GENERAL RADIOLOGY | Comments Off on Standardized Uptake Value

Full access? Get Clinical Tree

Get Clinical Tree app for offline access