Fig. 1
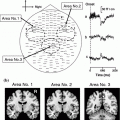
A 10 s page of ongoing MEG data, filtered at 1 to 40 Hz, with trigger and audio channels. Latency ranges marked in gray were used for epoching, from 100 ms pre- to 600 ms post-stimulus onset
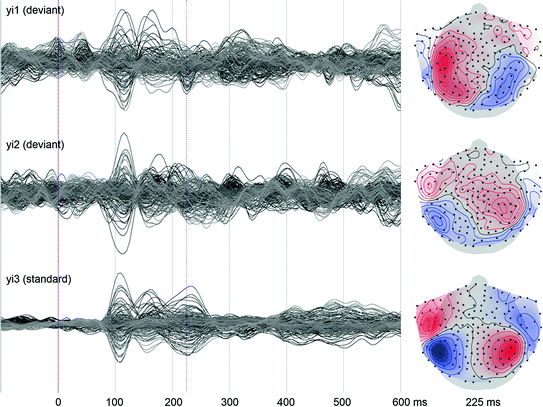
Fig. 2
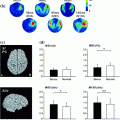
Averages and field topography maps (shown at 225 ms) for the three stimulus types
2.2 Statistical Analysis
In the context of a TANOVA, two different non-parametric randomization tests were performed for all epochs: a consistency test per stimulus type, and a test for differences between stimulus types. Statistical analysis was performed using the Curry 7 software.
The consistency test evaluates field topography (map) similarity across epochs. It is performed independently for each stimulus type and each sample. Here, the Null Hypothesis is that epochs of the same stimulus type are unrelated, i.e. that random maps have been measured. If the Null Hypothesis holds, randomly perturbing channels within each epoch’s map should not deteriorate the average map across all epochs.
For each sample s and E t epochs of stimulus type t, the test is performed as follows: First, the observed mean global field power (MGFP) P s,t,0 of the average over all epochs e of the individual maps d s,t,e is computed as

where M is the number of channels.

(1)
Then, for a total of R repetitions, the channels within each map are randomly shuffled. For each repetition r, this yields new randomized maps d s,t,e,r , and a new global field power P s,t,r can be computed according to


(2)
The probability p s,t of the Null Hypothesis is the fraction of values P s,t,r that are larger than or equal to P s,t,0 . Small values of p, traditionally p


Stay updated, free articles. Join our Telegram channel

Full access? Get Clinical Tree


