Introduction
Stroke is the second leading cause of death worldwide. Globally an estimated 16.9 million cases of new stroke occurred in 2010, resulting in 5.9 million stroke deaths. In the United States, a stroke occurs every 40 seconds, with a stroke death every 4 minutes. Although stroke mortality rates have reduced over the last 2 decades, the number of stroke survivors and disability-adjusted life-years lost from stroke is increasing. Work capacity is reduced in 70% of stroke survivors, with 30% requiring assistance with self-care. By 2030, there will be an estimated 70 million stroke survivors globally.
Stroke was defined by the World Health Organization in 1970 as “rapidly developing clinical signs of focal (or global) disturbance of cerebral function lasting more than 24 hours with no apparent cause other than of vascular origin.” Over the last 45 years since this definition was proposed, there have been advances in clinical assessment, imaging, and treatment of stroke. Thus while the term stroke can be used broadly to include ischemic stroke, cerebral hemorrhage, subarachnoid hemorrhage, and cerebral venous thrombosis, this chapter will focus on the imaging of ischemic cerebral stroke, which can be defined as neurologic dysfunction caused by focal cerebral arterial ischemia.
The diagnosis and imaging of acute ischemic cerebral stroke can be challenging, particularly when time-critical decisions need to be made for stroke treatment. Furthermore, approximately 30% of patients evaluated by an acute stroke team have a stroke mimic; 15% of those receiving intravenous tissue plasminogen activator (ivtPA) are diagnosed with a stroke mimic. Ultimately the early diagnosis of acute ischemic cerebral stroke is based on clinical assessment, but modern computed tomography (CT) and magnetic resonance imaging (MRI) are important to exclude intracranial hemorrhage, aid in the diagnosis of ischemic stroke, and aid in triage for treatment of acute major ischemic stroke. There is also emerging literature to support the greater use of imaging in minor stroke and transient ischemic attack (TIA), and imaging is important in the diagnosis of alternate mechanisms of stroke. Moreover, with increasing complexity of care for ischemic stroke patients, radiologists are integral members of the modern multidisciplinary acute stroke team. Thus the focus of this chapter will be to familiarize the radiologist with the evolving role of CT and MRI for acute ischemic stroke.
Pathophysiology of Stroke
Cerebral infarction occurs when there is insufficient blood flow to perfuse cerebral tissue, most commonly due to arterial occlusion. The vascular compromise that ultimately leads to ischemic injury is dynamic. Factors that influence tissue injury include the rate of onset and duration of ischemia, size of the downstream territory of the occluded blood vessel, the presence and adequacy of collateral circulatory mechanisms, and systemic factors such as body temperature and hyperglycemia. Patients experiencing very short durations of minor ischemia may have no detectable ischemic injury on MRI. However, if a central artery is occluded, the large size of the downstream parenchymal territory often results in severe and sustained neurologic deficit. A robust collateral circulatory mechanism may prevent or reduce the extent of ischemic injury. Conversely, an occlusion in a small perforating end-arterial vessel will often result in an infarct even with a short duration of ischemia, owing to the lack of collateral circulatory mechanisms. In addition, elevated body temperature at stroke admission is associated with greater infarct size and higher mortality, and persistent poststroke hyperglycemia is independently associated with greater tissue injury and poorer functional outcome.
Much of the CT and MRI work in stroke pathophysiology has focused on identifying and distinguishing nonviable and potentially viable tissue. The term infarct core refers to nonviable tissue that is irreversibly injured (infarcted) or with such critically reduced tissue perfusion that cellular death is inevitable. Ischemic penumbra refers to tissue that is potentially viable (i.e., with reduced perfusion that results in cellular dysfunction but not inevitable cell death). Thus penumbral tissue is dysfunctional and at risk of infarction but may recover with adequate and timely reperfusion. This is an operationalized concept that may be used to guide ischemic stroke treatment. Specifically, reperfusion treatments could be potentially provided or withheld if there are imaging tests that can accurately distinguish between core and penumbra. This is the “holy grail” of CT and MRI in acute ischemic stroke, and current imaging methods and applications used in major stroke centers will be explored below.
Clinical Assessment of Acute Ischemic Stroke
It is important for the interpreting radiologist to be aware of the degree of suspicion for ischemic stroke, common clinical syndromes and localizing features, and the severity and time of onset of neurologic symptoms; these variables may prompt different CT and MRI protocols and aid in interpretation of imaging studies.
One of the first questions faced by the stroke team is whether the patient is experiencing an ischemic stroke. Initial assessment requires consideration of all causes of acute neurologic symptoms, including nonischemic stroke, intracranial tumor or infection, or metabolic causes. The potential symptoms of ischemic stroke are varied and include facial weakness or asymmetry, limb weakness or sensory loss or incoordination, aphasia, ataxia, visual loss, and altered conscious state. Features that increase the likelihood of a stroke include the presence of facial palsy, abnormal visual fields, exact time of onset, ability to lateralize symptoms to the right or left side of the brain, history of hypertension or angina, and age older than 50 years. Conversely, patients with convulsions or history of epilepsy or migraine may have a stroke mimic.
Often it is useful to consider the pattern of neurologic symptoms and signs to identify whether they may fit a recognized and stereotyped pattern for focal arterial occlusion. This increases the likelihood of a stroke over a stroke mimic. Broadly, ischemic stroke can be classified into the anterior circulation or posterior circulation territories. The more common anterior circulation stroke refers to the anterior and middle cerebral artery territories supplied by the internal carotid arteries, whereas posterior circulation refers to territory supplied by the vertebrobasilar system, including the posterior cerebral territory. Differentiation between anterior and posterior circulation stroke may be difficult owing to the potential for considerable overlap in clinical features; however, the presence of ataxia, nausea and vomiting, vertigo, diplopia, nystagmus, oculomotor palsy, visual field defects, or crossed motor or sensory deficits should point to a posterior circulation stroke.
Similarly, ischemic stroke can be divided into cortical or subcortical stroke. A common pattern for left (dominant) anterior circulation cortical stroke includes aphasia, which may be expressive due to injury to Broca’s area, and/or receptive aphasia due to injury to Wernicke’s area, right face, arm, and leg weakness, and/or sensory loss due to injury to the motor and sensory cortex. The left middle cerebral artery (MCA) territory is more commonly affected than the anterior cerebral artery territory, and thus arm weakness is typically more pronounced than leg weakness. A common pattern for right anterior circulation cortical stroke includes hemineglect due to damage to cortical association areas, and left face, arm, and leg weakness and/or sensory loss due to injury to the motor and sensory cortex. Neurologic symptoms and signs are variable and depend on the size and eloquence of the territory affected; however, in general the presence of aphasia and/or neglect suggests cortical involvement.
Subcortical ischemic stroke often produces pure motor or sensory symptoms due to injury to the hemispheric white matter, corona radiata, internal capsule, or basal ganglia from occlusion of lenticulostriate or thalamoperforate vessels. The use of the terms lacune or lacunar infarct for all subcortical infarcts can be problematic. Historically, lacunar infarction was thought to be almost exclusively associated with small vessel lipohyalinosis and thrombosis related to cardiovascular risk factors. However, modern imaging has proved this to be incorrect—subcortical or “lacunar” infarcts may be caused by an embolic mechanism. In fact, complete or partial occlusion of the MCA is not uncommon in patients with large subcortical infarcts, concordant with an embolic mechanism.
Additional important factors are the severity of neurologic deficit and the time of symptom onset. The severity of neurologic deficit is usually communicated in terms of a standardized acute stroke severity scoring system, such as the National Institutes of Health Stroke Scale (NIHSS). The NIHSS is one of the most frequently used tools to rapidly and objectively quantify the neurologic impairment caused by acute stroke. A higher NIHSS score indicates greater severity of neurologic deficit and provides information that affects treatment decisions and patient outcome. However, practitioners must be aware that the NIHSS is weighted to dominant hemisphere stroke and may be less sensitive in posterior circulation stroke.
Time of onset is a critical variable in the clinical assessment of ischemic stroke. Patients presenting to hospital early after the onset of symptoms may be eligible for reperfusion therapies that can improve long-term functional outcome. In the United States, approximately 30% of patients arrive within 4.5 hours of symptom onset, within the time window for use of ivtPA reperfusion therapy. However, a significant number of patients have an unclear symptom onset time. In these situations, it is important to differentiate between the time when the patient was “last seen well” and when the patient was found with symptoms. The time difference could render patients eligible or ineligible for reperfusion therapies. For patients with unclear time of onset, and in particular in patients who wake up with stroke symptoms, there is increasing interest in whether advanced CT and MRI can provide a “tissue-clock” that could potentially increase the number of patients eligible for reperfusion therapies.
Treatment of Acute Ischemic Stroke
Historically the treatment of ischemic stroke has primarily been supportive therapy, rehabilitation, and secondary prevention. This includes consideration of platelet inhibition, anticoagulation, and modification of cardiovascular risk factors such as smoking, diabetes, hypertension, and cholesterol. Acute reperfusion therapy with intravenous thrombolysis has been extensively investigated over the past 2 decades and is now widely used and accepted. The benefit of intravenous thrombolysis for acute stroke was first adequately established in the 1995 National Institute of Neurological Disorders and Stroke (NINDS) tPA trial. As compared with patients receiving a placebo, those treated with tPA were more likely to have no symptoms or no significant disability (modified Rankin Scale [mRS] score 0-1) by 3 months, despite an increase in the rate of symptomatic intracerebral hemorrhage. However, patients were excluded if they had had serious head trauma or stroke within the preceding 3 months; major surgery within 14 days; history of previous intracranial hemorrhage; systolic blood pressure above 185 mm Hg; rapidly improving/minor symptoms; gastrointestinal or urinary tract hemorrhage within the previous 3 weeks; arterial puncture at a noncompressible site within the previous week; seizure at the onset of stroke; taking anticoagulants, received heparin, and had an elevated partial thromboplastin time, abnormally low platelet count, or severe hypoglycemia or hyperglycemia. Subsequent trials have confirmed the benefit of the NINDS finding and have also investigated extending the time window of treatment. Pooled results of 5 major trials suggested benefit of intravenous thrombolysis in the 3- to 4.5-hour time window after symptom onset. The third European Cooperative Acute Stroke Study (ECASS III) was specifically designed to investigate this suggested benefit. The trial confirmed benefit of therapy in this time frame but with additional exclusions for patient selection: patients older than 80 years, use of oral anticoagulation therapy regardless of INR, baseline NIHSS score greater than 25, and history of a combination of previous stroke and diabetes mellitus. Other trials are investigating the benefit of further extension to the time window of intravenous thrombolysis based on the use of advanced MRI. Although the benefit of thrombolysis has been demonstrated up to 4.5 hours after symptom onset, greater benefit is observed with earlier treatment. Patients are less likely to die or experience symptomatic intracerebral hemorrhage, and more likely to be ambulant at discharge and to be discharged home by reducing treatment delay ; each 15 minutes gained translates to an extra month of disability-free life.
Since the positive Prolyse in Acute Cerebral Thromboembolism II trial in 1999, there has been increasing interest in the role of endovascular therapy for ischemic stroke. For patients with MCA occlusion and less than 6 hours since symptom onset, patients treated with local intraarterial fibrinolysis with prourokinase and heparin infusion were more likely to have no or slight disability (mRS 0-2) as compared with patients receiving the heparin infusion alone, in spite of an increase in the rate of symptomatic intracerebral hemorrhage. However, exclusions were similar to those applied in the NINDS trial. Since this trial, multiple intraarterial therapies have been considered. These include local intraarterial fibrinolysis or thrombolysis, mechanical thromboaspiration, mechanical thrombectomy, and intracranial stenting. The evidence for endovascular therapy is complex to assess because of the multiplicity of treatment options, ongoing technologic advances, and ability to combine intraarterial and intravenous therapies. In 2013, three randomized controlled trials of endovascular treatment had neutral results, contributing to uncertainty regarding the efficacy of endovascular therapy. However, concerns were raised regarding the relatively long delays to endovascular treatment, the limited use of pretreatment CT or MR angiography to confirm proximal vessel occlusions, and the limited use of more recent-generation mechanical thrombectomy devices such as retrievable stents. More recent publications in 2015 have found benefit to endovascular therapy compared to intravenous thrombolysis alone. For patients with a proximal anterior circulation occlusion treated rapidly (within 6 hours of symptom onset), endovascular therapy achieves higher rates of early neurologic recovery and functional independence without significant differences in symptomatic hemorrhage. The respective roles of various intravenous and endovascular reperfusion therapies continues to evolve, with continuing investigation of patient selection for treatment, novel intravenous thrombolytics, novel methods of endovascular reperfusion, and refining measures of treatment effectiveness.
Imaging Goals of Acute Ischemic Stroke
With the advent of both intravenous and endovascular reperfusion therapies for stroke, the radiologist has become an integral multidisciplinary member of the team evaluating patients with ischemic stroke arriving within the treatment window, and has a clear role in the stroke “chain of survival.” The overall goal is to provide rapid access to brain imaging and expert interpretation, which is critical for the diagnosis and triage of patients with acute severe ischemic stroke. Quality metrics proposed for stroke teams include a door-to-CT time of less than 25 minutes and door-to-CT interpretation time of less than 45 minutes. Time metrics have been proposed for endovascular treatment, and radiology departments will need to expedite multidisciplinary workflow to meet the demands of modern stroke treatment.
Clinical assessment and noncontrast CT (NCCT) remains sufficient to satisfy the inclusion criteria for the NINDS trial, provided there is no intracranial hemorrhage. The impact of ischemic changes on patient outcome after ivtPA treatment was investigated in a post hoc analysis of ECASS I trial data. This revealed no treatment benefit in patients with over one third MCA territory infarction, and is the source of the commonly used exclusion criteria for ivtPA treatment used in the subsequent ECASS trials. However, since the original ECASS and NINDS trials were published in 1995, there has been increasing interest in further refining acute stroke imaging and treatment triage. Specifically, apart from exclusion of intracranial hemorrhage and ensuring there is not a large established infarct, there is interest in confirming the diagnosis of ischemic stroke over a stroke mimic to potentially avoid treatment risk from reperfusion therapy, identifying the presence/absence of a proximal vessel occlusion that may affect choice of reperfusion therapy and prognosis, identifying the brain parenchymal territory involved, identifying how much infarct core and penumbra are present, and whether an etiology (e.g., embolus from carotid stenosis/dissection) can be identified, and determining how these factors affect prognosis, particularly in the acute setting. It must be considered that acquiring this extra information may incur treatment delay, and that institutional efforts should be directed to a rapid, consistent, and reliable approach to provide timely and rapid access to reperfusion therapies. Both CT and MRI provide the platform for rapid multimodal imaging; often an institution will choose to adopt either CT or MRI as its primary strategy ( Box 11-1 ). The utility of both CT and MRI to answer the imaging goals of ischemic stroke is explored below.
Noncontrast CT, brain (skull base to vertex)
- •
5-mm axial, coronal, and sagittal reformats
- •
2.5-mm axial, coronal, and sagittal reformats
- •
CT angiogram (aortic arch to vertex)
- •
0.7-mm axial acquisition
- •
15/2-mm maximum intensity projection (MIP) axial, coronal, and sagittal reformats of brain (skull base to vertex)
- •
10/2-mm MIP coronal and sagittal reformats of neck
- •
CT perfusion (8-cm field of view)
- •
MTT, TTP, CBV, and CBF parametric color maps
- •
Postcontrast CT, brain
- •
5-mm axial, coronal, and sagittal reformats
- •
Exclude Intracranial Hemorrhage
Any acute intracranial hemorrhage (ICH) is a contraindication for acute reperfusion therapy ( Fig. 11-1 ). This may be intracerebral hemorrhage, subarachnoid hemorrhage, and subdural or extradural hematoma. Although NCCT is used as the standard-of-care test to exclude intracranial hemorrhage, apart from a small number of patients with autopsy correlation, there are no level I data to definitively evaluate the sensitivity of NCCT for ICH detection. Regardless, CT has been used in multiple stroke trials for detection of ICH.

The appearance of ICH on CT depends on the time elapsed since the hemorrhage. In general there is a linear relationship between CT attenuation and hemorrhage hemoglobin protein content. In the hyperacute phase, the ICH consists of red and white blood cells, platelets, and serum that confer an attenuation of approximately 30 to 60 Hounsfield units (HU). Over the next few hours, clot retraction occurs with increasing attenuation, generally to 60 to 80 HU, but potentially up to 100 HU. The overall CT appearance is dependent on the plasma hemoglobin content, patient coagulation mechanisms, and slice thickness of the CT imaging technique. As further time elapses, the attenuation of the ICH on NCCT reduces, and by 3 weeks is generally less than the surrounding brain tissue.
MRI is considered equivalent to CT for detection of intracranial hemorrhage. The appearance of ICH on MRI is more complex, and the signal characteristics depend on the state of the iron atoms within the hemoglobin of the ICH and the red cell membranes. Intraparenchymal hemorrhage evolves through five distinct stages depending on time from onset. This can be divided into the hyperacute (first few hours), acute (hours to days), early subacute (days to weeks), late subacute (weeks to months), and chronic phases (months). Typical findings are detailed in Box 11-2 and seen in Figure 11-2 . Acute subarachnoid hemorrhage and intraventricular hemorrhage are best detected with a combination of fluid-attenuated inversion recovery (FLAIR) or double inversion recovery (DIR) MR images, and susceptibility weighted imaging (SWI).
Hyperacute (oxyhemoglobin)
- •
T1 isointense
- •
T2 isointense to hyperintense
- •
Acute (deoxyhemoglobin)
- •
T1 isointense
- •
T2 hypointense
- •
Early subacute (intracellular methemoglobin)
- •
T1 hyperintense at periphery
- •
T2 hypointense
- •
Late subacute (extracellular methemoglobin)
- •
T1 hyperintense
- •
T2 hyperintense
- •
Chronic (hemosiderin)
- •
T1 hypointense
- •
T2 hypointense
- •

Is It an Ischemic Stroke?
The presence of radiologic changes on imaging tests that are concordant with the clinical symptoms and signs is helpful in the diagnosis of a true ischemic stroke and excluding a stroke mimic. Ultimately, however, the diagnosis of ischemic stroke is clinical and not based on any sole radiologic test. Moreover, even with sensitive MRI techniques, imaging can be negative in cases of true ischemic stroke, particularly if symptoms are transient or clinically localized to the brainstem or subcortical territory.
NCCT findings of parenchymal hypoattenuation or swelling in a topographic distribution concordant with the clinical symptoms can confirm the clinical diagnosis of stroke ( Fig. 11-3 ). However, NCCT findings are time dependent and may be normal or near normal even in the setting of established or large infarct, particularly within the first 3 hours of stroke onset ( Fig. 11-4 ). Additional NCCT detection of a hyperdense thrombosed intracranial vessel can also confirm the stroke diagnosis. However, even using modern CT scanner technology for patients who may be eligible for reperfusion therapies, the diagnostic sensitivity for NCCT is approximately 50%. The addition of CT angiography (CTA) for detection of vessel occlusion increases sensitivity by another 10% to 15%. In addition, if the typical topographic distribution of infarction is discernable on the source images of the CTA, this too confirms the diagnosis of ischemic stroke rather than stroke mimic. Overall, a multimodal imaging incorporating CT perfusion (CTP) provides the highest CT-based imaging sensitivity for confirming diagnosis of ischemic stroke ( Fig. 11-5 ). Postcontrast CT may be helpful to aid rapid recognition of enhancing tumors that may mimic stroke by presenting with postictal neurologic deficit ( Fig. 11-6 ). Nonetheless, CT-based imaging strategies remain limited in their sensitivity for detection of subcortical and brainstem stroke.


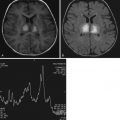
MRI findings of parenchymal FLAIR and T2 hyperintensity and swelling in a topographic distribution concordant with the clinical symptoms also confirm the clinical diagnosis of stroke (see Fig. 11-3 ). However, similar to the parenchymal findings on CT, FLAIR may be negative, particularly within the first 3 hours of stroke onset, and the infarct only detectible on diffusion-weighted imaging (DWI). Thus it has been proposed that a rapid stroke imaging protocol using DWI scans alone may be of benefit in confirming the diagnosis of ischemic stroke and excluding stroke mimics. However, there remain issues with detection of small subcortical and brainstem strokes, particularly when DWI is performed within the first few hours of stroke onset. The use of MR angiography (MRA) and MR perfusion techniques may also increase diagnostic confidence for ischemic stroke if vessel occlusions or typical ischemic perfusion patterns are discernible. Moreover, by performing further MR sequences, an alternate cause for symptoms may be discernible ( Fig. 11-7 ).

Is There an Intracranial Vessel Occlusion?
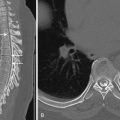
Detection of a hyperdense thrombosed intracranial vessel on NCCT can provide confirmation of ischemic stroke diagnosis before parenchymal changes are discernible. Common locations include the horizontal or M1 segment of the MCA, the sylvian or M2 segment of the MCA, the terminal internal carotid artery, and the basilar artery. Identification of the hyperdense vessel on NCCT provides information about thrombus burden and has prognostic and therapeutic information. In particular, patients with a hyperdense vessel have greater thrombus burden, greater likelihood of early ischemic parenchymal changes, more severe neurologic presentation, and less likelihood of early neurologic recovery even after intravenous thrombolysis. Importantly, use of thin sections (≤2.5 mm) allows greater detection of hyperdense vessels ( Fig. 11-8 ). CTA is highly accurate for detection of central large vessel occlusions, with a “flow-gap” or vessel “cutoff” being diagnostic for a vessel occlusion. However, CTA only provides a snapshot in time and thus may not allow sufficient time for collateral flow to reach the distal end of the thrombus. This can result in overestimation of thrombus length on CTA, and the use of NCCT may be more accurate ( Fig. 11-9 ). On MRI, vessel occlusion may result in altered arterial T1, T2, or FLAIR signal, or T2* imaging, but greater sensitivity is achieved with SWI ( Fig. 11-10 ). Similar to CTA, MRA can be used for detection of vessel occlusion; however, MRA is prone to overestimation of vessel stenosis and typically limited to the more central vasculature compared to CTA.


How Big Is the Infarct Core?
The term infarct core refers to nonviable tissue that is irreversibly injured or with such critically reduced tissue perfusion that cellular death is inevitable. DWI is considered the gold standard for established and irreversible infarct, because DWI reversal is considered uncommon. The DWI sequence is sensitive to disruption of the normal random movement (diffusion) of water molecules. Proposed mechanisms for reduced water diffusivity in cerebral infarction include cell wall dysfunction with associated intracellular/extracellular water shift, increased intracellular viscosity, and increase in extracellular space tortuosity. DWI is obtained by using gradient pulses incorporated into a T2-weighted sequence. Both T2 and diffusion contribute to image contrast, with the magnitude of the diffusion weighting known as the b value. The b value is dependent on gradient duration, amplitude, and interval, with higher b values reflecting greater diffusion weighting. At high b values, diffusion properties are the main determinant of image contrast; however, the T2 component may remain visible, potentially leading to an effect known as T2 shine-through. The DWI image should be interpreted with the apparent diffusion coefficient (ADC) map, a postprocessed image where tissue contrast is dependent only on diffusion. Restricted diffusion, confirming infarct core, is characterized by increased DWI signal with typical corresponding decrease in ADC signal. In contrast, T2 shine-through is characterized by increased DWI signal with corresponding increase in signal on the ADC map. Changes of restricted diffusion manifest within minutes after acute infarction and peak between 24 and 72 hours. However, occasionally, early DWI may result in only faint or minimal changes on DWI, and thus both DWI and ADC maps should be carefully scrutinized in cases of hyperacute stroke (see Fig. 11-4 ).
Although some institutions use MRI as their primary stroke-imaging strategy because of the increased sensitivity of DWI over CT for established infarct, other institutions have been searching for a reliable and valid alternative using CT, given the rapidity and greater availability of CT imaging techniques. NCCT signs of established infarct are parenchymal hypoattenuation and swelling. Specifically in the MCA territory, loss of gray-white attenuation of the insular ribbon and hypoattenuation in the lentiform nuclei are considered early signs of MCA infarction. Adjusting the window width and level of the CT image increases detection of early ischemic changes ( Fig. 11-11 ). More standardized methods of assessment for early ischemic change is achieved by using standardized reporting templates, such as the Alberta Stroke Program Early CT Score (ASPECTS). ASPECTS was proposed as a more accurate and practical alternate method for clinicians and radiologists to assess the extent of parenchymal injury. Moreover, since an increase in the rates of death and dependency occurred with patients treated with intravenous thrombolysis if pretreatment ASPECTS was 7 or less, it has been suggested as an alternate to the “1/3 MCA rule.” However, there is only moderate interrater reliability for using ASPECTS in such a dichotomized fashion, which may have an impact on utility. As an alternate to NCCT, the source image from CTA provides additional information for the detection of ischemic change. Although initially considered to be as reliable as DWI in assessing the size of the infarct core, CTA source images on faster modern CT scanners commonly overestimate infarct core size.

CTP techniques show increasing promise in the accurate detection of infarct core. CTP data are obtained by monitoring the passage of a bolus of iodinated contrast media through the cerebral parenchyma via serial CT scans. Complex mathematical equations are used to calculate the average time for the contrast bolus to pass through each part of the imaged brain parenchyma (mean transit time [MTT]), the time to peak enhancement (time to peak [TTP]), the volume of blood within each part of the imaged brain parenchyma (cerebral blood volume [CBV]), and the volume of blood passing through each part of the brain parenchyma over time (cerebral blood flow [CBF]). Each CT image is usually obtained in the axial plane, typically every 1 to 1.5 seconds for approximately 60 seconds. Interpretation is typically by visual inspection of color-coded parametric maps displaying MTT, TTP, CBV, and CBF data. Modern multislice scanners are able to assess the whole brain in a single examination, with the potential to display perfusion data in multiple planes ( Fig. 11-12 ).

There is debate on which is the best CTP parameter to delineate infarct core. Early data suggested that CBV provided the most accurate measure of core volume. More recent data suggest that relative CBF may be the most robust parameter. Importantly, there is significant variation in perfusion maps depending on the CT scanner and postprocessing software used, and thus each local institution should gain their own experience using their own postprocessing software. Current research trials are investigating the feasibility of automated software to improve reproducibility and provide standardization, and these may be available for routine clinical use in the near future.
How Big Is the Penumbra?
The term penumbra refers to tissue that is potentially viable (i.e., with reduced perfusion that results in cellular dysfunction but not inevitable cell death). Thus penumbral tissue is at risk of infarction but may recover with adequate and timely reperfusion. Importantly the distinction of infarct core and penumbra were not used in the NINDS or ECASS trials, and thus intravenous thrombolysis is generally administered after initial NCCT imaging at most centers.
Within 3 hours of stroke onset, penumbral information may be evident on NCCT. It has been postulated that areas of brain parenchyma that are isoattenuating and slightly swollen may represent penumbral tissue rather than established infarct. However, the majority of ischemic penumbra appears normal on NCCT. CT and MR perfusion MTT or TTP maps are most commonly used in comparison to the CBF or CBV maps to estimate the size of the penumbra. In addition TMax maps may also be obtained based on further mathematical equations. MTT and TTP abnormalities may be discernible immediately after symptom onset, making CTP a valuable tool to confirm the suspicion of ischemic stroke. Large cortical perfusion abnormalities, such as those that occur with proximal vessel occlusion, are easier to detect than smaller or subcortical perfusion abnormalities. MTT and TTP abnormalities are difficult to detect in the posterior fossa, because this area is prone to artifact on CT and may not be adequately included during CTP. Importantly, for clinical use it must be noted that there is variation in the appearance of the perfusion maps depending on the CT scanner and postprocessing software used. For ischemic stroke trial use, more reproducible information is required, and thus various CTP parameters have been validated against MRI, with CT and MR TMax greater than 6 seconds considered reliable in the assessment of penumbra.
The great interest in core and penumbral assessment is in the advancement of the mismatch hypothesis. The mismatch hypothesis is based on identification of the infarct core and the penumbra, with the volumetric difference representing the mismatch (i.e., tissue at risk of infarction without timely reperfusion) ( Fig. 11-13 ). Restoration of perfusion to the penumbral tissue results in clinical recovery, and thus patients with mismatch could be selected for reperfusion therapies. This promising concept is being investigated in a number of trials, particularly those outside traditional treatment windows (wake-up strokes, >4.5 hours since presentation), because mismatch may persist for at least 48 hours in selected cases. The mismatch concept could facilitate treatment of a larger number of stroke patients, as the majority of stroke patients present to hospital outside the traditional intravenous thrombolysis treatment window of 4.5 hours.

Is There an Etiology Evident?
There are a number of risk factors for ischemic stroke, such as age, male sex, hypertension, diabetes, hypercholesterolemia, smoking, and family history of cerebrovascular disease. However, the exact stroke trigger that initiated the ischemic event often remains unclear. Over 20 years ago, the Trial of Org 10172 in Acute Stroke Treatment (TOAST) investigators created a clinical classification system of inferred stroke etiology that has been widely adopted in stroke registries and trials. The TOAST classification recognizes 5 etiologies: (1) large-artery atherosclerosis, (2) cardioembolism, (3) small-artery occlusion, (4) stroke of other determined etiology, and (5) stroke of undetermined etiology. Diagnosis is based on clinical features, laboratory tests, and imaging of the brain, heart, and cervicocranial vessels. For a large-artery atherosclerosis mechanism, more than 50% stenosis of the relevant intra- or extracranial vessel is required, as is exclusion of a cardiac embolic cause. However, over the last 20 years, there have been advances in imaging, and in particular, use of DWI has become routine in the evaluation of ischemic stroke. This has shed further light on the vascular mechanisms of stroke and facilitates more accurate, consistent, and evidence-based classification of the cause of ischemic stroke in the individual patient.
The use of modern CT and CTA or MR and MRA techniques can help determine ischemic stroke etiology. A large-artery mechanism is most likely in the setting of high-grade stenoocclusive disease with an infarct in the relevant vascular territory and the absence of acute infarction in other vascular territories. However, while the TOAST classification would consider greater than 50% stenosis of the relevant vessel for a large-artery atherosclerosis mechanism, complex plaque with lesser degrees of stenosis may also provide an embolic source. Thus the degree of stenosis is best used to determine the need for carotid endarterectomy rather than necessarily determine the stroke etiology.
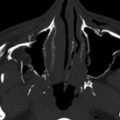
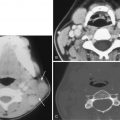
MRI with DWI provides the greatest sensitivity for detection of small acute infarcts. Similarly, detection of multiple acute infarcts closely related in time in both the right or left anterior and/or posterior circulations makes a central embolic cause most likely. In certain cases, the intramural hemorrhage from arterial dissection and secondary occlusion or embolic infarction may be evident on CT or MRI ( Fig. 11-14 ). In particular, cervicocranial arterial dissection should be considered in patients who do not have typical stroke risk factors, when there is a history of neck trauma or manipulation, connective tissue disorders, or where there are supporting clinical features such as neck pain.

Prognostication
Although multiple factors such as age and severity of neurologic deficit affect the clinical outcome of a patient with ischemic stroke, there are imaging factors that also provide early prognostic information. The size of the infarct core prior to acute reperfusion therapy is a predictor of clinical outcome and response to therapy and can be assessed using CT and MRI techniques as described previously. In particular, patients with NCCT ASPECTS less than 7 and DWI volumes of more than 70 to 100 cc are more likely to have poor functional outcome regardless of reperfusion and may incur harm with acute reperfusion therapies. In addition to the core volume, infarct location in more eloquent areas—in particular the internal capsule or corona radiata—adversely affects outcome. The presence of proximal intracranial vessel occlusion is another strong predictor of clinical outcome, with greater thrombus burden leading to poorer clinical outcome. Moreover, greater thrombus burden may be less responsive to intravenous reperfusion therapies and require alternate endovascular approaches.
Complications of Acute Stroke Treatment
The major concern after acute reperfusion therapy for ischemic stroke is intracranial hemorrhage. In the NINDS trial, as assessed by CT scan performed at 24 hours or with clinical suspicion for hemorrhage before 36 hours, asymptomatic hemorrhage occurred in 11% of patients treated with intravenous thrombolysis; 6% overall were symptomatic. In the ECASS III trial, as assessed by CT or MRI performed before 36 hours, 27% of treated patients had any intracranial hemorrhage; overall 2% were symptomatic. The rates of any intracranial hemorrhage after endovascular reperfusion approximates 20% to 30%, with rates of symptomatic hemorrhage ranging between 2% and 7%. However, multiple variables have an impact on the likelihood of symptomatic hemorrhage, including age, severity of neurologic deficit, infarct size, and serum glucose levels.
To accurately characterize complications, it is important to distinguish between hemorrhagic infarction and parenchymal hematoma formation. For accuracy of interpretation it is useful to consider the definitions used in stroke trials, and in particular the ECASS trials. This defined hemorrhagic events on CT as hemorrhagic infarction (HI) types I and II and parenchymal hematoma (PH) types I and II. HI I was defined as small petechiae along the infarct margins of the infarct; HI II, confluent petechiae within the infarct but without mass effect; PH I as focal blood clot in less than 30% of the infarct area, with mild mass effect; and PH II as focal blood clot greater than 30% of the infarct volume, with significant mass effect. PH II was a significant predictor of poor clinical outcome; other types may have less impact on clinical outcome. Of note, these hemorrhagic events were typically assessed with CT, and the advent of new MRI techniques such as SWI can increase the detection of intracranial hemorrhage ( Fig. 11-15 ). This makes it even more important to distinguish between hemorrhagic infarct and parenchymal hematoma, because HI is common after ischemic stroke and particularly after reperfusion therapies. In addition, little is known about the normal temporal evolution of ischemic stroke on SWI, which may include development of minor HI that is not discernible on CT or conventional MRI. This may more closely reflect the higher incidence of HI evident on autopsy studies as compared to CT studies.

Hemorrhagic events should also be distinguished from the common parenchymal or subarachnoid contrast staining that can mimic hemorrhage after endovascular stroke therapy. Although this may be distinguishable with delayed interval CT or MRI, the dual energy CT techniques provide a useful alternative for immediate distinction on posttreatment CT scans. Endovascular stroke therapy may also lead to procedural embolic complications and infarcts in remote territories. Although this occurs in fewer than 15% of cases, it may adversely affect clinical outcomes. Thus interpretation of posttreatment imaging should assess for the presence of hemorrhagic complications, contrast staining, and new embolic infarcts.
Imaging of Acute Subcortical/Perforator Artery Territory Stroke
Subcortical ischemic stroke occurs in the territories of the deep or superficial perforating vessels. Deep perforating arteries include medial and lateral lenticulostriate arteries arising from the proximal anterior and middle cerebral arteries, branches of the anterior choroidal artery, and thalamoperforator arteries arising from the posterior communicating and posterior cerebral arteries. These supply the deep gray nuclei, internal capsule, and a variable volume of surrounding white matter. Superficial perforating arteries are the terminal branches of cortical arteries, extending from the cortex toward the lateral ventricles, supplying subcortical and deep white matter.
The clinical diagnosis of a subcortical/perforator territory stroke may be suspected by the absence of cortical symptoms and pure sensory or motor symptoms. However, this is not specific; small cortical infarcts can mimic the clinical symptoms of a subcortical infarct. Small hemorrhages in an appropriate territory can produce similar findings. Moreover, the etiology may be single perforator involvement or multiple perforator involvement, such as that evident with a striatocapsular stroke involving the caudate, putamen, and anterior limb of the internal capsule, which is most commonly caused by embolic occlusion of the MCA. These patients do derive benefit from the use of intravenous thrombolysis, and the use of CT and MRI for assessment of the brain parenchyma and vasculature helps confirm the diagnosis and infarct territory and assess for the etiology.
NCCT may be normal early in acute subcortical/perforator territory stroke and may become evident as a focal area of hypoattenuation. However, this may be indistinguishable from more established infarcts or dilated perivascular (Virchow-Robin) spaces, and thus MRI with DWI is the examination of choice for radiologic confirmation ( Fig. 11-16 ). Established perforator territory infarcts may have central cavitation and a typical rim of elevated FLAIR signal, whereas perivascular spaces typically follow cerebrospinal fluid (CSF) signal on all sequences, without a rim of elevated FLAIR signal. Vascular imaging with CTA or MRA should also be considered because occasionally patients with a clinical subcortical/perforator territory stroke and normal CT scan may harbor a large vessel occlusion. The spatial resolution of current clinical CTA and MRA is not sufficient to accurately resolve the perforating vessels and reliably assess for perforator vessel occlusion. There is increasing interest in examining the role of CTP techniques in the diagnosis of subcortical/perforator territory stroke, but there remain issues with sensitivity owing to small lesion size.