Fig. 1.
Reconstructed transmural views A. WKY tissue (left) and the collagen structure (right). Arrow indicates large vessel B. SHR tissue (left) and the collagen structure (right). Image volumes for A and B are 3.50 × 0.92 × 0.73 mm and 4.04 × 1.50 × 0.30 mm, respectively.
2.2 Tissue Modeling
Connectivity and Volume Distributions. Quantitative comparisons of the WKY and SHR tissues were made at a supra-cellular scale. Viable myocytes, collagen and extracellular space were differentiated on the basis of image intensity using custom ranges in ImageJ (www.imagej.nih.gov). To calculate volume and connectivity measures, spherical and shell summation weighted filters (radii 5 voxels or 0.01 mm) were applied to the 3D segmented images using FFTs. A binominal filter was used to smooth the tissue volume and surface area to 8 µm resolution. Connectivity is the relative measure of the surface area of segmented myocytes in physical contact with neighboring myocytes.
Structural Orientations. The principal structural directions of the image volume were estimated using structure tensor analysis [13]. A 1D FFT approach with optimal gradient operators provided an estimate of voxel intensity gradients throughout the volume and these were used to construct structure tensors. Eigen-analysis of the structure tensors defined fiber orientations (smallest eigenvalue) and the cleavage planes that separate layers of myocytes (largest eigenvalue).


Fig. 2.
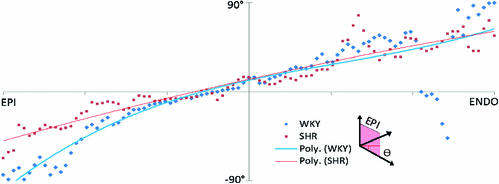
Myofiber organisation of WKY (blue) and SHR (red) tissue. Fiber angle distribution from the epicardium and endocardium are presented along with a fitted cubic trendline (Color figure online).
Network Descriptions of Tissue. The topology of a segmented image of viable myocardium was described by a 3D network of node volume and edges. To create a network, the image volume was tessellated into a mesh of conforming voxel units, the discrete volumes and representative nodal locations of surviving myocardium within each unit were determined, and the connection areas and representative edge locations between units were identified. Multiple discrete fiber tracts through a voxel unit were treated as independent network components. The complete topologies of a network description of both the tissue sets were determined from the independent components using an efficient algorithm based on multiple applications of Quicksort [14]. Tissue fiber and sheet orientations were projected onto the network description.
Activation Modeling. Activation was simulated through the tissue network description using a finite volume discretization of a monodomain reaction-diffusion model. Cell membrane currents were solved using a Luo-Rudy dynamic model [15]. The parameters used were as follows: time step 0.005 ms, cell membrane surface area to volume ratio 200 mm−1, membrane capacitance 0.0112 µF/mm2, and ( ) (0.1368,0.0583,0.0583) ms/mm. Stimuli were located in the midwall of each tissue sample. Activation and repolarization times were used to determine conduction velocities and action potential distributions.
 ) (0.1368,0.0583,0.0583) ms/mm. Stimuli were located in the midwall of each tissue sample. Activation and repolarization times were used to determine conduction velocities and action potential distributions.
2.3 3D Cellular Imaging
In addition to the myocardial sheet scale tissue comparisons, analysis at the cellular coupling scale is important for understanding fibrotic tissue remodeling in SHR vs WKY rats. Adult rat hearts were excised and immediately perfused using a Langendorff system with cold saline and fixed with Paraformaldehyde (PFA) 4 %. The tissue was cut transversely into 3 mm thick rings and placed overnight in 4 % PFA. To label for intercalated disks and viable myocytes the tissue was then placed overnight into a Phosphate-buffered saline (PBS) triton 0.3 % solution with anti Cx43 (Sigma) and phalloidin conjugated to 488 nm (Sigma) at dilutions of 1:1000 and 1:100 respectively. A secondary antibody 568 nm label was used to mark for the Cx43. An alternate labeling for cell membranes was wheat germ agglutinin (WGA) conjugated with a 488 nm secondary antibody (LifeTech) at 1:50 dilution. The tissue was thoroughly washed with PBS to remove unattached immunolabels. Specimens were dehydrated in a graded ethanol series and optically cleared with BABB solution until transparent (~3 days). Specimens were imaged using a Nikon TE2000 confocal microscope with 20x dry and 40x oil immersion objectives.
3 Results
Key structural similarities and differences between two WKY and SHR tissue samples are shown in Fig. 1. Additional tissue samples will be analyzed in future work.
A typical transmural myofiber rotation occurs in both the WKY and SHR samples through most of the heart wall (Fig. 2). However, there is some difference in the sub epicardial region.


Fig. 3.
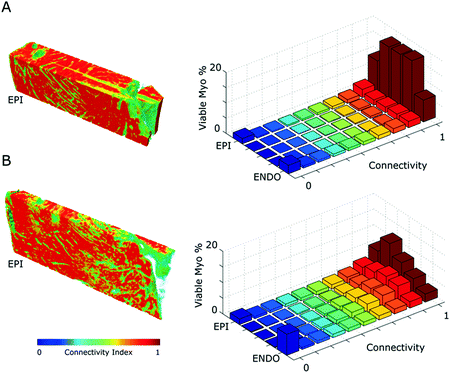
Myocyte connectivity and volume fraction measures. A. Preserved myocytes rendered with normalised connectivty field for WKY tissue. The frequency histograms display variation in viable myocyte and connectivty changes in subvolumes from epi to endo. B. SHR tissue measurements as in A.
Figure 3 shows the relative surface area in physical contact (connectivity) for the segmented myocardium. The WKY tissue is more connected compared to the SHR. The right-hand panels show the proportion of viable myocardium across the heart wall, for a given connectivity. Connectivity is more symmetrically distributed in the WKY tissue. The majority of the tissue is well connected through the midwall, however marked reductions are observed in the both the epicardial and endocardial regions. In contrast, in the SHR sample, the distribution of highly connected tissue is asymmetric; biased toward the epicardium. There are more instances of reduced connectivity through the midwall than in the WKY sample.
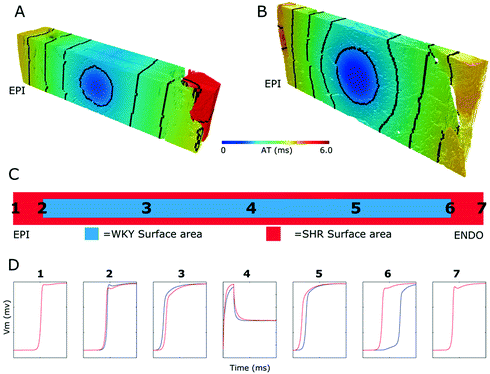
The functional impacts of structural remodeling were investigated by simulating electrical activity in both the WKY and SHR models. Figure 4 shows that for these samples the progress of activation is similar (Fig. 4A and B), although activation is slower moving toward the epicardium in the case of the SHR model compared to the WKY (Fig. 4D). The opposite is the case moving toward the endocardium (Fig. 4D). The coupling (and hence loading differences) between the WKY and SHR models is illustrated by the different potential profiles relative to the stimulus site (Fig. 4D). The endocardial delayed activation in the WKY model arises from the narrow coupling tract between the main bulk of tissue and the endocardial trabeculation. Both the conduction velocities (CV) and the action potential durations (APD) are similar for both models (Fig. 5). The CV distributions (Fig. 5A and B, insets) indicate that overall the CV is slower for the SHR model.


Fig. 4.


Predicted activation times (AT) and potentials. A. Activation in WKY tissue. Contours at 1 ms. B. Activation in SHR tissue. C. Relative widths of tissue models. Locations of potential traces are indicated (1–7). D. WKY (blue) and SHR (red) potential (Color figure online).
Stay updated, free articles. Join our Telegram channel

Full access? Get Clinical Tree


